| Param | Original file | Final file |
|---|---|---|
| Filename | modeM0/AS1T01_072T04_9000000342_02204cztM0_level2.evt | modeM0/AS1T01_072T04_9000000342_02204cztM0_level2_quad_clean.evt |
| Size (bytes) | 1,087,421,760 | 71,455,680 |
| Size | 1.0 GB | 68.1 MB |
| Events in quadrant A | 4,008,536 | 530,297 |
| Events in quadrant B | 3,496,755 | 550,274 |
| Events in quadrant C | 20,152,203 | 30,042 |
| Events in quadrant D | 4,755,523 | 515,261 |
| Mode M0 | |||
|---|---|---|---|
| Quadrant | BADHDUFLAG | Total packets | Discarded packets |
| A | 0 | 17576 | 2 |
| B | 0 | 15937 | 2 |
| C | 0 | 65594 | 20 |
| D | 0 | 19795 | 2 |
| Mode SS | |||
|---|---|---|---|
| Quadrant | BADHDUFLAG | Total packets | Discarded packets |
| A | 0 | 154 | 0 |
| B | 0 | 154 | 0 |
| C | 0 | 154 | 0 |
| D | 0 | 154 | 0 |
| Mode M9 | |||
|---|---|---|---|
| Quadrant | BADHDUFLAG | Total packets | Discarded packets |
| A | 0 | 2 | 0 |
| B | 0 | 1 | 0 |
| C | 0 | 1 | 0 |
| D | 0 | 3 | 0 |
| Quadrant | Total seconds | Saturated seconds | Saturation percentage |
|---|---|---|---|
| A | 7702 | 242 | 3.142041% |
| B | 7702 | 87 | 1.129577% |
| C | 7700 | 7700 | 100.000000% |
| D | 7702 | 280 | 3.635419% |
Noise dominated data is calculated using 1-second bins in cleaned event files. If a bin has >2000 counts, and if more than 50% of those come from <1% of pixels, then it is considered to be noise-dominated and hence unusable.
| Quadrant | # 1 sec bins | Bins with >0 counts | Bins with >2000 counts | High rate bins dominated by noise | Noise dominated (total time) | Noise dominated (detector-on time) | Marked lightcurve |
|---|---|---|---|---|---|---|---|
| A | 7941 | 7703 | 148 | 148 | 1.86% | 1.92% | 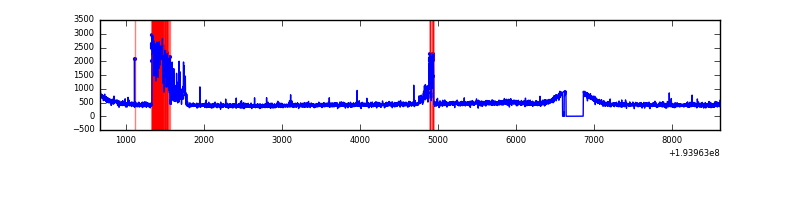 |
| B | 7941 | 7702 | 2 | 2 | 0.03% | 0.03% | 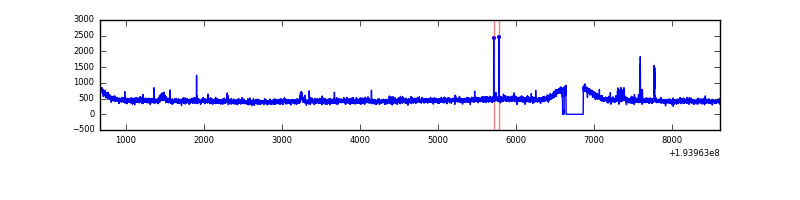 |
| C | 7942 | 7703 | 7621 | 7621 | 95.96% | 98.94% | 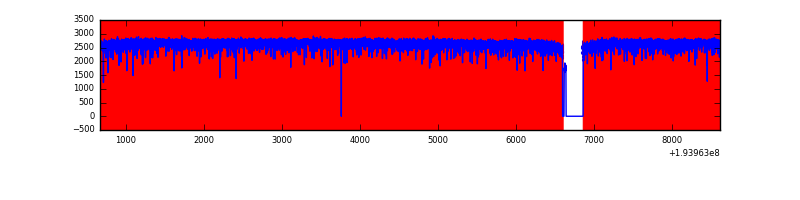 |
| D | 7941 | 7702 | 254 | 254 | 3.20% | 3.30% | 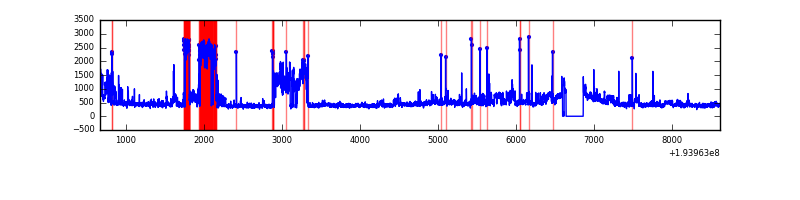 |
Top three noisy pixels from each quadrant. If the there are fewer than three noisy pixels in the level2.evt file, extra rows are filled as -1
| Pixel properties | Quadrant properties | ||||||
|---|---|---|---|---|---|---|---|
| Quadrant | DetID | PixID | Counts | Sigma | Mean | Median | Sigma |
| A | 15 | 171 | 654189 | 3669.96 | 864 | 842 | 178.0 |
| A | 10 | 2 | 22744 | 123.03 | 864 | 842 | 178.0 |
| A | 12 | 194 | 9763 | 50.11 | 864 | 842 | 178.0 |
| B | 6 | 219 | 36075 | 202.59 | 891 | 866 | 173.8 |
| B | 4 | 200 | 20744 | 114.38 | 891 | 866 | 173.8 |
| B | 3 | 0 | 16451 | 89.67 | 891 | 866 | 173.8 |
| C | 7 | 111 | 6653984 | 83493.56 | 121 | 110 | 79.7 |
| C | 0 | 187 | 2927154 | 36728.88 | 121 | 110 | 79.7 |
| C | 7 | 247 | 1532113 | 19223.75 | 121 | 110 | 79.7 |
| D | 7 | 223 | 1514260 | 7555.12 | 836 | 812 | 200.3 |
| D | 2 | 54 | 17205 | 81.83 | 836 | 812 | 200.3 |
| D | 15 | 194 | 15476 | 73.2 | 836 | 812 | 200.3 |
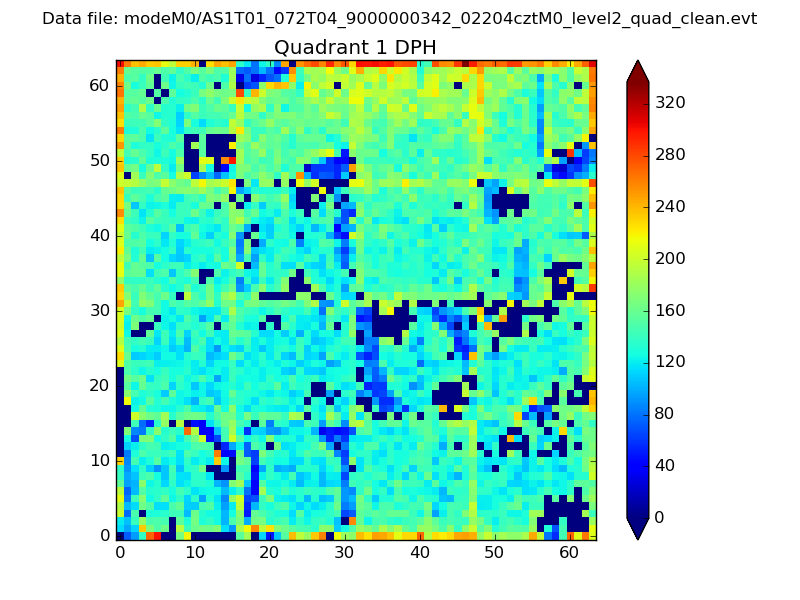
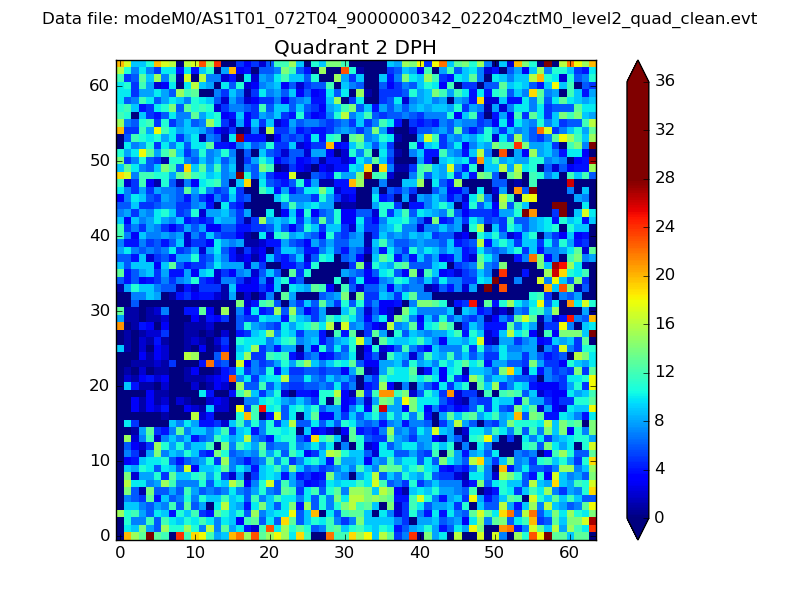
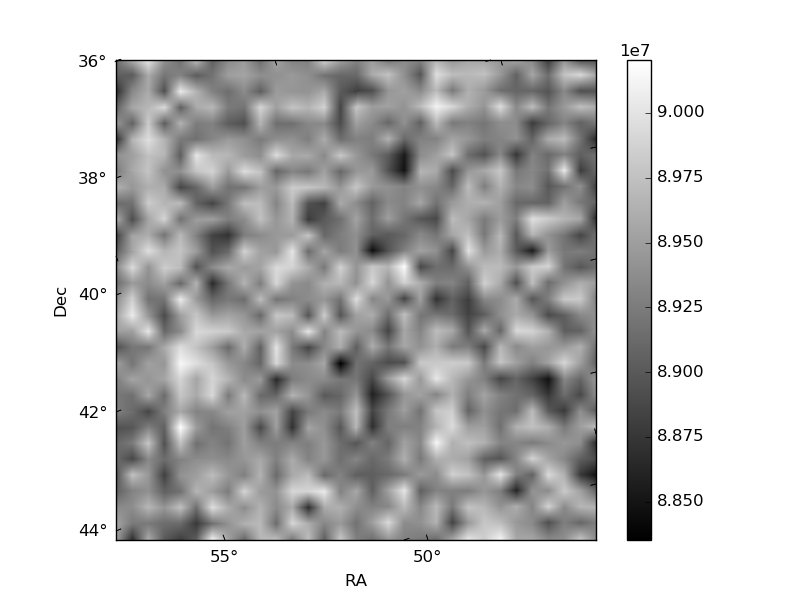
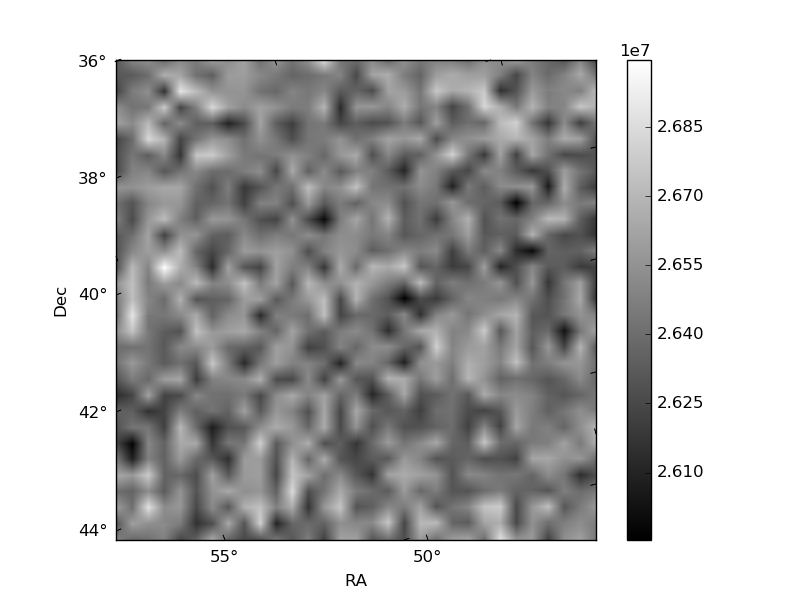
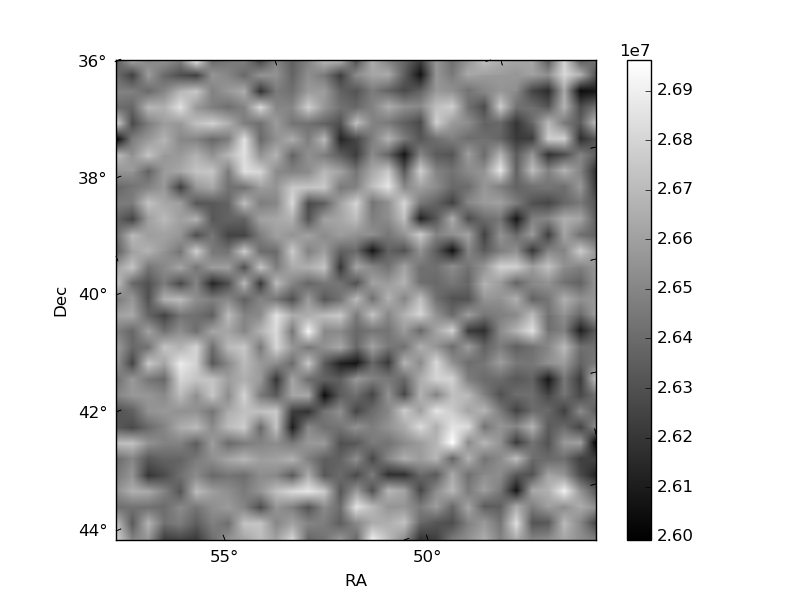
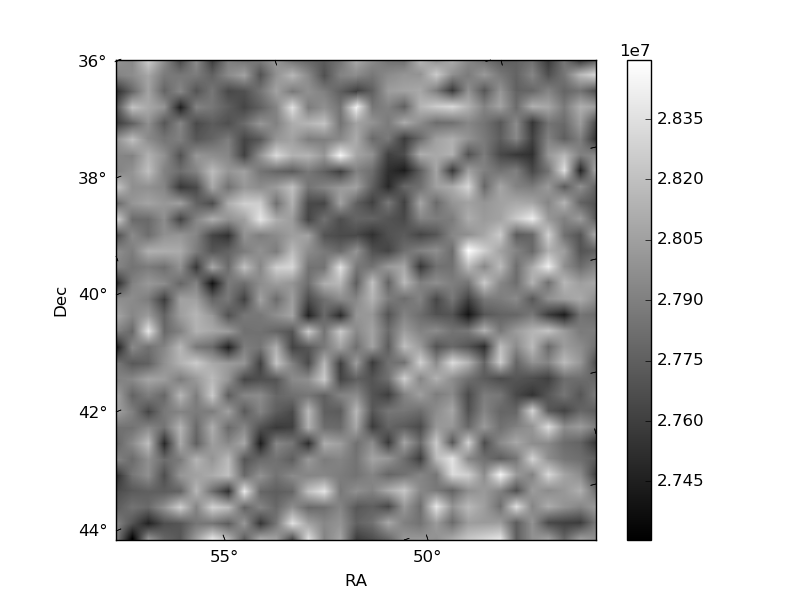
Histogram calculated using DETX and DETY for each event in the final _common_clean file
| Quadrant A |  |
 |
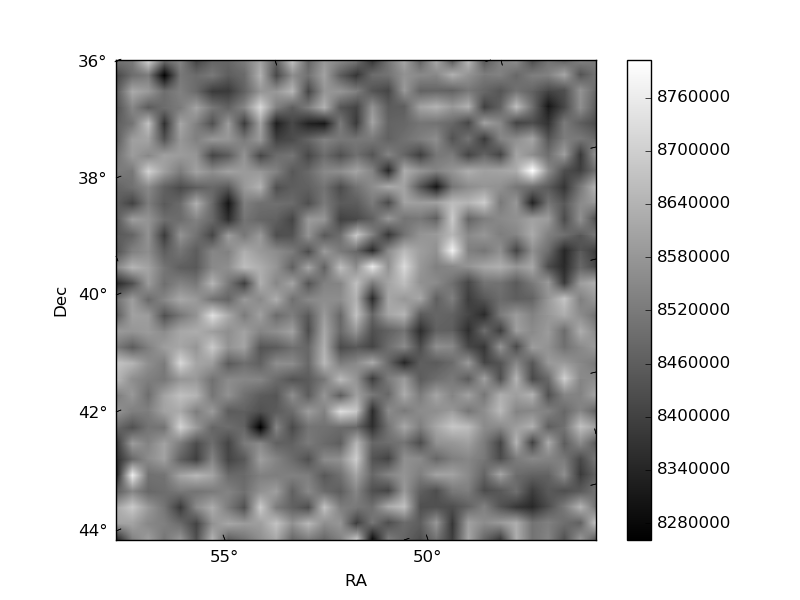
Quadrant B |
|---|---|---|---|
| Quadrant D | 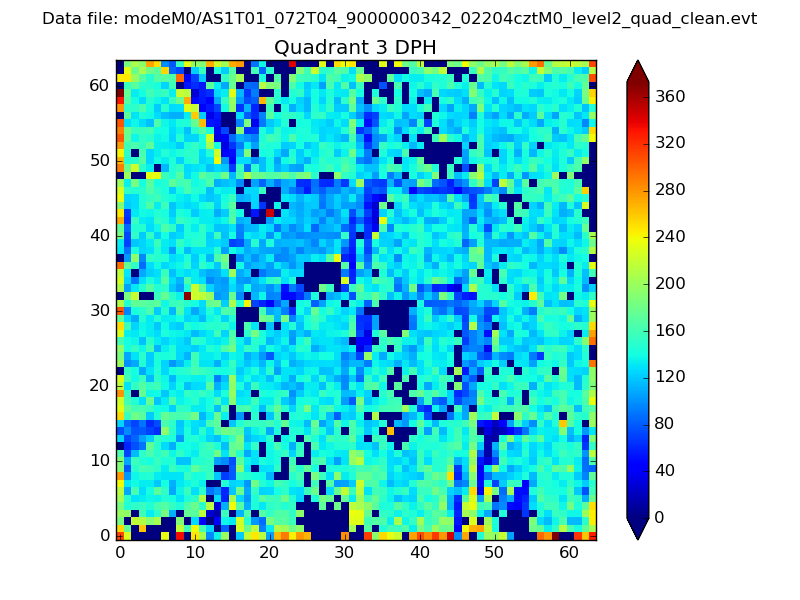 |
 |
Quadrant C |
| Plot type | Count rate plots | Images |
|---|---|---|
| Comparison with Poisson distribution Blue bars denote a histogram of data divided into 1 sec bins. Red curve is a Poisson curve with rate = median count rate of data. |
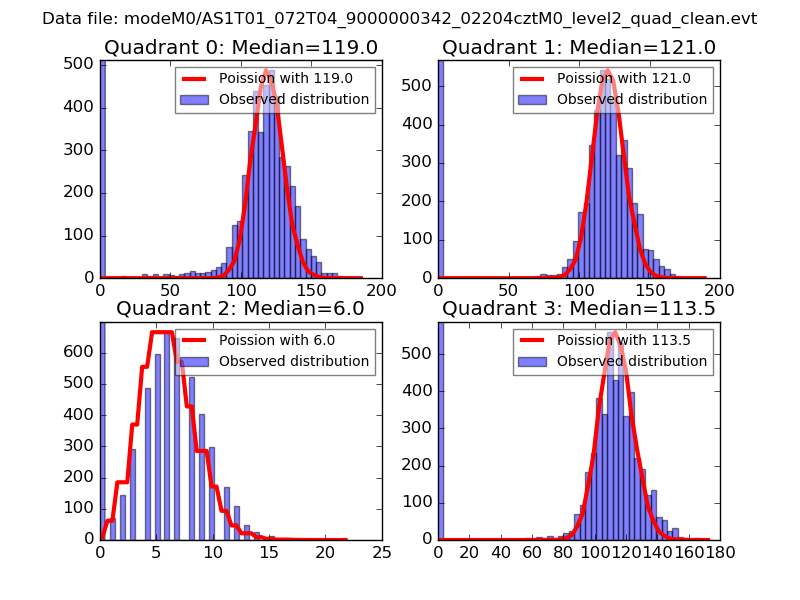 |
 |
| Quadrant-wise count rates Data is divided into 100 sec bins |
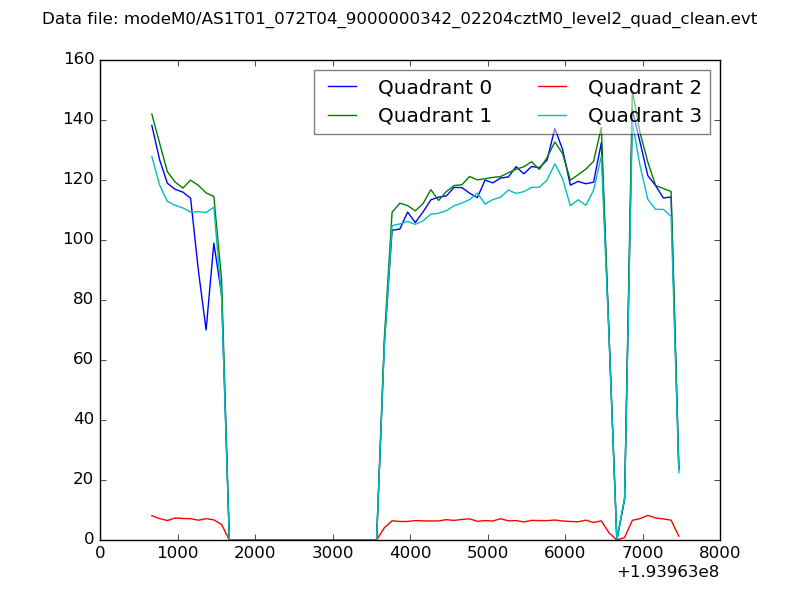 |
|
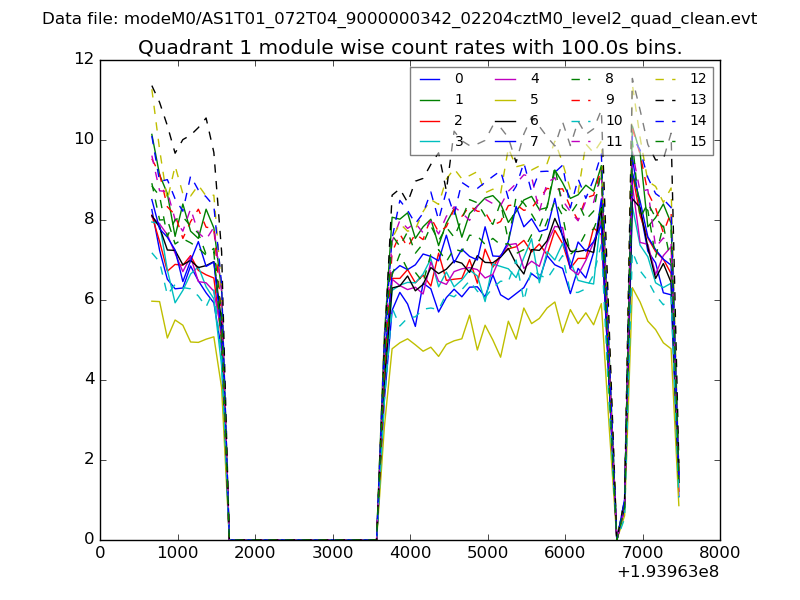
| Module-wise count rates for Quadrant A Data is divided into 100 sec bins |
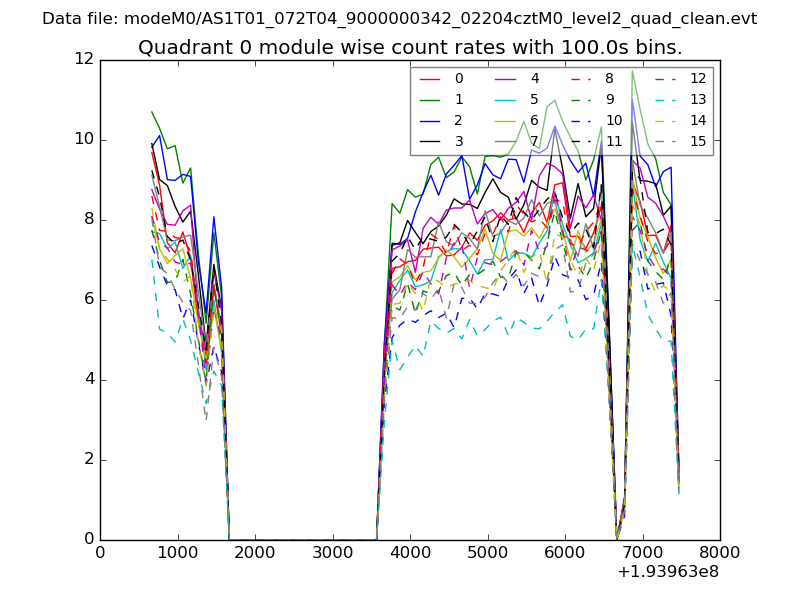 |
 |
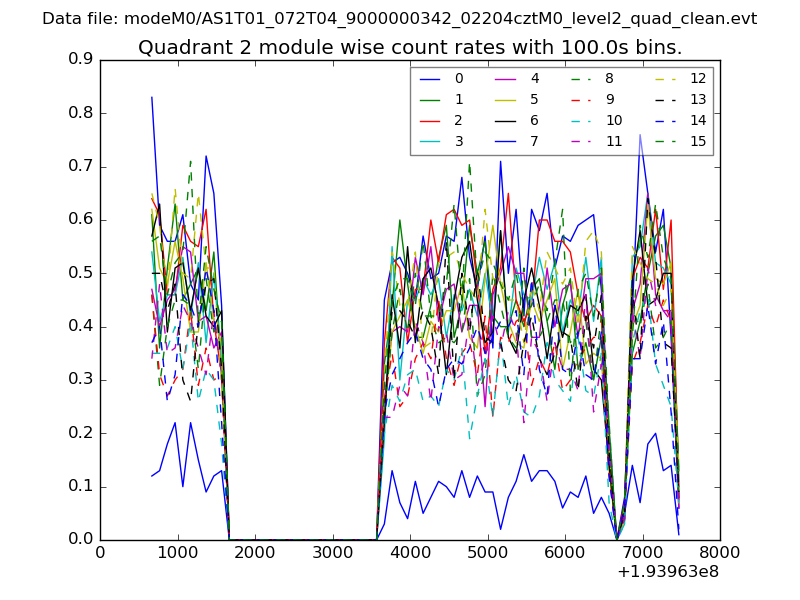
| Module-wise count rates for Quadrant B Data is divided into 100 sec bins |
 |
 |
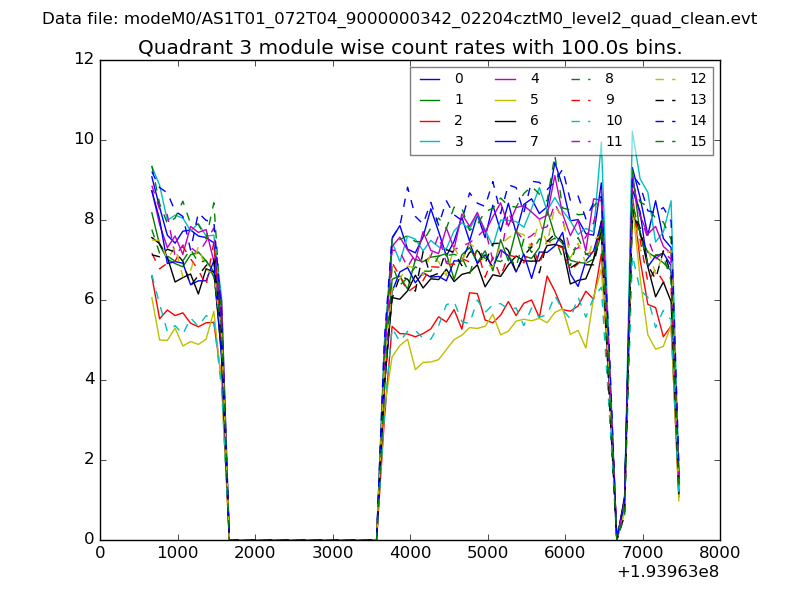
| Module-wise count rates for Quadrant C Data is divided into 100 sec bins |
 |
 |
| Module-wise count rates for Quadrant D Data is divided into 100 sec bins |
 |
 |
| Parameter | Plot |
|---|---|
| CZT HV Monitor | 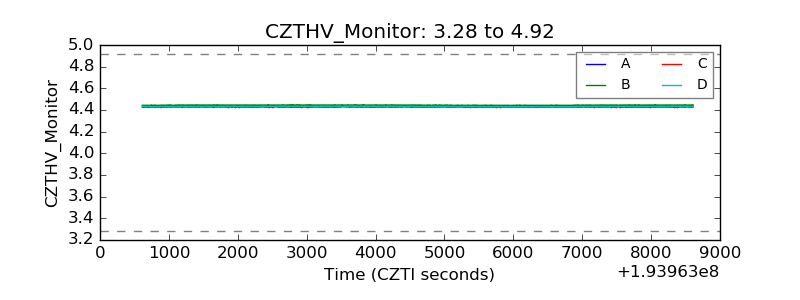 |
| D_VDD | 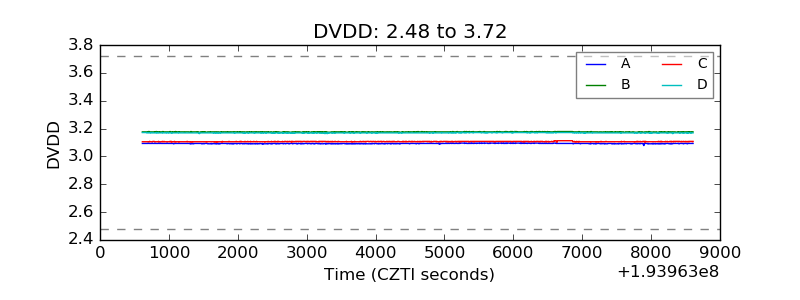 |
| Temperature 1 | 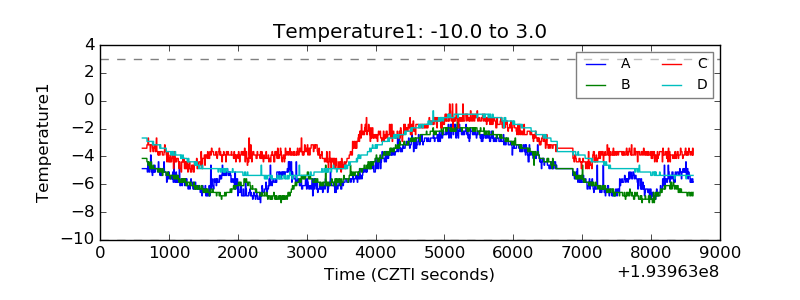 |
| Veto HV Monitor | 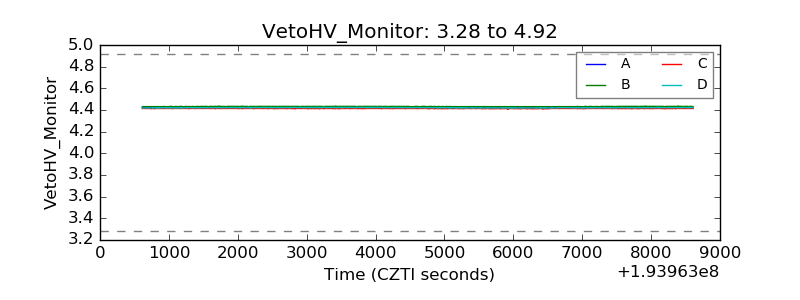 |
| Veto LLD | 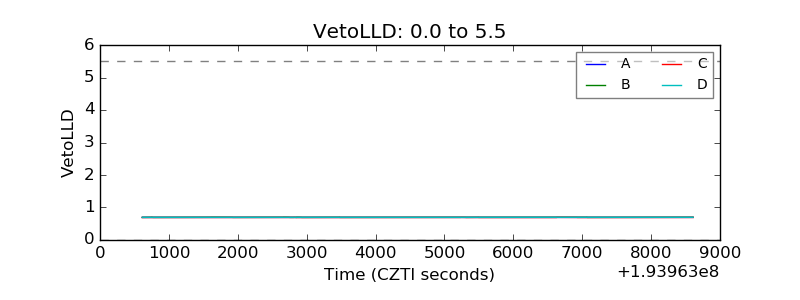 |
| Alpha Counter | 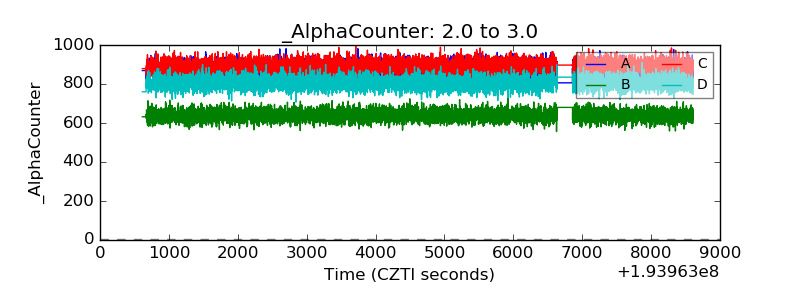 |
| _CPM_Rate | 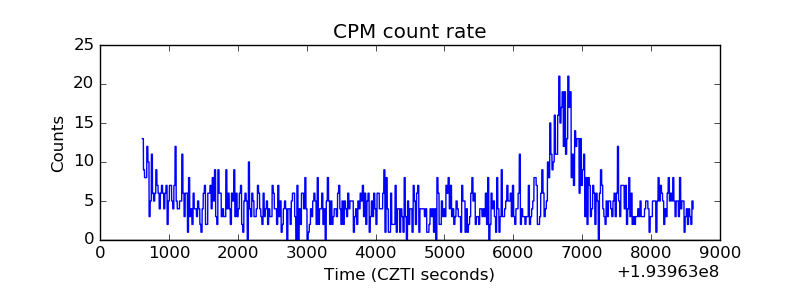 |
| CZT Counter | 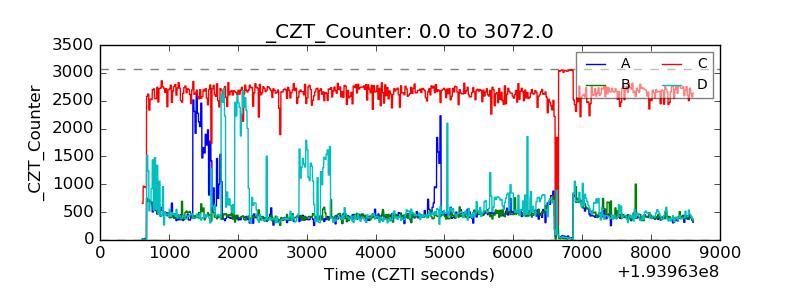 |
| +2.5 Volts monitor |  |
| +5 Volts monitor | 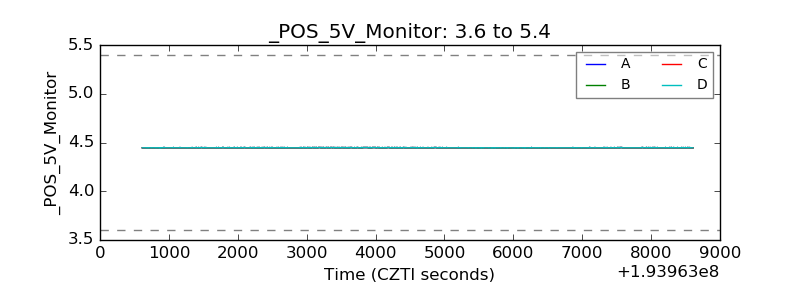 |
| _ROLL_ROT | 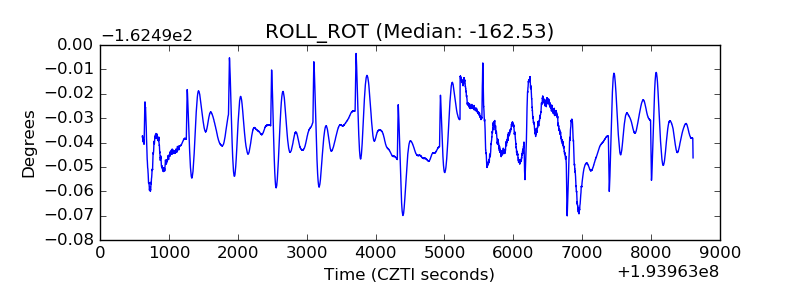 |
| _Roll_DEC | 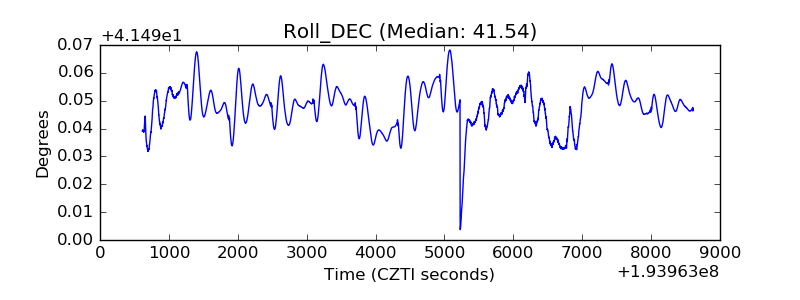 |
| _Roll_RA | 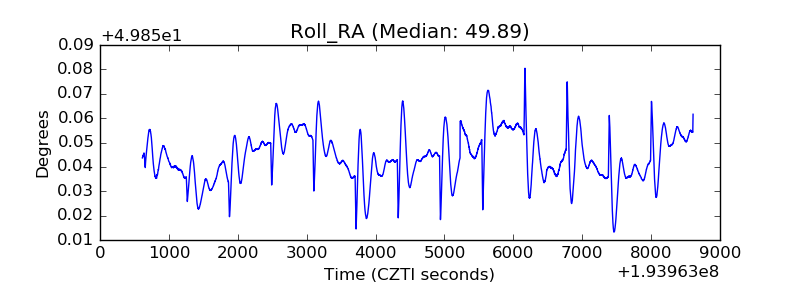 |
| Veto Counter | 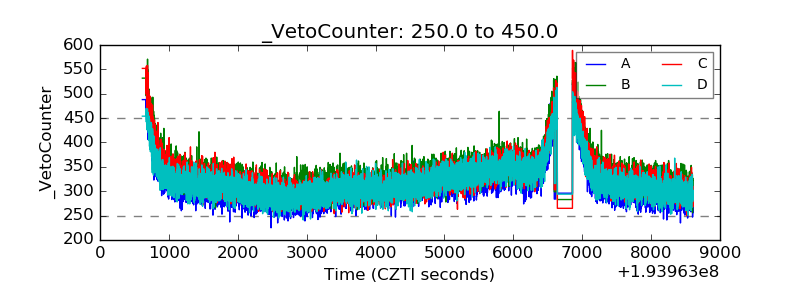 |