| Param | Original file | Final file |
|---|---|---|
| Filename | modeM0/AS1T01_072T04_9000000342_02205cztM0_level2.evt | modeM0/AS1T01_072T04_9000000342_02205cztM0_level2_quad_clean.evt |
| Size (bytes) | 1,001,180,160 | 67,651,200 |
| Size | 954.8 MB | 64.5 MB |
| Events in quadrant A | 3,787,953 | 496,927 |
| Events in quadrant B | 3,550,050 | 509,752 |
| Events in quadrant C | 18,910,530 | 26,142 |
| Events in quadrant D | 3,553,292 | 480,279 |
| Mode M0 | |||
|---|---|---|---|
| Quadrant | BADHDUFLAG | Total packets | Discarded packets |
| A | 0 | 16873 | 4 |
| B | 0 | 15973 | 3 |
| C | 0 | 61722 | 3 |
| D | 0 | 16302 | 3 |
| Mode SS | |||
|---|---|---|---|
| Quadrant | BADHDUFLAG | Total packets | Discarded packets |
| A | 0 | 156 | 0 |
| B | 0 | 156 | 0 |
| C | 0 | 156 | 0 |
| D | 0 | 156 | 0 |
| Mode M9 | |||
|---|---|---|---|
| Quadrant | BADHDUFLAG | Total packets | Discarded packets |
| A | 0 | 1 | 0 |
| B | 0 | 1 | 0 |
| C | 0 | 1 | 0 |
| D | 0 | 2 | 0 |
| Quadrant | Total seconds | Saturated seconds | Saturation percentage |
|---|---|---|---|
| A | 7659 | 166 | 2.167385% |
| B | 7659 | 175 | 2.284894% |
| C | 7659 | 7659 | 100.000000% |
| D | 7659 | 106 | 1.383993% |
Noise dominated data is calculated using 1-second bins in cleaned event files. If a bin has >2000 counts, and if more than 50% of those come from <1% of pixels, then it is considered to be noise-dominated and hence unusable.
| Quadrant | # 1 sec bins | Bins with >0 counts | Bins with >2000 counts | High rate bins dominated by noise | Noise dominated (total time) | Noise dominated (detector-on time) | Marked lightcurve |
|---|---|---|---|---|---|---|---|
| A | 7849 | 7661 | 5 | 5 | 0.06% | 0.07% | 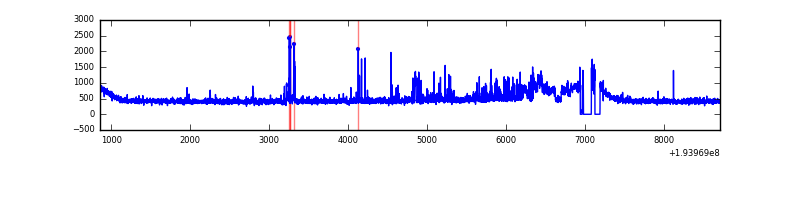 |
| B | 7848 | 7661 | 2 | 2 | 0.03% | 0.03% | 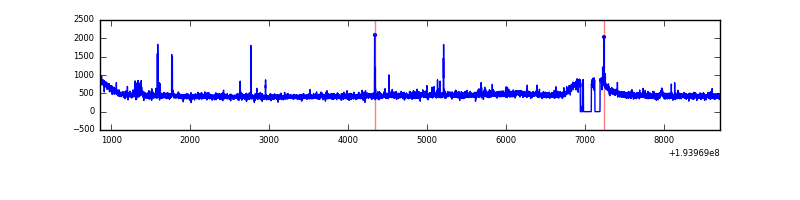 |
| C | 7849 | 7662 | 6358 | 6358 | 81.00% | 82.98% | 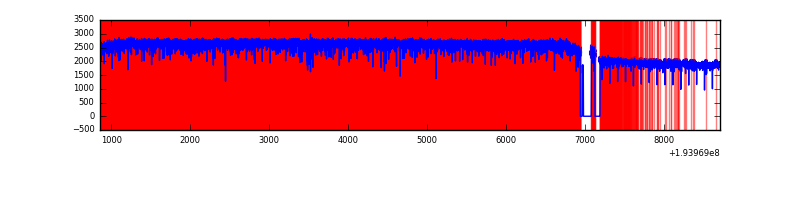 |
| D | 7848 | 7661 | 20 | 20 | 0.25% | 0.26% | 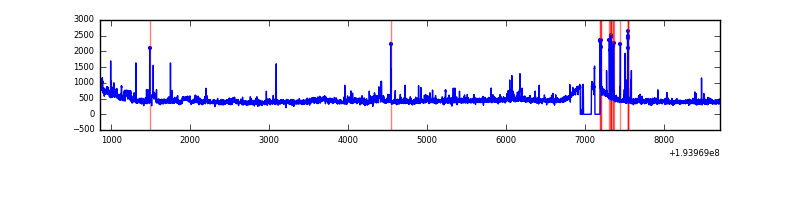 |
Top three noisy pixels from each quadrant. If the there are fewer than three noisy pixels in the level2.evt file, extra rows are filled as -1
| Pixel properties | Quadrant properties | ||||||
|---|---|---|---|---|---|---|---|
| Quadrant | DetID | PixID | Counts | Sigma | Mean | Median | Sigma |
| A | 15 | 171 | 380384 | 2099.48 | 876 | 854 | 180.8 |
| A | 10 | 2 | 25535 | 136.53 | 876 | 854 | 180.8 |
| A | 12 | 194 | 9868 | 49.86 | 876 | 854 | 180.8 |
| B | 15 | 85 | 33945 | 189.86 | 897 | 871 | 174.2 |
| B | 6 | 219 | 20800 | 114.4 | 897 | 871 | 174.2 |
| B | 3 | 0 | 18615 | 101.86 | 897 | 871 | 174.2 |
| C | 7 | 111 | 5770905 | 70038.79 | 106 | 94 | 82.4 |
| C | 0 | 187 | 2486106 | 30172.06 | 106 | 94 | 82.4 |
| C | 7 | 247 | 1298682 | 15760.61 | 106 | 94 | 82.4 |
| D | 7 | 223 | 240264 | 1174.91 | 851 | 826 | 203.8 |
| D | 10 | 149 | 37387 | 179.4 | 851 | 826 | 203.8 |
| D | 15 | 194 | 15981 | 74.36 | 851 | 826 | 203.8 |
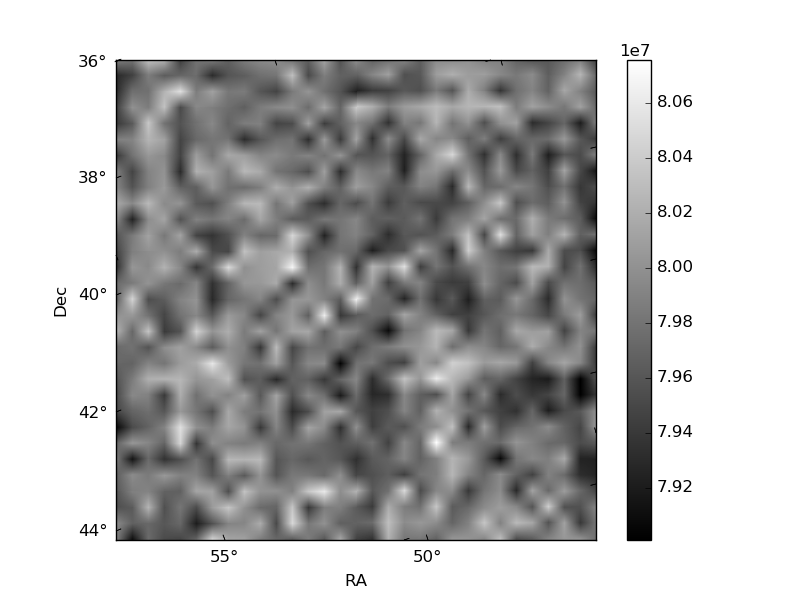
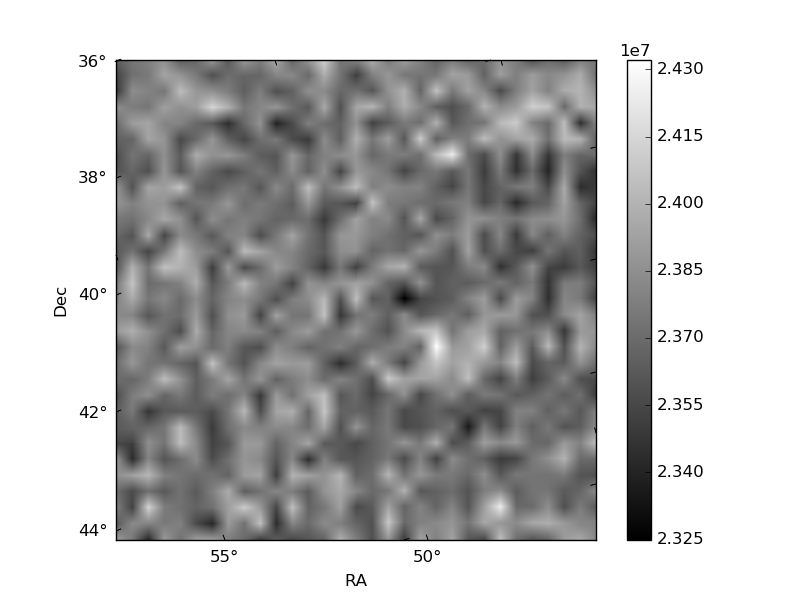
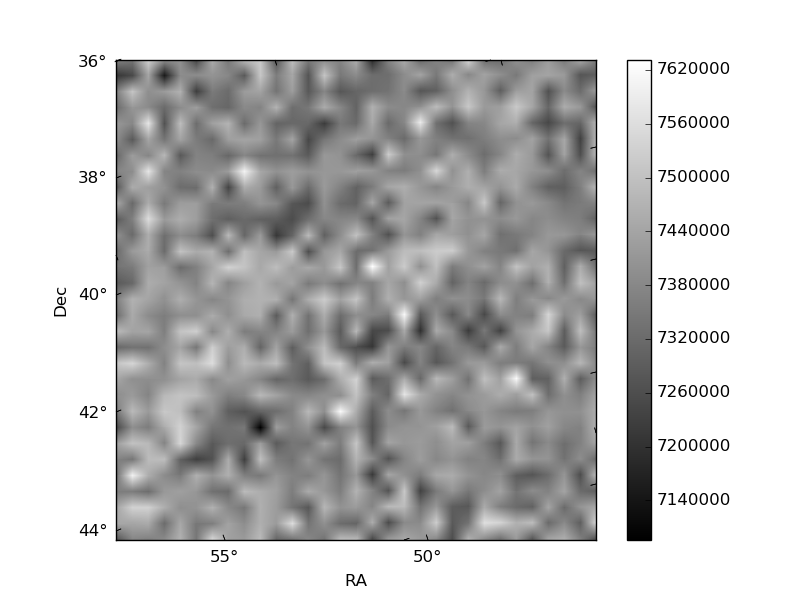
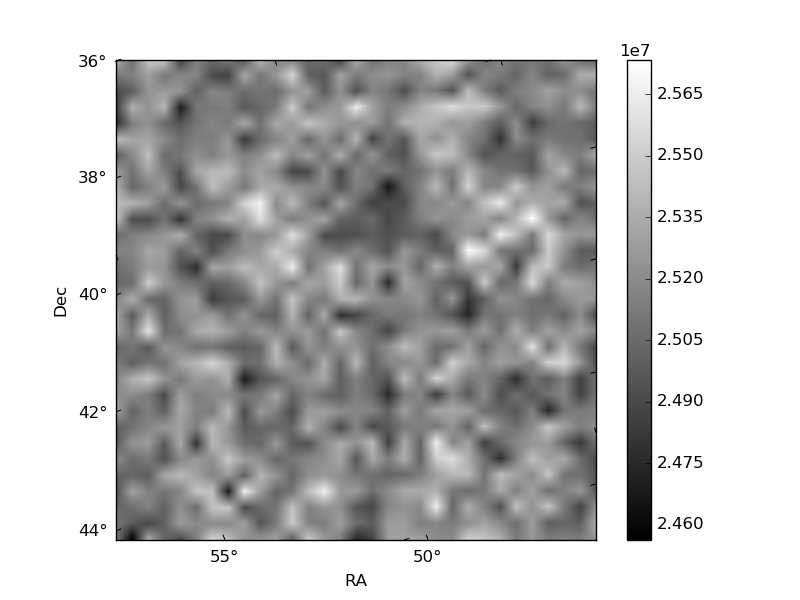
Histogram calculated using DETX and DETY for each event in the final _common_clean file
| Quadrant A | 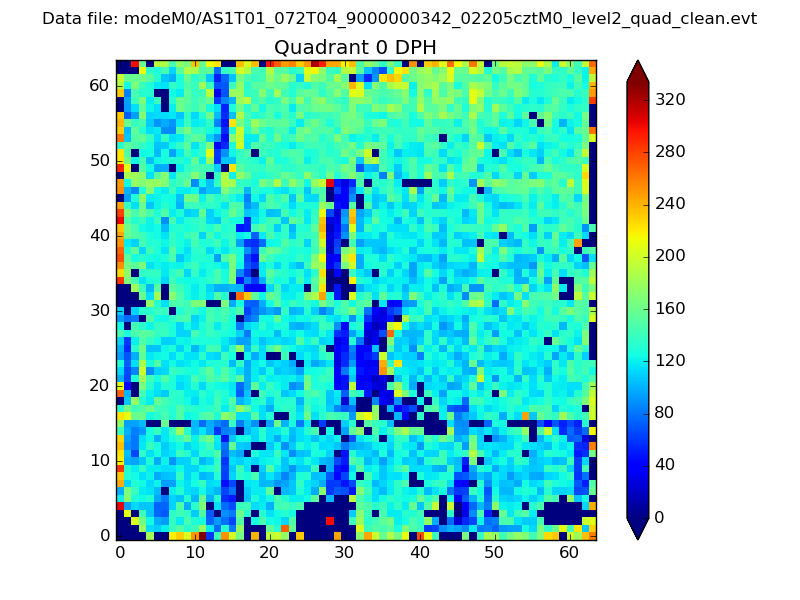 |
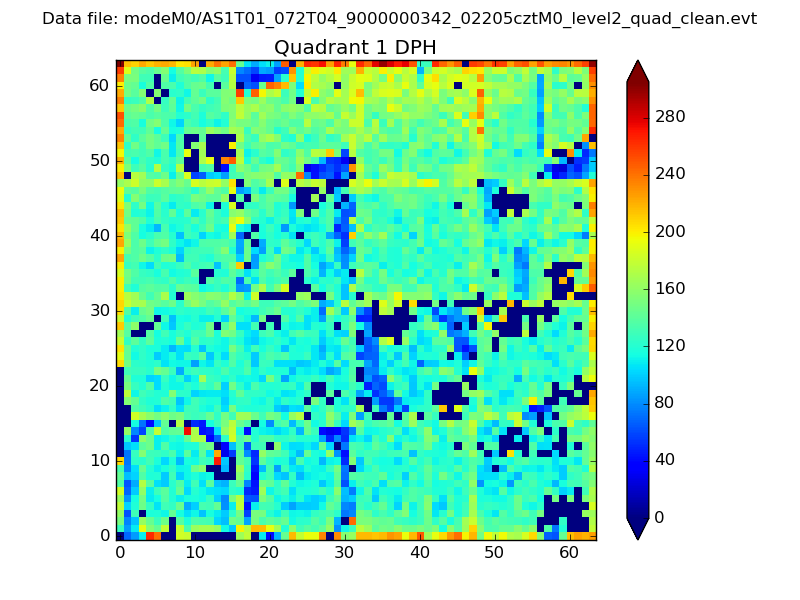 |
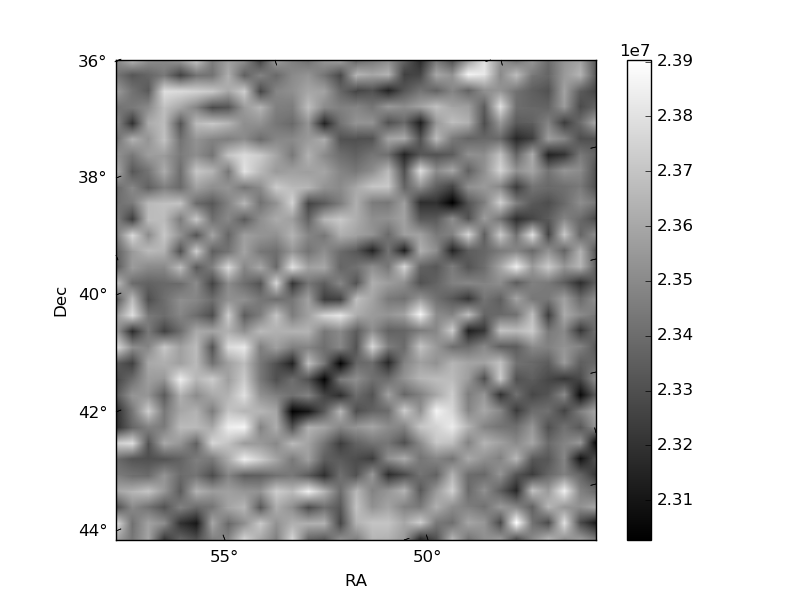
Quadrant B |
|---|---|---|---|
| Quadrant D | 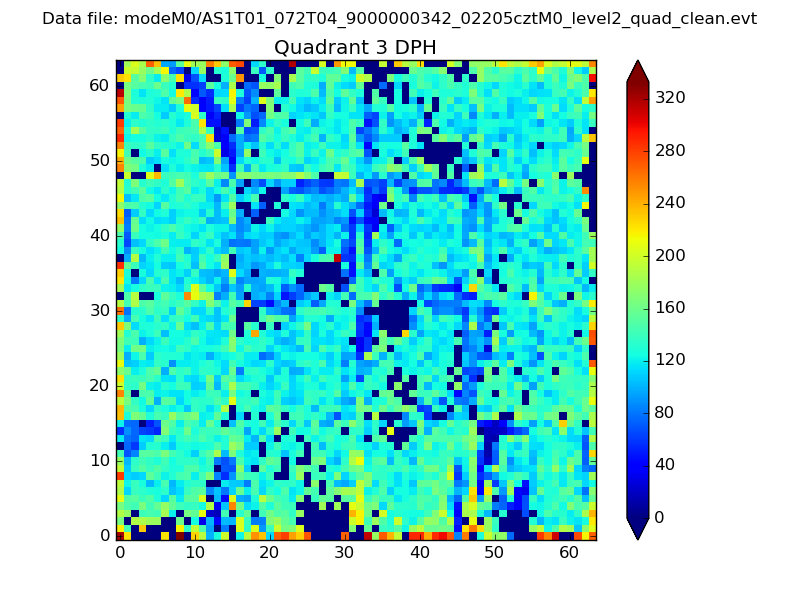 |
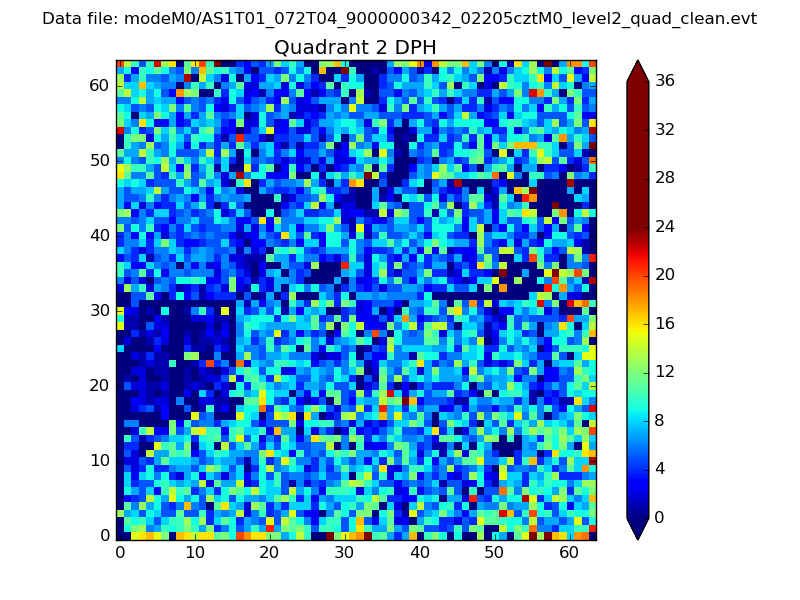 |
Quadrant C |
| Plot type | Count rate plots | Images |
|---|---|---|
| Comparison with Poisson distribution Blue bars denote a histogram of data divided into 1 sec bins. Red curve is a Poisson curve with rate = median count rate of data. |
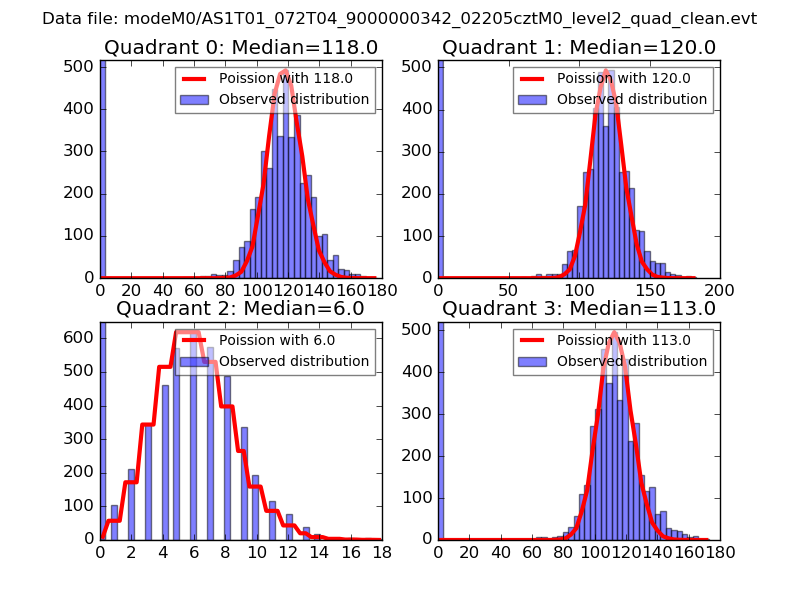 |
 |
| Quadrant-wise count rates Data is divided into 100 sec bins |
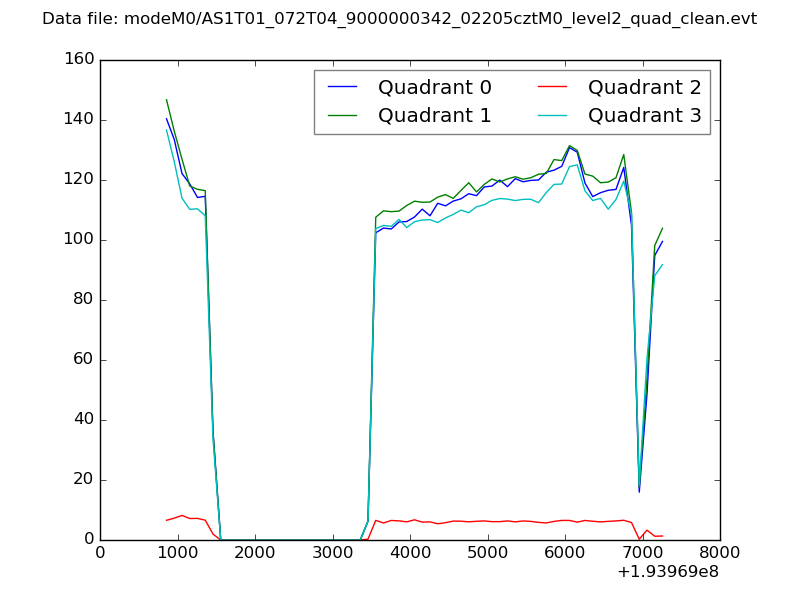 |
|
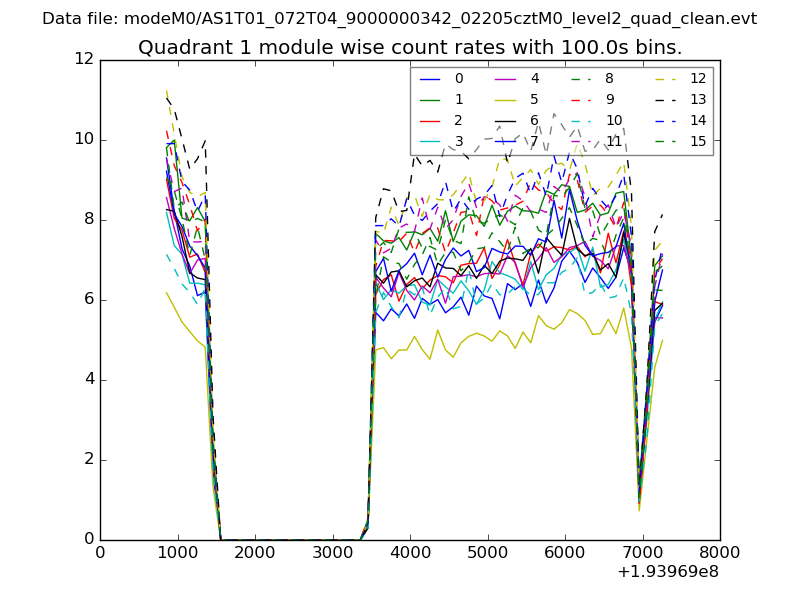
| Module-wise count rates for Quadrant A Data is divided into 100 sec bins |
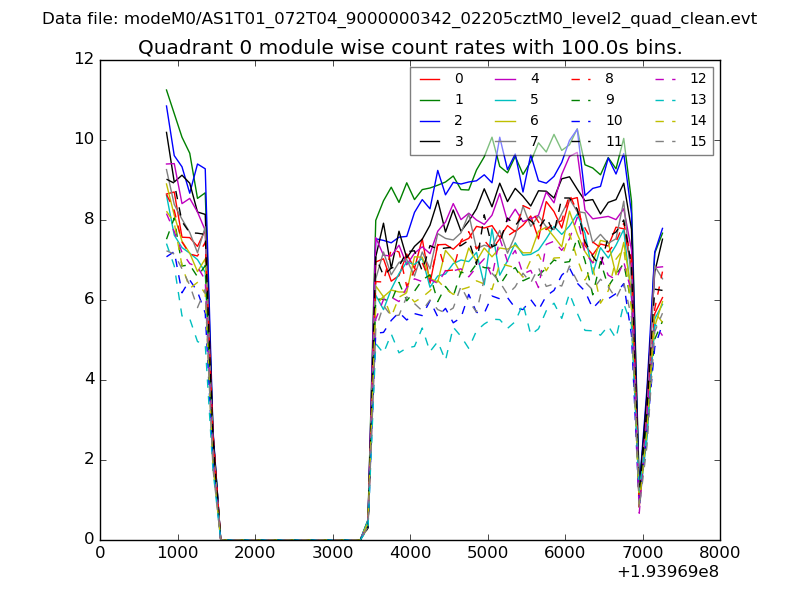 |
 |
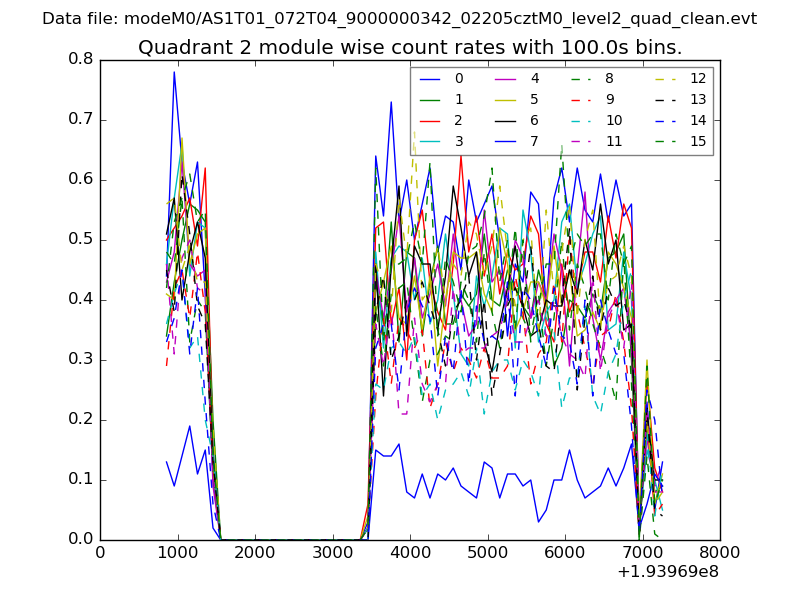
| Module-wise count rates for Quadrant B Data is divided into 100 sec bins |
 |
 |
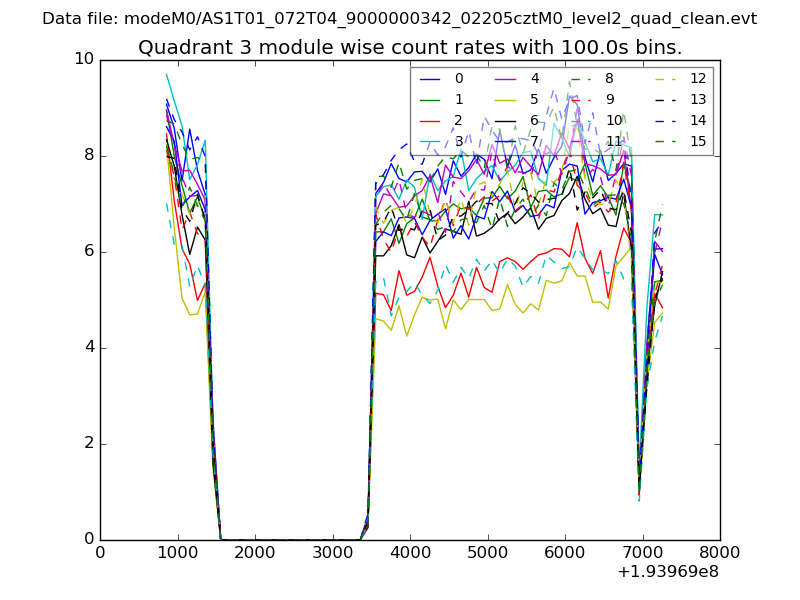
| Module-wise count rates for Quadrant C Data is divided into 100 sec bins |
 |
 |
| Module-wise count rates for Quadrant D Data is divided into 100 sec bins |
 |
 |
| Parameter | Plot |
|---|---|
| CZT HV Monitor | 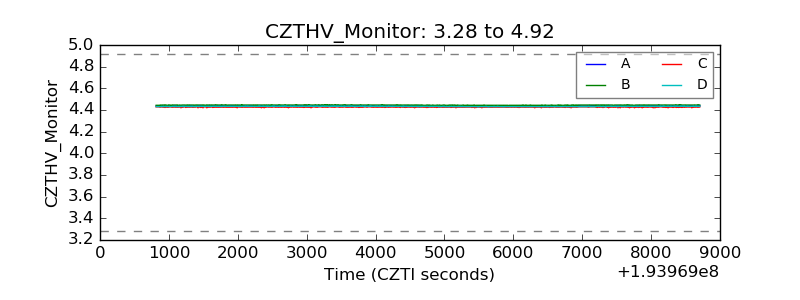 |
| D_VDD | 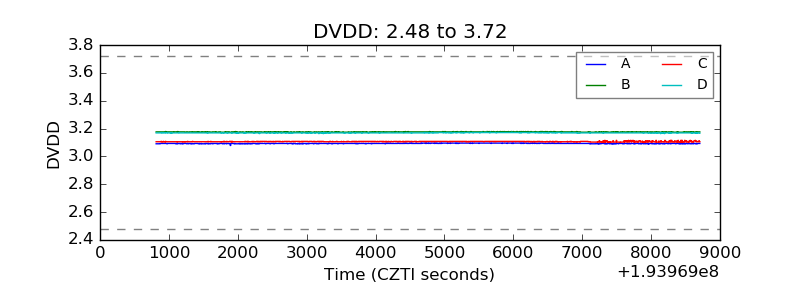 |
| Temperature 1 | 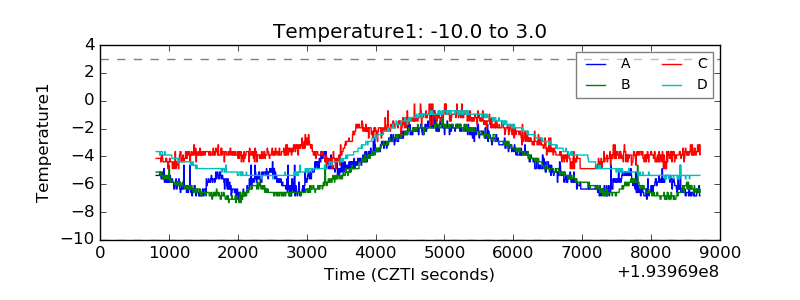 |
| Veto HV Monitor | 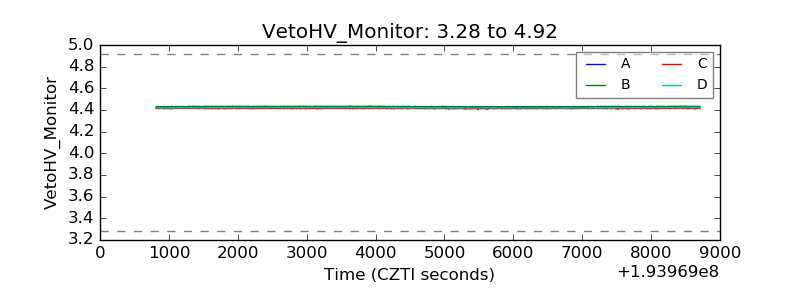 |
| Veto LLD | 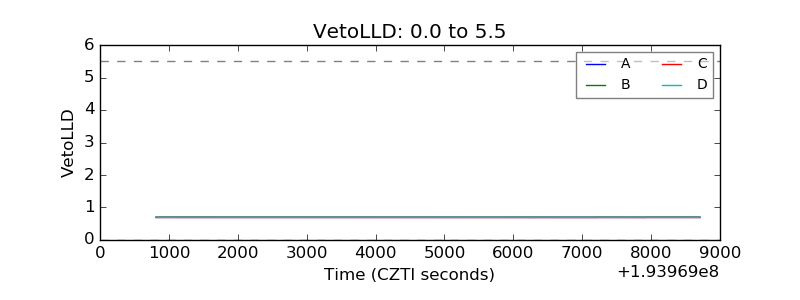 |
| Alpha Counter | 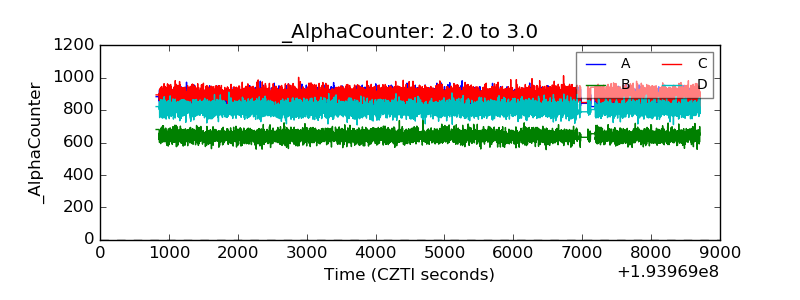 |
| _CPM_Rate | 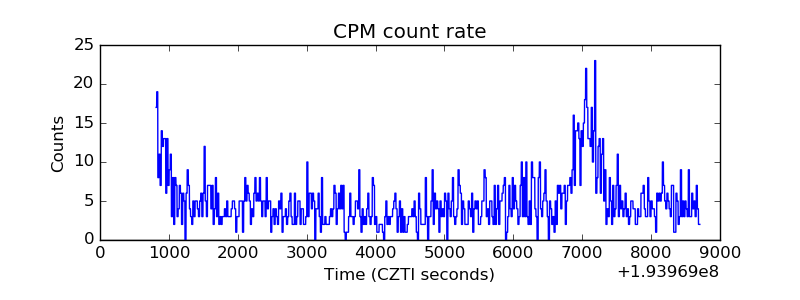 |
| CZT Counter | 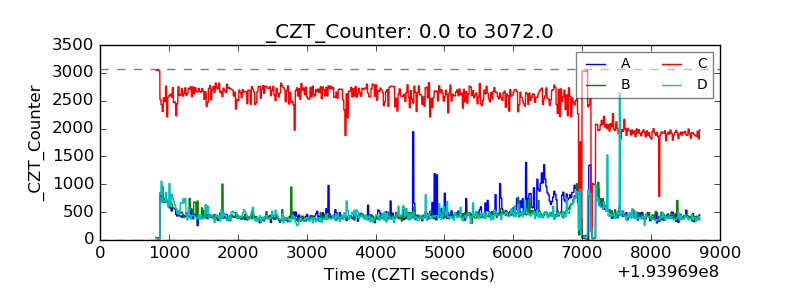 |
| +2.5 Volts monitor |  |
| +5 Volts monitor | 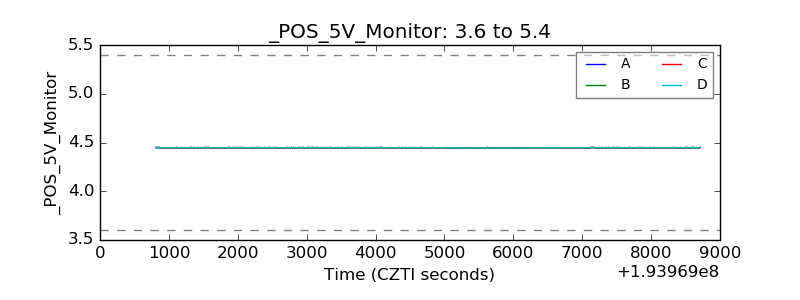 |
| _ROLL_ROT | 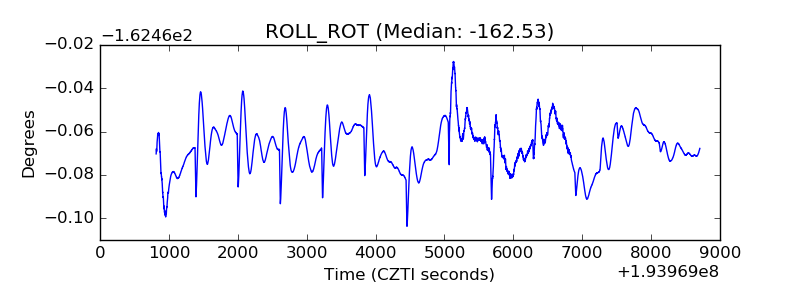 |
| _Roll_DEC | 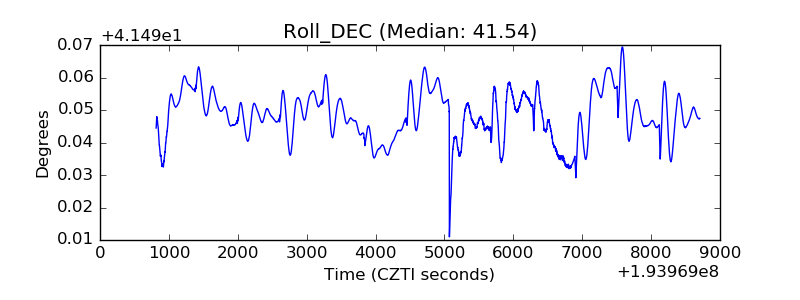 |
| _Roll_RA | 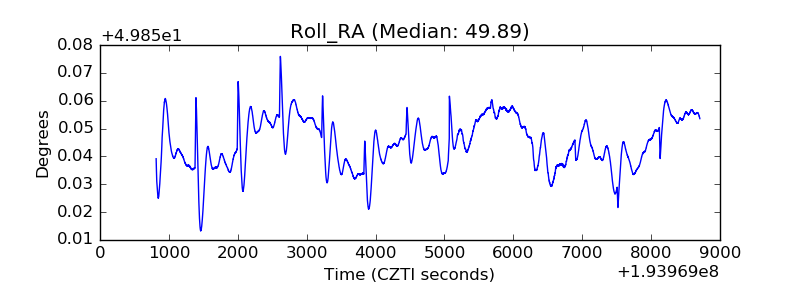 |
| Veto Counter | 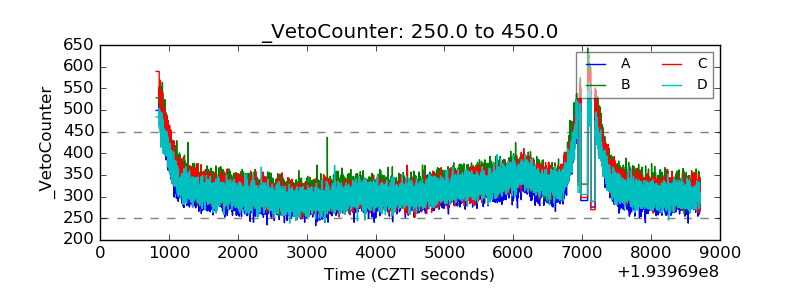 |