| Param | Original file | Final file |
|---|---|---|
| Filename | modeM0/AS1T01_072T04_9000000342_02206cztM0_level2.evt | modeM0/AS1T01_072T04_9000000342_02206cztM0_level2_quad_clean.evt |
| Size (bytes) | 837,201,600 | 61,747,200 |
| Size | 798.4 MB | 58.9 MB |
| Events in quadrant A | 3,284,639 | 450,939 |
| Events in quadrant B | 3,398,215 | 459,922 |
| Events in quadrant C | 14,959,596 | 4,607 |
| Events in quadrant D | 3,208,360 | 436,710 |
| Mode M0 | |||
|---|---|---|---|
| Quadrant | BADHDUFLAG | Total packets | Discarded packets |
| A | 0 | 15157 | 3 |
| B | 0 | 15257 | 3 |
| C | 0 | 48854 | 16 |
| D | 0 | 15335 | 3 |
| Mode SS | |||
|---|---|---|---|
| Quadrant | BADHDUFLAG | Total packets | Discarded packets |
| A | 0 | 150 | 0 |
| B | 0 | 150 | 0 |
| C | 0 | 150 | 0 |
| D | 0 | 150 | 0 |
| Mode M9 | |||
|---|---|---|---|
| Quadrant | BADHDUFLAG | Total packets | Discarded packets |
| A | 0 | 1 | 0 |
| B | 1 | 1 | 0 |
| C | 1 | -1 | -1 |
| D | 1 | -1 | -1 |
| Quadrant | Total seconds | Saturated seconds | Saturation percentage |
|---|---|---|---|
| A | 7398 | 109 | 1.473371% |
| B | 7398 | 117 | 1.581509% |
| C | 7396 | 7396 | 100.000000% |
| D | 7398 | 80 | 1.081373% |
Noise dominated data is calculated using 1-second bins in cleaned event files. If a bin has >2000 counts, and if more than 50% of those come from <1% of pixels, then it is considered to be noise-dominated and hence unusable.
| Quadrant | # 1 sec bins | Bins with >0 counts | Bins with >2000 counts | High rate bins dominated by noise | Noise dominated (total time) | Noise dominated (detector-on time) | Marked lightcurve |
|---|---|---|---|---|---|---|---|
| A | 7888 | 7400 | 0 | 0 | 0.00% | 0.00% | 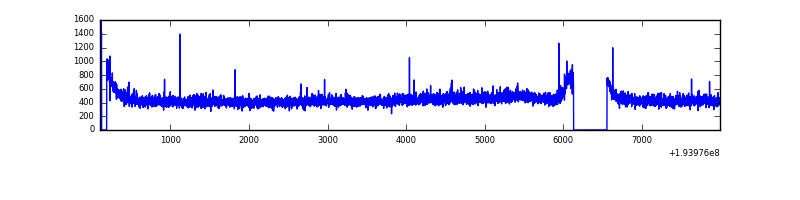 |
| B | 7888 | 7400 | 1 | 1 | 0.01% | 0.01% | 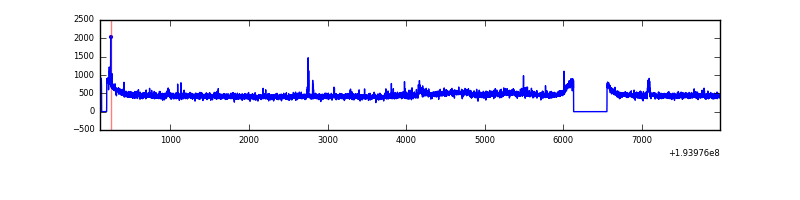 |
| C | 7888 | 7399 | 1845 | 1845 | 23.39% | 24.94% | 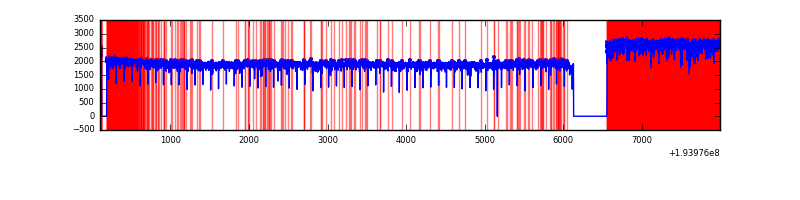 |
| D | 7888 | 7400 | 21 | 21 | 0.27% | 0.28% | 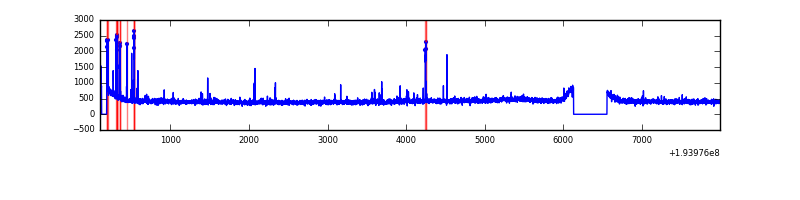 |
Top three noisy pixels from each quadrant. If the there are fewer than three noisy pixels in the level2.evt file, extra rows are filled as -1
| Pixel properties | Quadrant properties | ||||||
|---|---|---|---|---|---|---|---|
| Quadrant | DetID | PixID | Counts | Sigma | Mean | Median | Sigma |
| A | 10 | 2 | 32448 | 183.44 | 837 | 816 | 172.4 |
| A | 15 | 171 | 16934 | 93.47 | 837 | 816 | 172.4 |
| A | 12 | 194 | 9526 | 50.51 | 837 | 816 | 172.4 |
| B | 4 | 158 | 44063 | 258.24 | 857 | 835 | 167.4 |
| B | 6 | 219 | 15959 | 90.35 | 857 | 835 | 167.4 |
| B | 12 | 111 | 11373 | 62.95 | 857 | 835 | 167.4 |
| C | 7 | 111 | 3346308 | 89724.96 | 54 | 49 | 37.3 |
| C | 8 | 112 | 2164782 | 58044.09 | 54 | 49 | 37.3 |
| C | 8 | 128 | 1714896 | 45981.07 | 54 | 49 | 37.3 |
| D | 7 | 223 | 63472 | 323.61 | 808 | 784 | 193.7 |
| D | 9 | 64 | 30784 | 154.87 | 808 | 784 | 193.7 |
| D | 10 | 149 | 30777 | 154.83 | 808 | 784 | 193.7 |
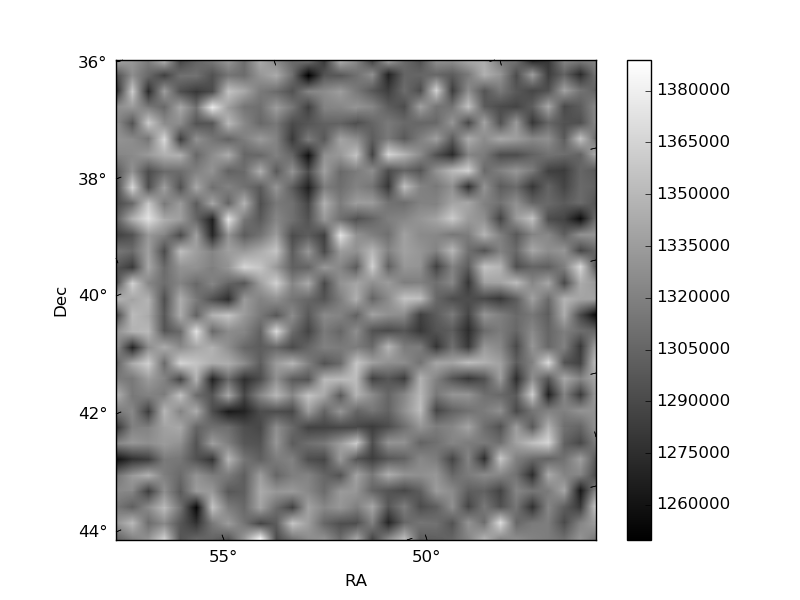
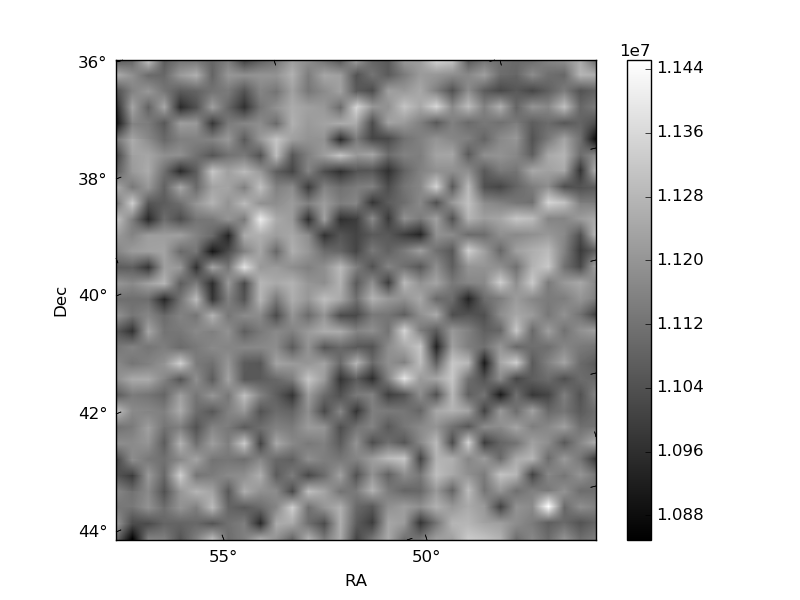
Histogram calculated using DETX and DETY for each event in the final _common_clean file
| Quadrant A | 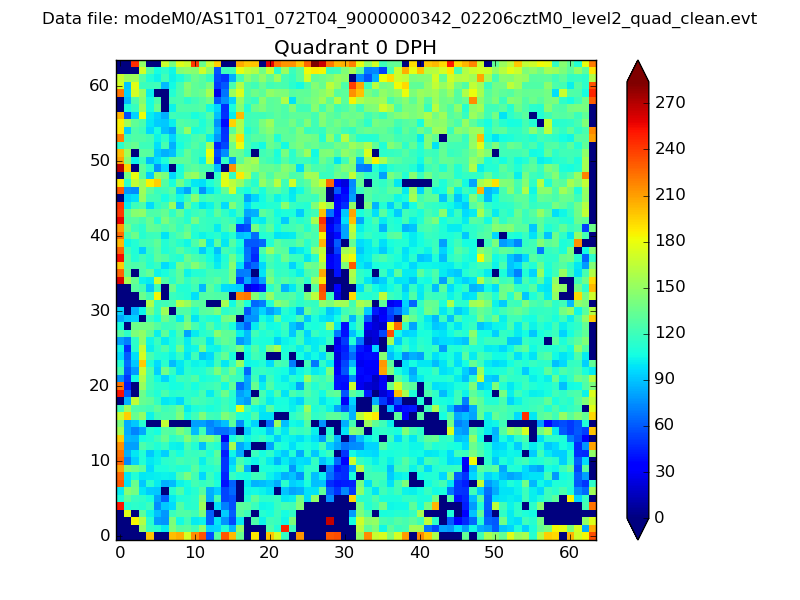 |
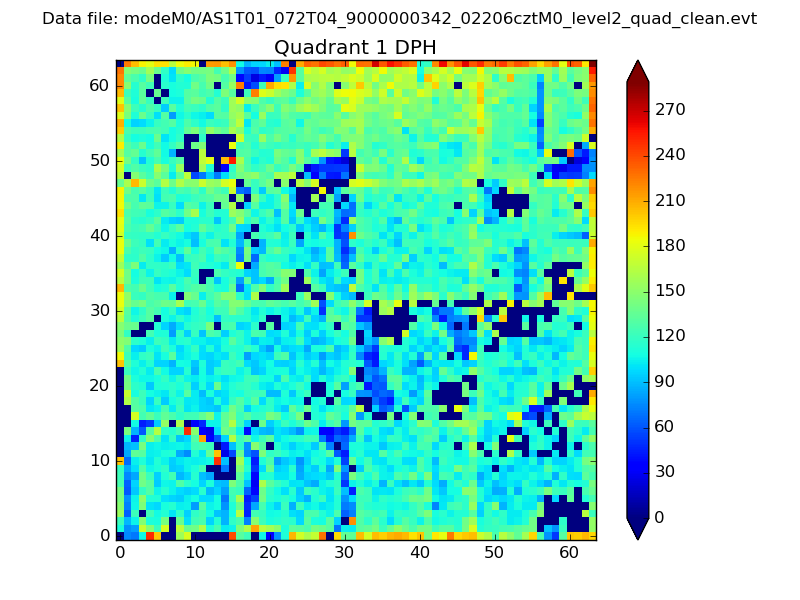 |
Quadrant B |
|---|---|---|---|
| Quadrant D | 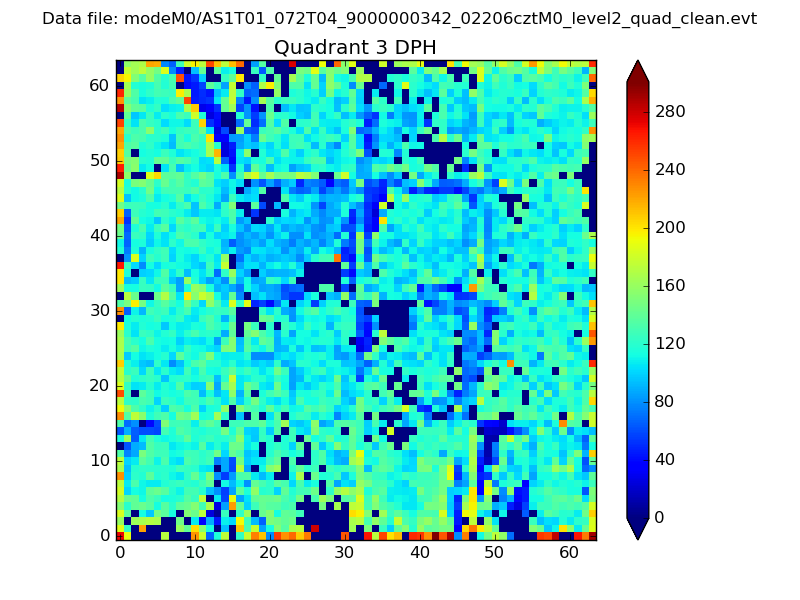 |
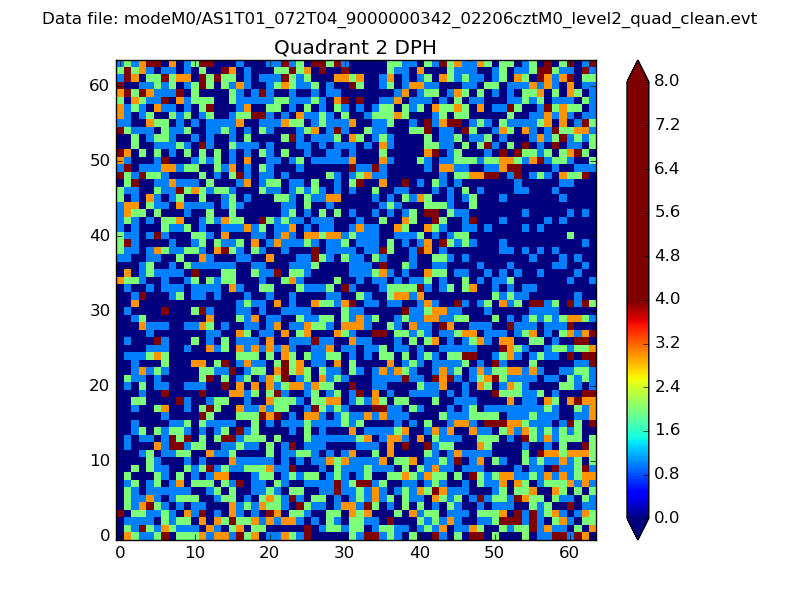 |
Quadrant C |
| Plot type | Count rate plots | Images |
|---|---|---|
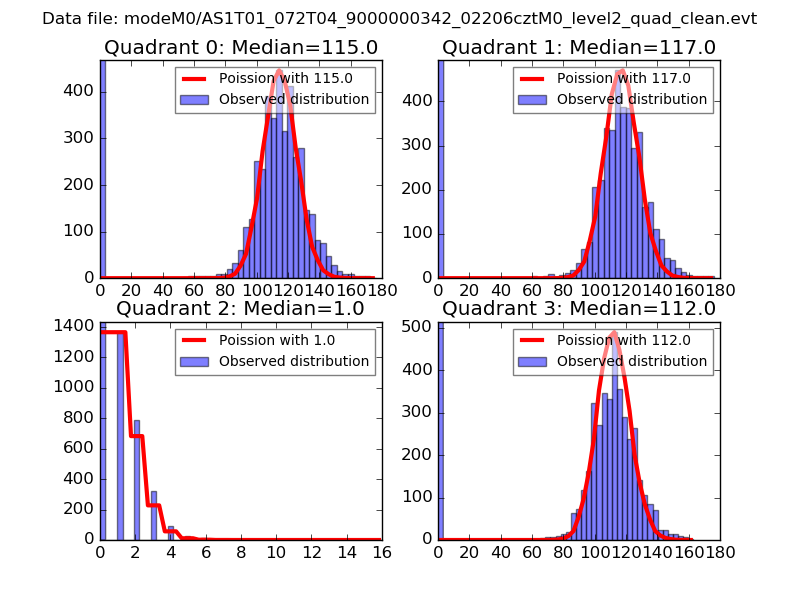
| Comparison with Poisson distribution Blue bars denote a histogram of data divided into 1 sec bins. Red curve is a Poisson curve with rate = median count rate of data. |
 |
 |
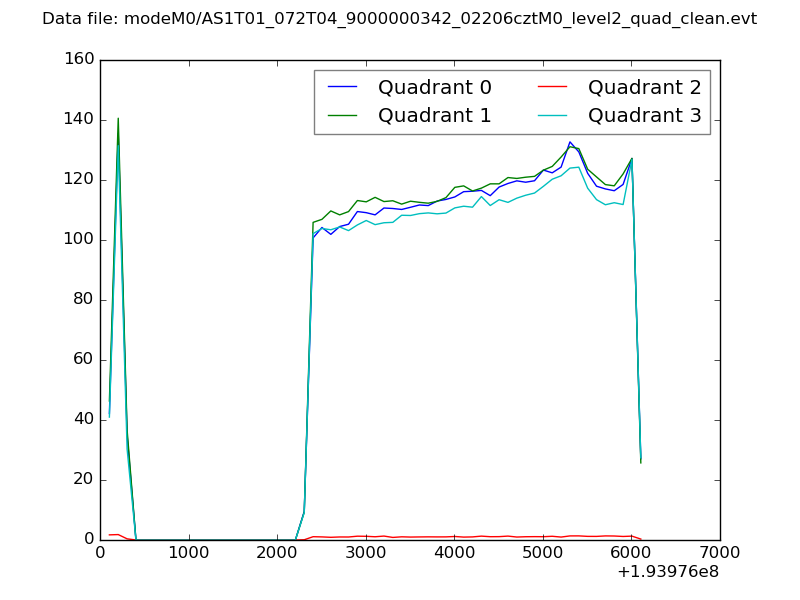
| Quadrant-wise count rates Data is divided into 100 sec bins |
 |
|
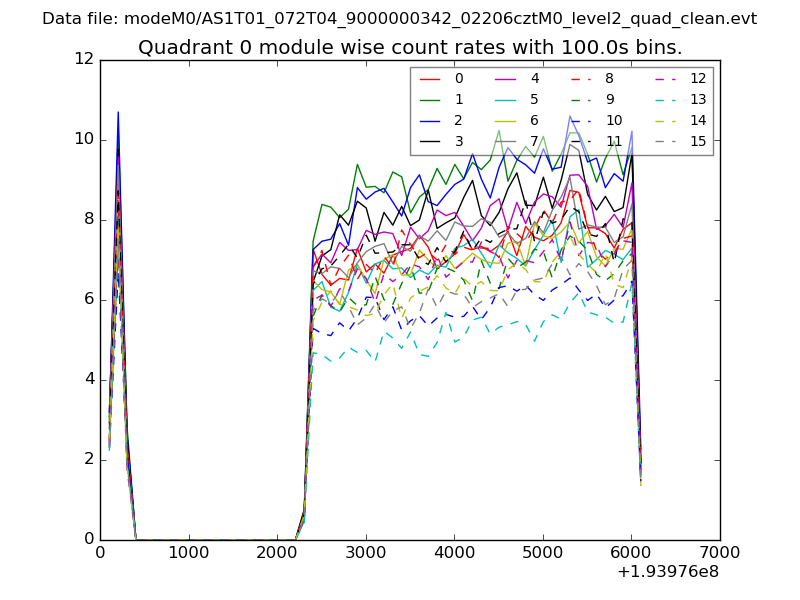
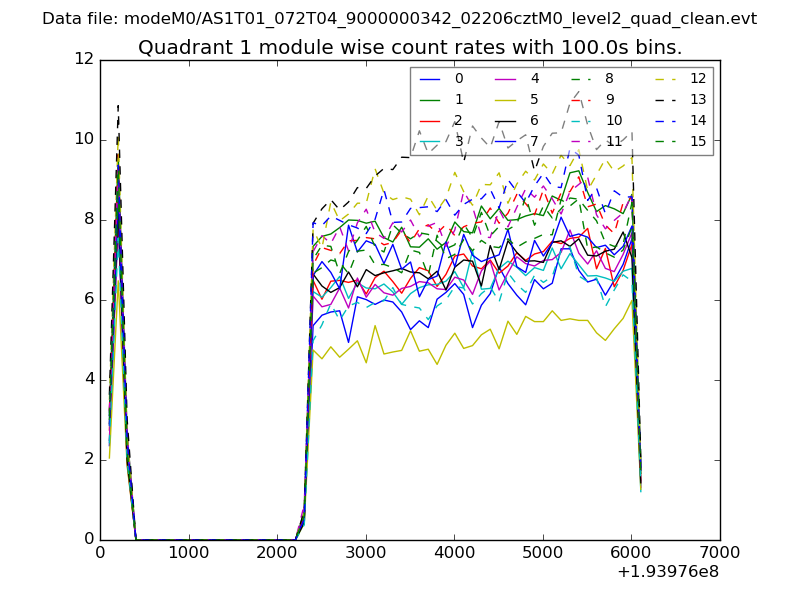
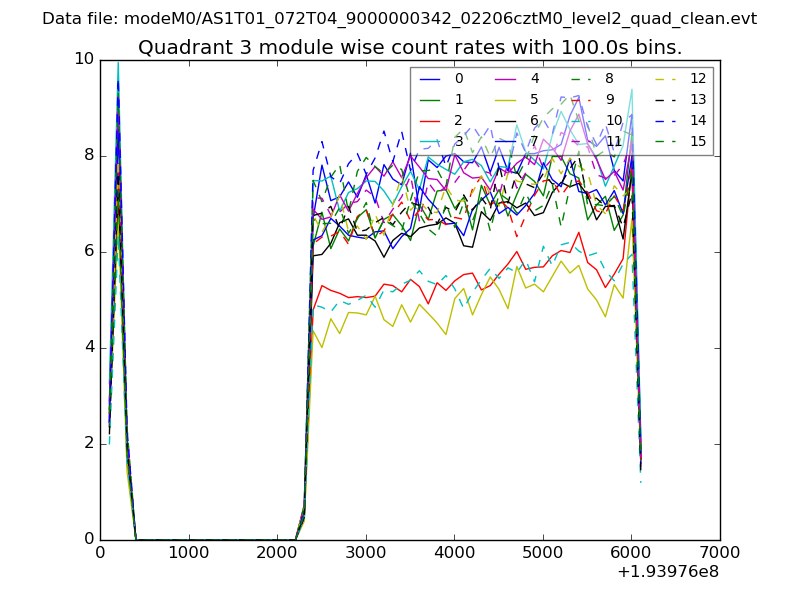
| Module-wise count rates for Quadrant A Data is divided into 100 sec bins |
 |
 |
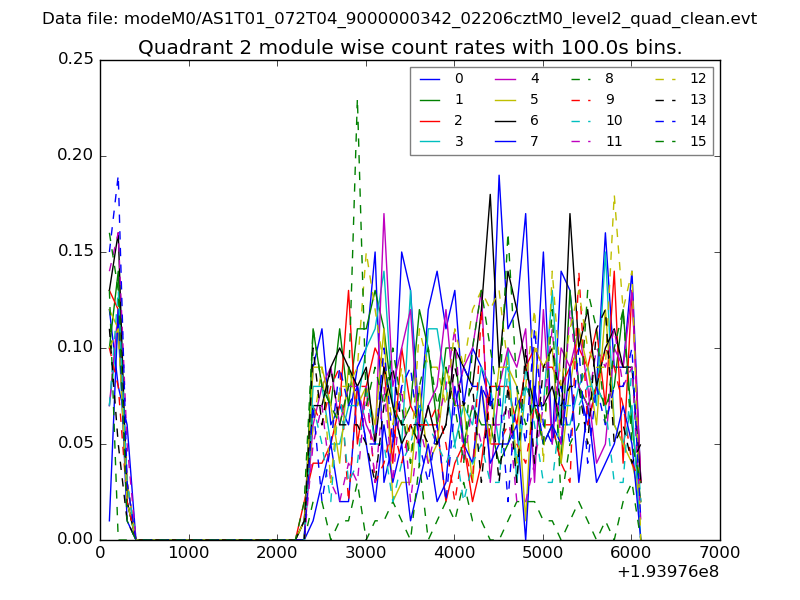
| Module-wise count rates for Quadrant B Data is divided into 100 sec bins |
 |
 |
| Module-wise count rates for Quadrant C Data is divided into 100 sec bins |
 |
 |
| Module-wise count rates for Quadrant D Data is divided into 100 sec bins |
 |
 |
| Parameter | Plot |
|---|---|
| CZT HV Monitor | 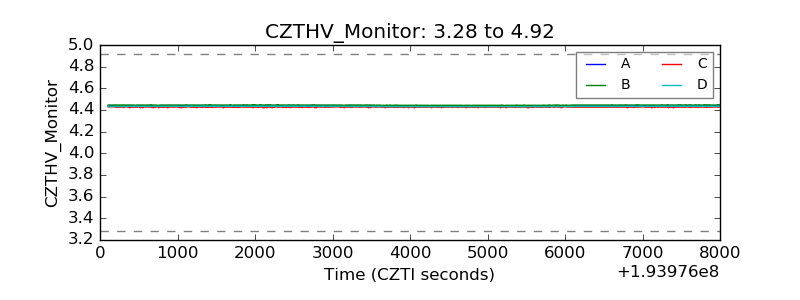 |
| D_VDD | 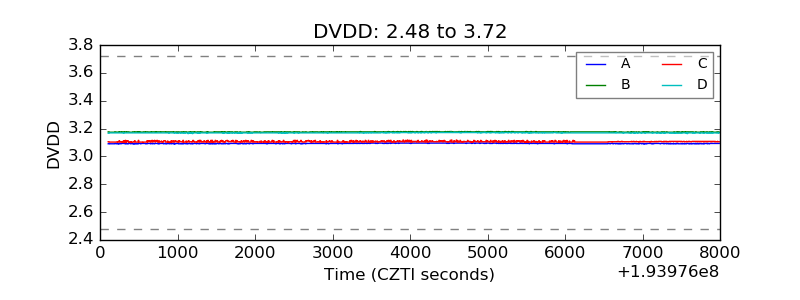 |
| Temperature 1 | 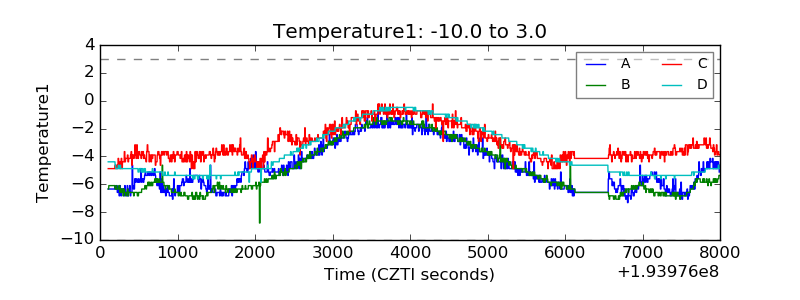 |
| Veto HV Monitor | 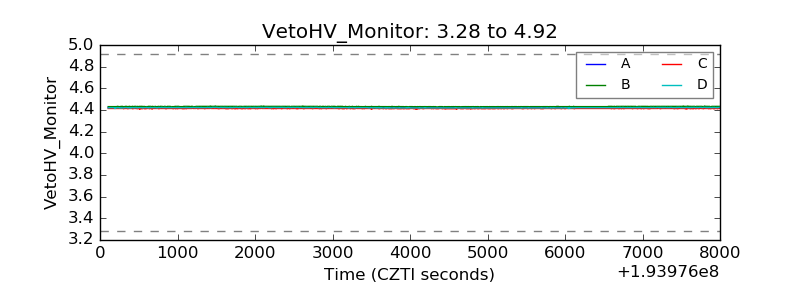 |
| Veto LLD | 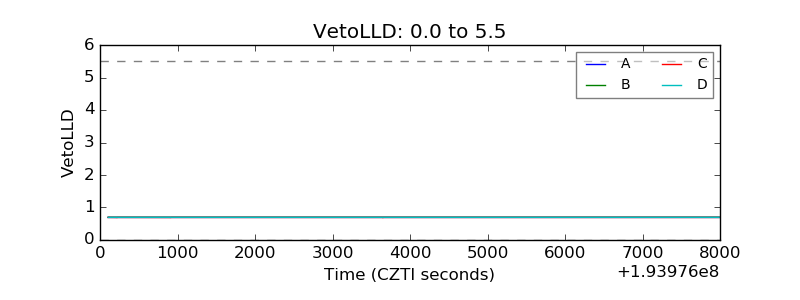 |
| Alpha Counter | 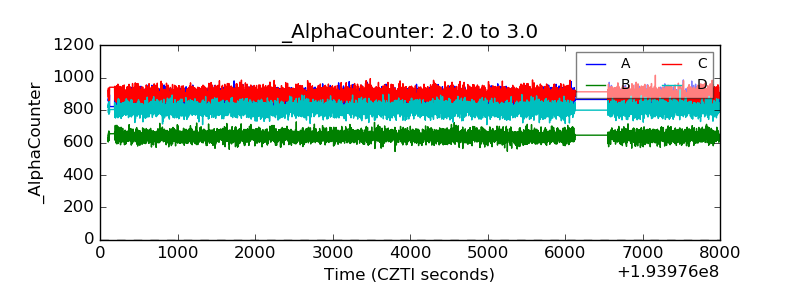 |
| _CPM_Rate | 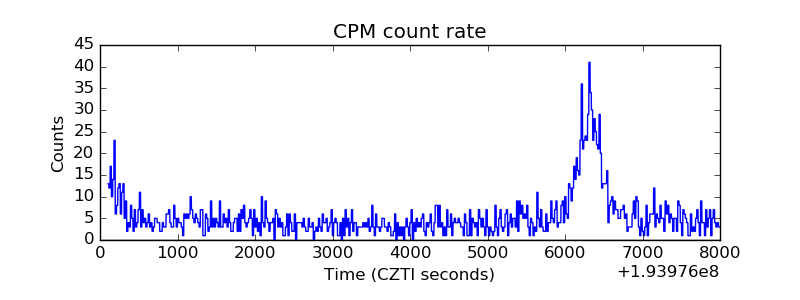 |
| CZT Counter | 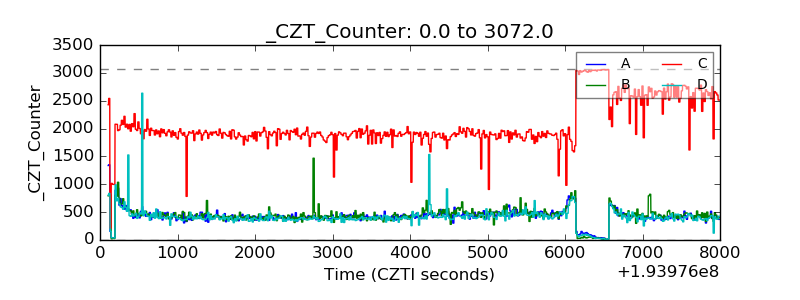 |
| +2.5 Volts monitor | 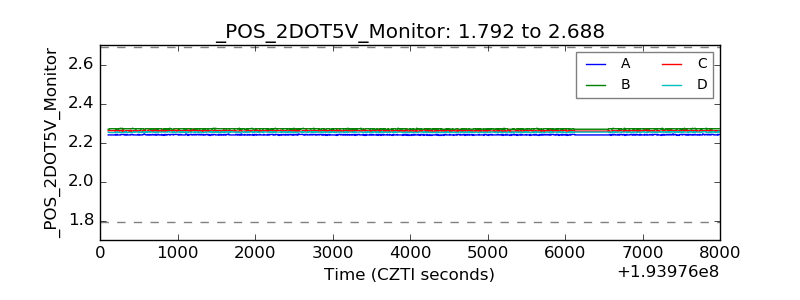 |
| +5 Volts monitor | 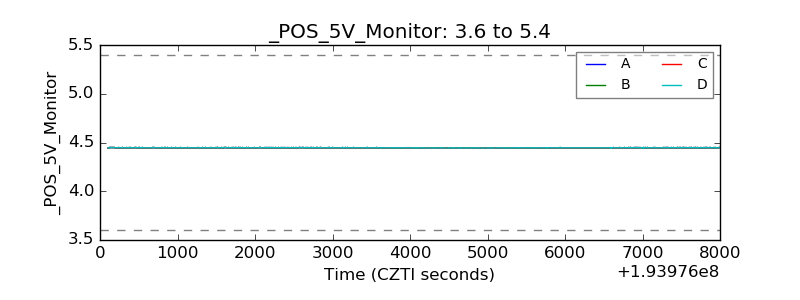 |
| _ROLL_ROT | 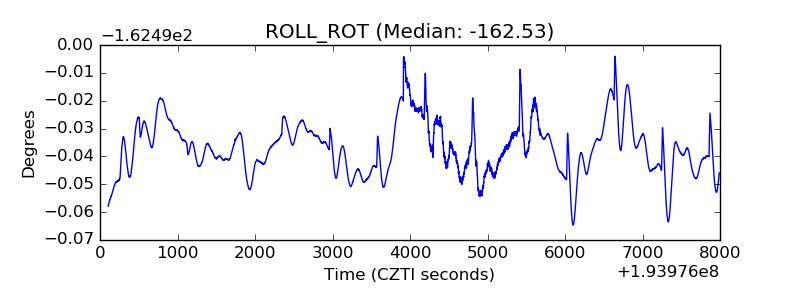 |
| _Roll_DEC | 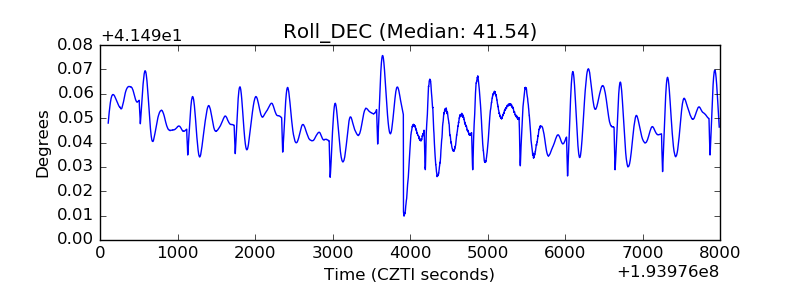 |
| _Roll_RA | 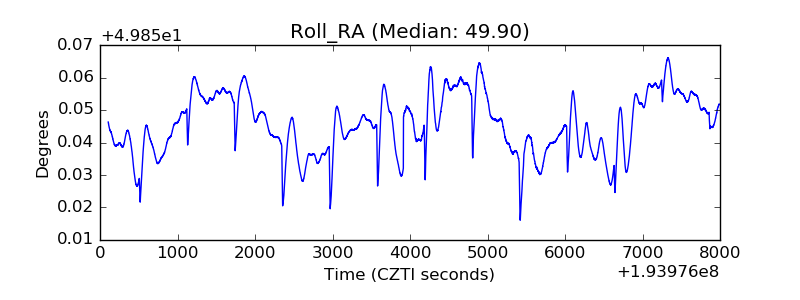 |
| Veto Counter | 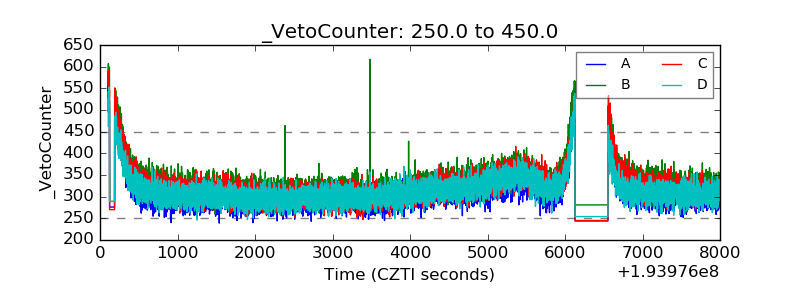 |