| Param | Original file | Final file |
|---|---|---|
| Filename | modeM0/AS1T01_072T04_9000000342_02208cztM0_level2.evt | modeM0/AS1T01_072T04_9000000342_02208cztM0_level2_quad_clean.evt |
| Size (bytes) | 843,180,480 | 74,263,680 |
| Size | 804.1 MB | 70.8 MB |
| Events in quadrant A | 3,362,832 | 500,006 |
| Events in quadrant B | 3,185,445 | 510,433 |
| Events in quadrant C | 15,622,001 | 273,564 |
| Events in quadrant D | 2,898,292 | 483,218 |
| Mode M0 | |||
|---|---|---|---|
| Quadrant | BADHDUFLAG | Total packets | Discarded packets |
| A | 0 | 14149 | 1 |
| B | 0 | 14020 | 1 |
| C | 0 | 51092 | 18 |
| D | 0 | 13924 | 1 |
| Mode SS | |||
|---|---|---|---|
| Quadrant | BADHDUFLAG | Total packets | Discarded packets |
| A | 0 | 138 | 0 |
| B | 0 | 138 | 0 |
| C | 0 | 138 | 0 |
| D | 0 | 138 | 0 |
| Mode M9 | |||
|---|---|---|---|
| Quadrant | BADHDUFLAG | Total packets | Discarded packets |
| A | 0 | 1 | 0 |
| B | 1 | 1 | 0 |
| C | 1 | -1 | -1 |
| D | 1 | -1 | -1 |
| Quadrant | Total seconds | Saturated seconds | Saturation percentage |
|---|---|---|---|
| A | 6878 | 63 | 0.915964% |
| B | 6878 | 67 | 0.974120% |
| C | 6876 | 6876 | 100.000000% |
| D | 6878 | 40 | 0.581564% |
Noise dominated data is calculated using 1-second bins in cleaned event files. If a bin has >2000 counts, and if more than 50% of those come from <1% of pixels, then it is considered to be noise-dominated and hence unusable.
| Quadrant | # 1 sec bins | Bins with >0 counts | Bins with >2000 counts | High rate bins dominated by noise | Noise dominated (total time) | Noise dominated (detector-on time) | Marked lightcurve |
|---|---|---|---|---|---|---|---|
| A | 7603 | 6878 | 0 | 0 | 0.00% | 0.00% |  |
| B | 7603 | 6879 | 0 | 0 | 0.00% | 0.00% | 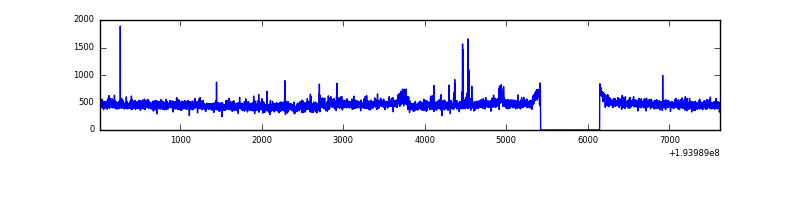 |
| C | 7603 | 6878 | 6094 | 6094 | 80.15% | 88.60% | 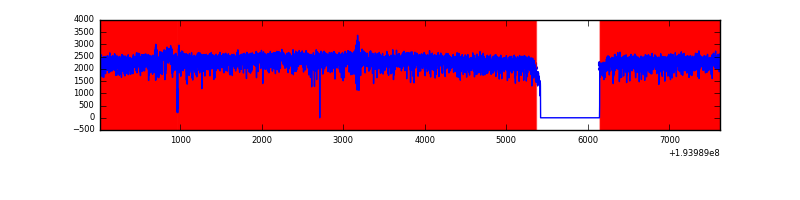 |
| D | 7603 | 6879 | 2 | 2 | 0.03% | 0.03% |  |
Top three noisy pixels from each quadrant. If the there are fewer than three noisy pixels in the level2.evt file, extra rows are filled as -1
| Pixel properties | Quadrant properties | ||||||
|---|---|---|---|---|---|---|---|
| Quadrant | DetID | PixID | Counts | Sigma | Mean | Median | Sigma |
| A | 15 | 171 | 334168 | 2076.32 | 778 | 759 | 160.6 |
| A | 10 | 2 | 13579 | 79.84 | 778 | 759 | 160.6 |
| A | 15 | 47 | 10799 | 62.52 | 778 | 759 | 160.6 |
| B | 4 | 158 | 59795 | 384.35 | 792 | 770 | 153.6 |
| B | 15 | 85 | 29326 | 185.95 | 792 | 770 | 153.6 |
| B | 5 | 175 | 14031 | 86.35 | 792 | 770 | 153.6 |
| C | 0 | 187 | 11601238 | 75188.76 | 508 | 499 | 154.3 |
| C | 14 | 223 | 517432 | 3350.44 | 508 | 499 | 154.3 |
| C | 12 | 180 | 336724 | 2179.2 | 508 | 499 | 154.3 |
| D | 13 | 238 | 15612 | 83.25 | 748 | 729 | 178.8 |
| D | 15 | 194 | 13802 | 73.12 | 748 | 729 | 178.8 |
| D | 10 | 149 | 13205 | 69.78 | 748 | 729 | 178.8 |
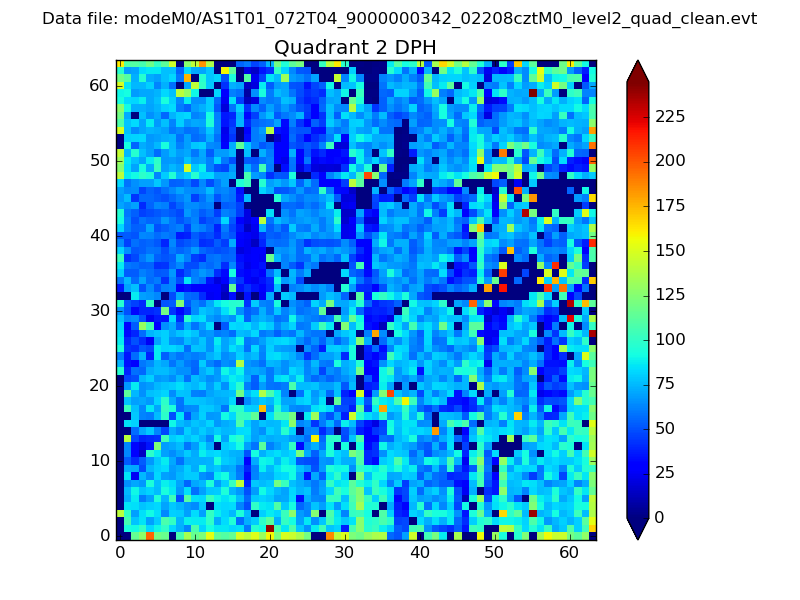
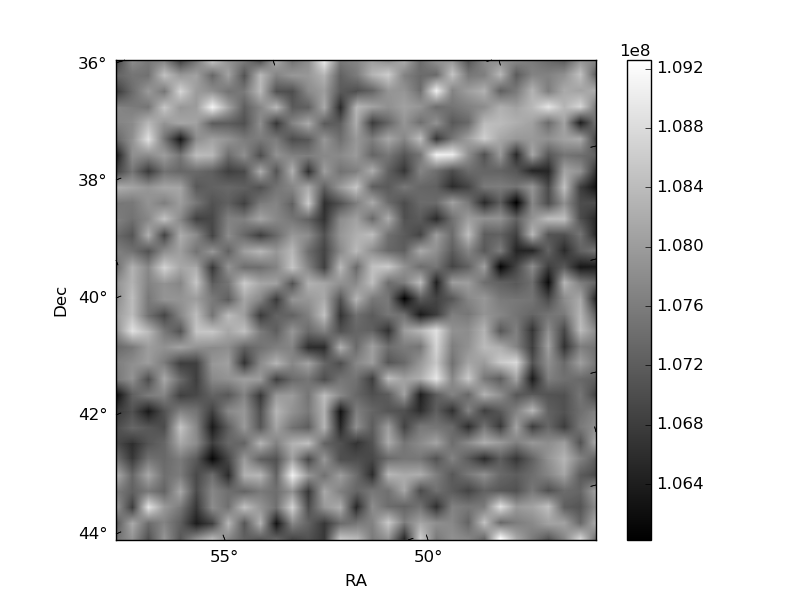
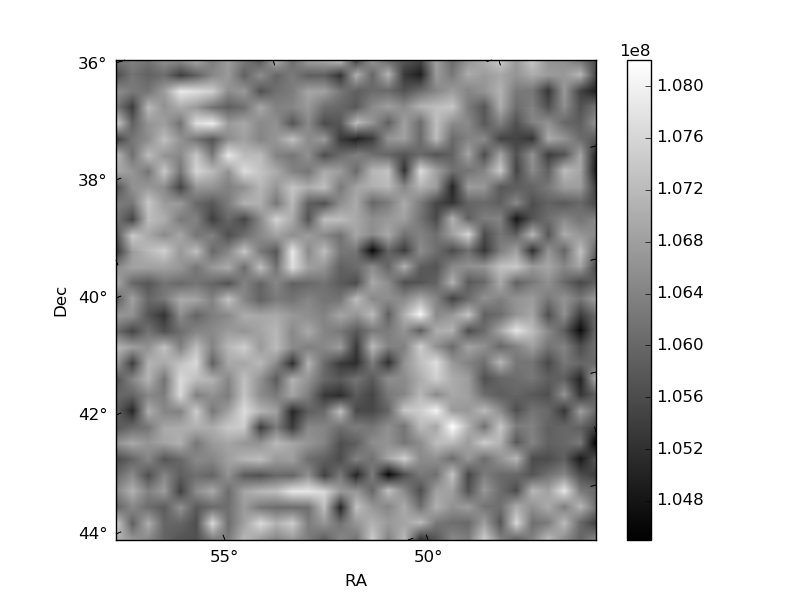
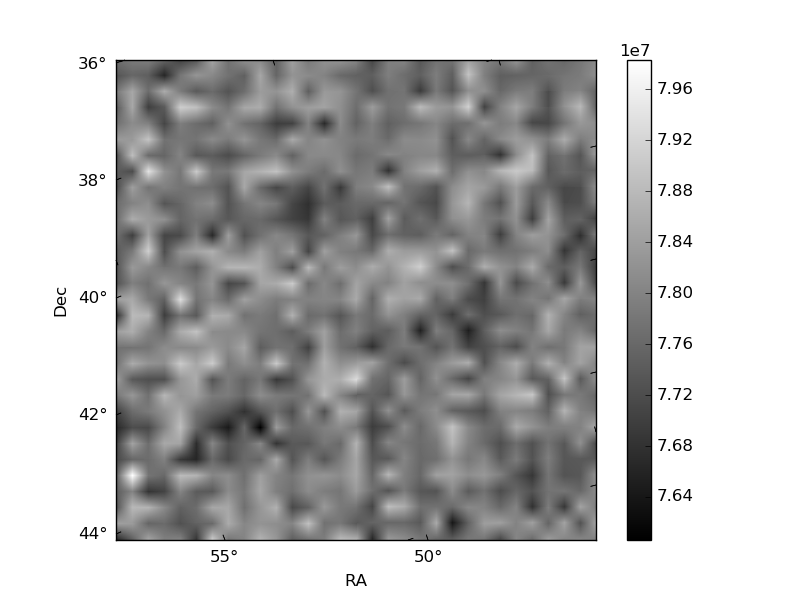
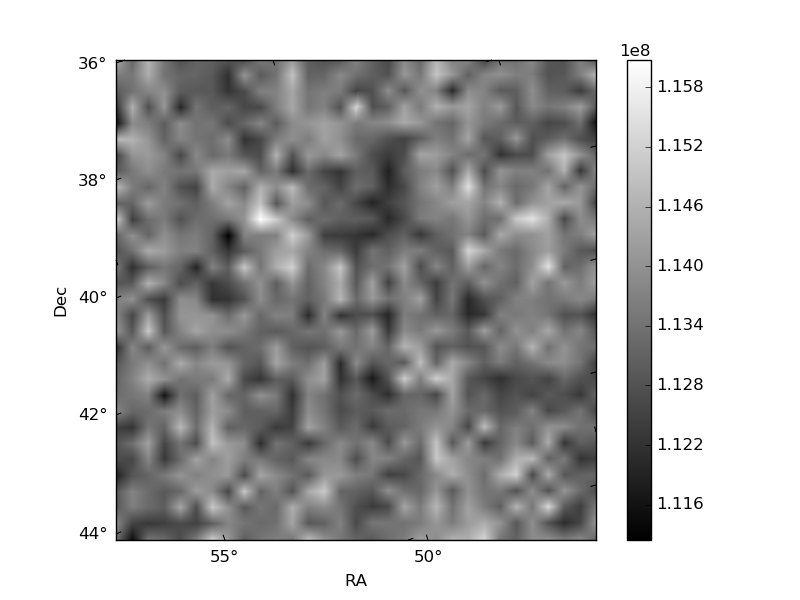
Histogram calculated using DETX and DETY for each event in the final _common_clean file
| Quadrant A | 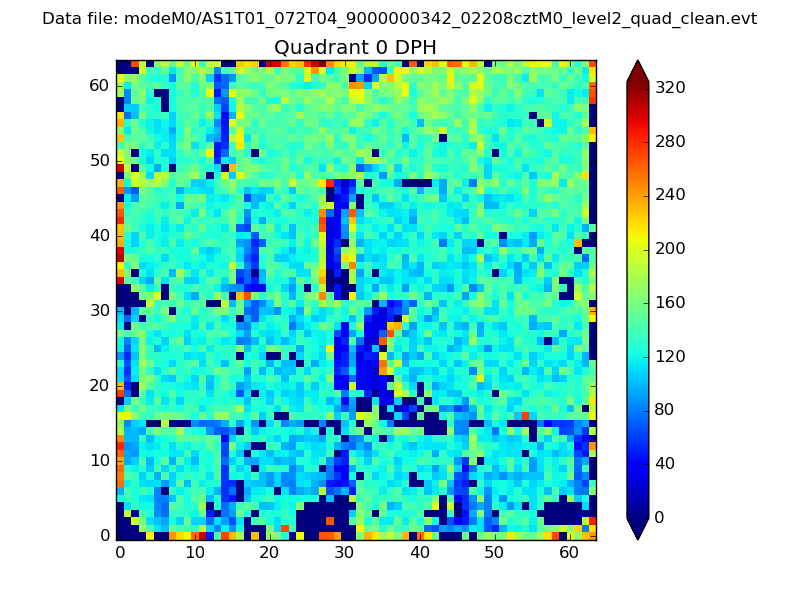 |
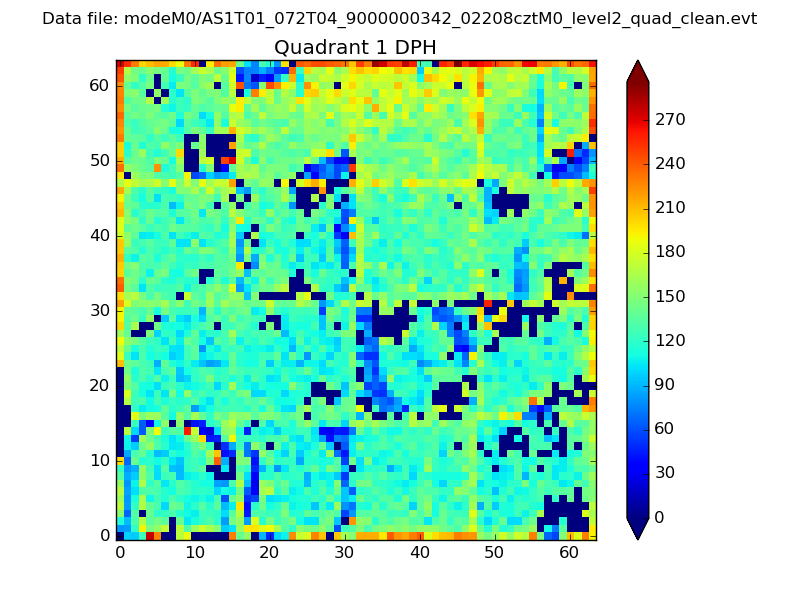 |
Quadrant B |
|---|---|---|---|
| Quadrant D | 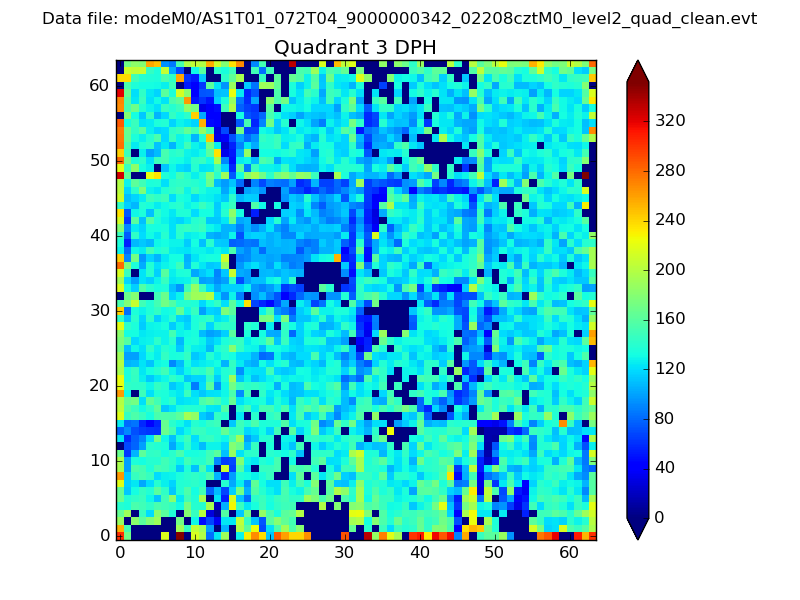 |
 |
Quadrant C |
| Plot type | Count rate plots | Images |
|---|---|---|
| Comparison with Poisson distribution Blue bars denote a histogram of data divided into 1 sec bins. Red curve is a Poisson curve with rate = median count rate of data. |
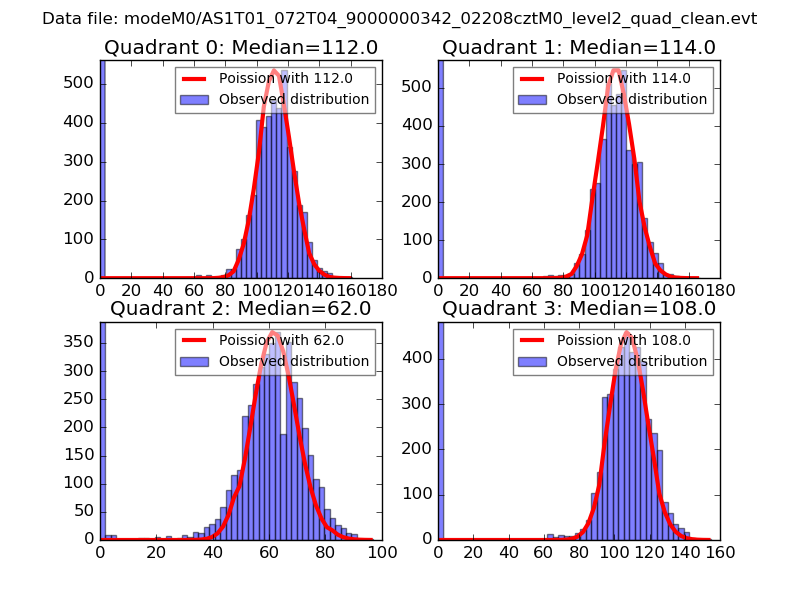 |
 |
| Quadrant-wise count rates Data is divided into 100 sec bins |
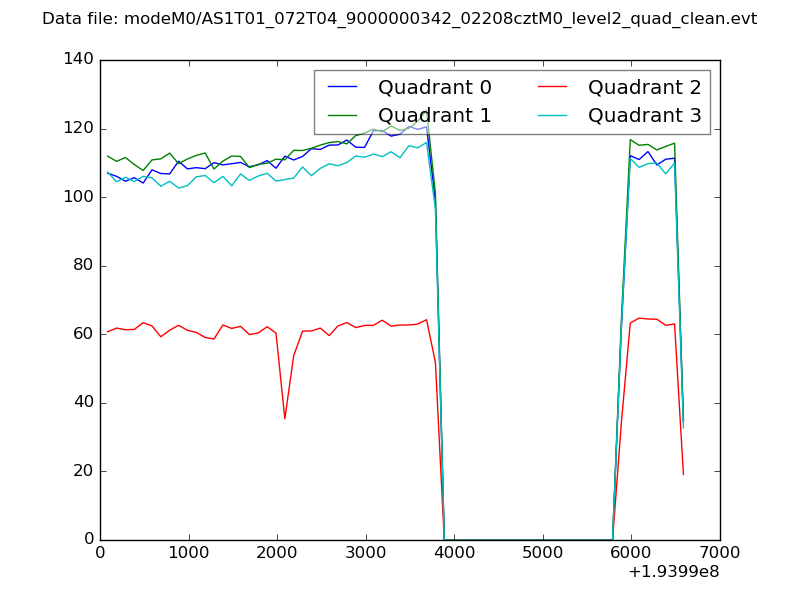 |
|
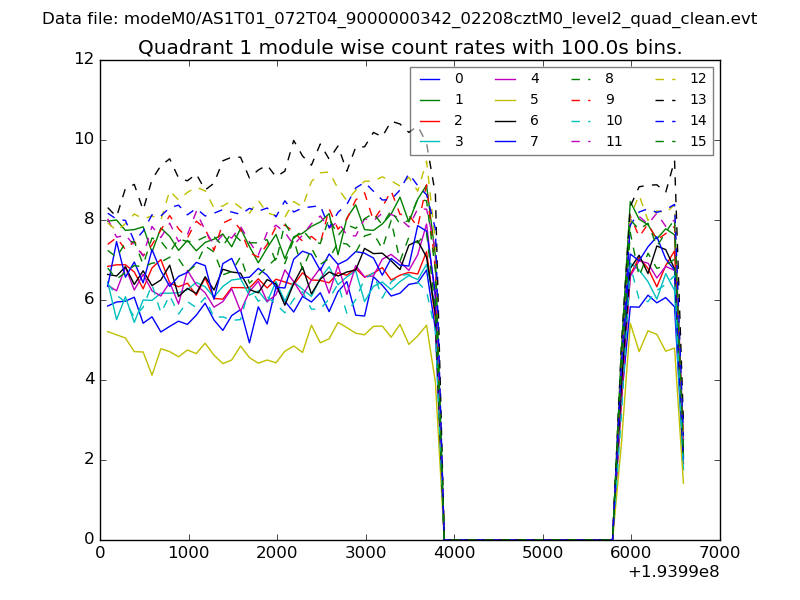
| Module-wise count rates for Quadrant A Data is divided into 100 sec bins |
 |
 |
| Module-wise count rates for Quadrant B Data is divided into 100 sec bins |
 |
 |
| Module-wise count rates for Quadrant C Data is divided into 100 sec bins |
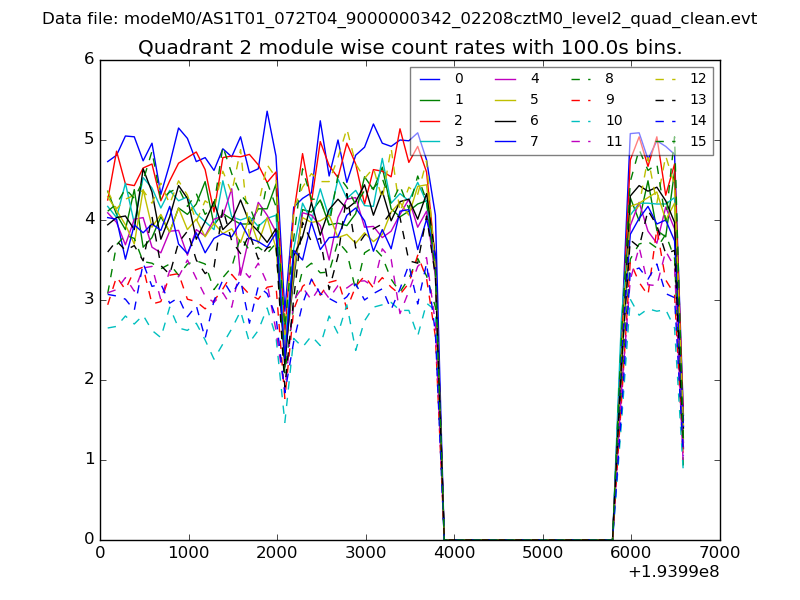 |
 |
| Module-wise count rates for Quadrant D Data is divided into 100 sec bins |
 |
 |
| Parameter | Plot |
|---|---|
| CZT HV Monitor | 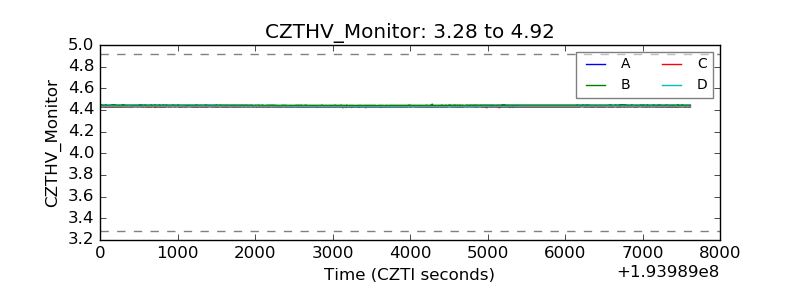 |
| D_VDD | 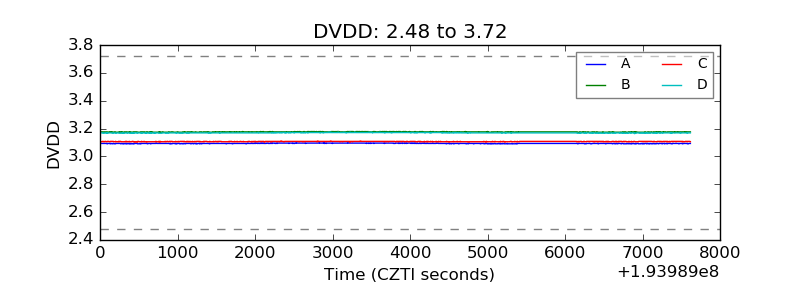 |
| Temperature 1 | 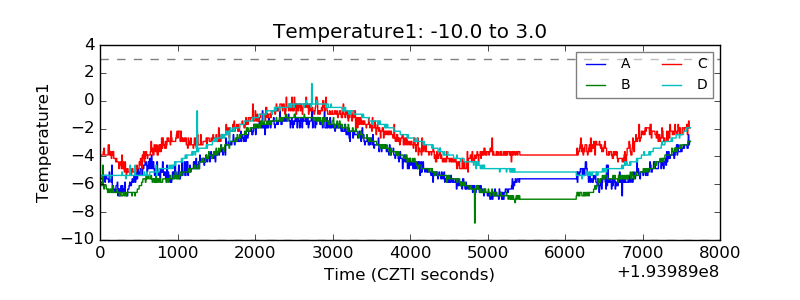 |
| Veto HV Monitor | 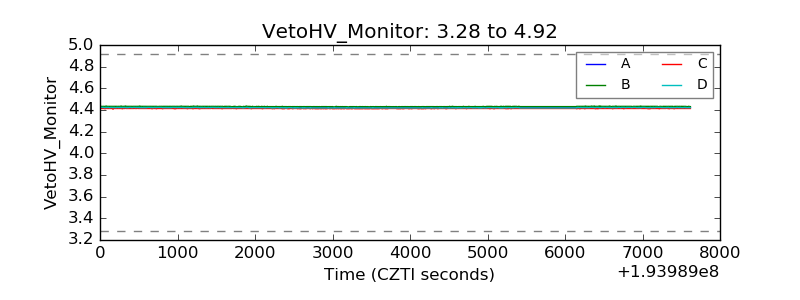 |
| Veto LLD | 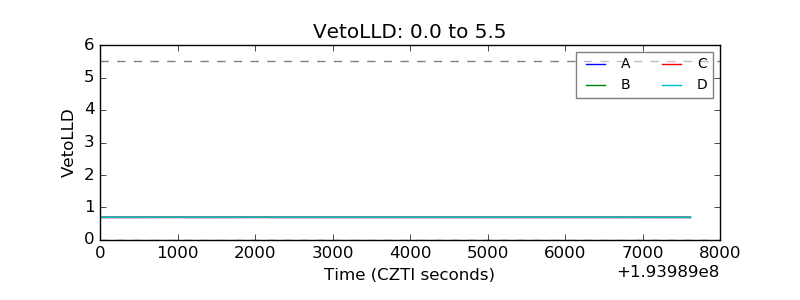 |
| Alpha Counter | 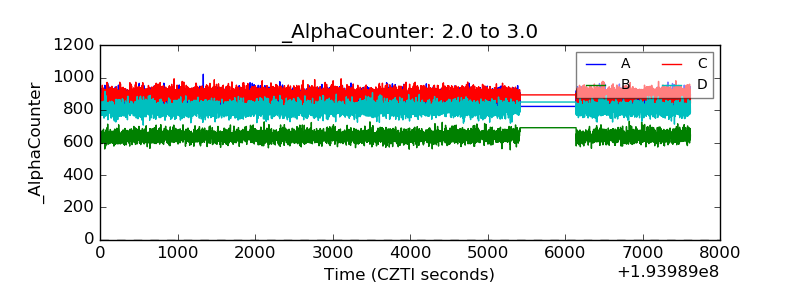 |
| _CPM_Rate | 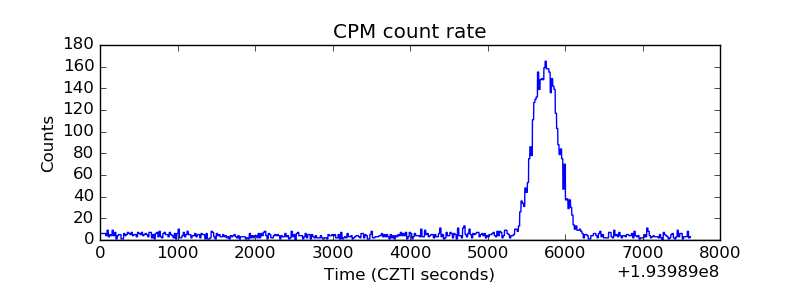 |
| CZT Counter | 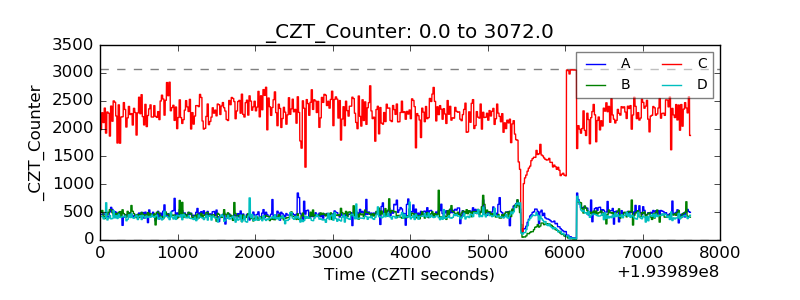 |
| +2.5 Volts monitor |  |
| +5 Volts monitor |  |
| _ROLL_ROT |  |
| _Roll_DEC | 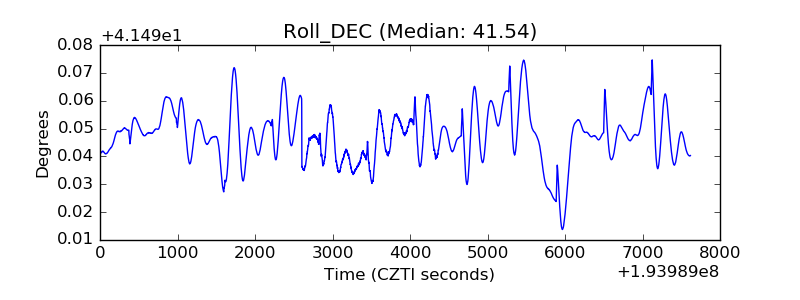 |
| _Roll_RA | 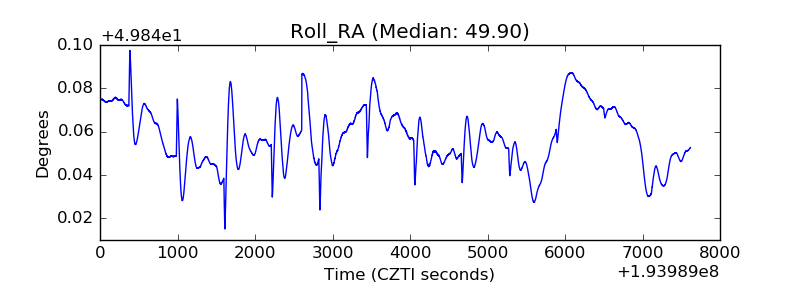 |
| Veto Counter | 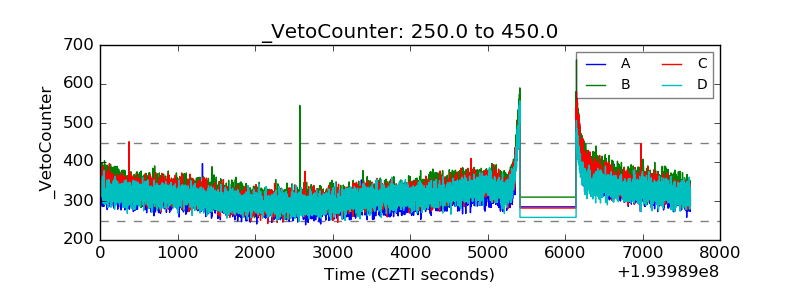 |