| Param | Original file | Final file |
|---|---|---|
| Filename | modeM0/AS1T01_072T04_9000000342_02209cztM0_level2.evt | modeM0/AS1T01_072T04_9000000342_02209cztM0_level2_quad_clean.evt |
| Size (bytes) | 764,801,280 | 77,941,440 |
| Size | 729.4 MB | 74.3 MB |
| Events in quadrant A | 3,667,375 | 543,584 |
| Events in quadrant B | 2,739,268 | 563,003 |
| Events in quadrant C | 13,738,273 | 299,491 |
| Events in quadrant D | 2,609,491 | 532,545 |
| Mode M0 | |||
|---|---|---|---|
| Quadrant | BADHDUFLAG | Total packets | Discarded packets |
| A | 0 | 14770 | 1 |
| B | 0 | 12255 | 1 |
| C | 0 | 44923 | 1 |
| D | 0 | 12281 | 5 |
| Mode SS | |||
|---|---|---|---|
| Quadrant | BADHDUFLAG | Total packets | Discarded packets |
| A | 0 | 120 | 0 |
| B | 0 | 120 | 0 |
| C | 0 | 120 | 0 |
| D | 0 | 120 | 0 |
| Mode M9 | |||
|---|---|---|---|
| Quadrant | BADHDUFLAG | Total packets | Discarded packets |
| A | 0 | 1 | 0 |
| B | 1 | 1 | 0 |
| C | 1 | -1 | -1 |
| D | 1 | -1 | -1 |
| Quadrant | Total seconds | Saturated seconds | Saturation percentage |
|---|---|---|---|
| A | 5972 | 424 | 7.099799% |
| B | 6011 | 18 | 0.299451% |
| C | 6011 | 6011 | 100.000000% |
| D | 6009 | 12 | 0.199700% |
Noise dominated data is calculated using 1-second bins in cleaned event files. If a bin has >2000 counts, and if more than 50% of those come from <1% of pixels, then it is considered to be noise-dominated and hence unusable.
| Quadrant | # 1 sec bins | Bins with >0 counts | Bins with >2000 counts | High rate bins dominated by noise | Noise dominated (total time) | Noise dominated (detector-on time) | Marked lightcurve |
|---|---|---|---|---|---|---|---|
| A | 6892 | 5973 | 345 | 345 | 5.01% | 5.78% | 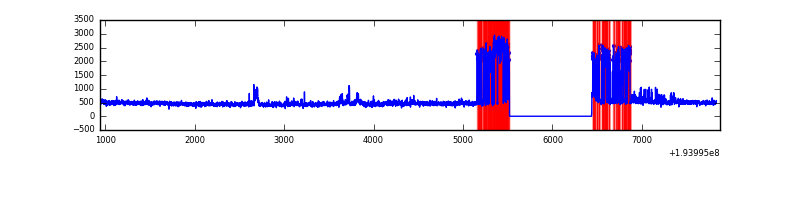 |
| B | 6931 | 6012 | 0 | 0 | 0.00% | 0.00% | 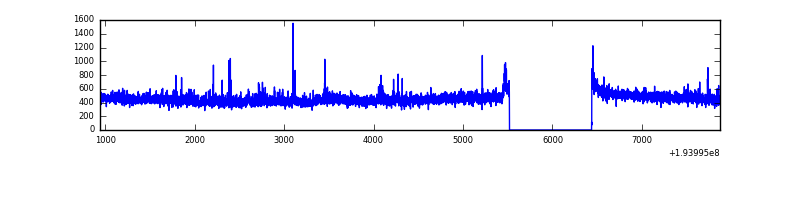 |
| C | 6931 | 6012 | 5438 | 5438 | 78.46% | 90.45% | 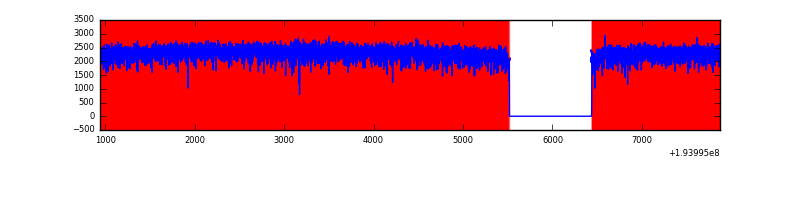 |
| D | 6931 | 6011 | 7 | 7 | 0.10% | 0.12% | 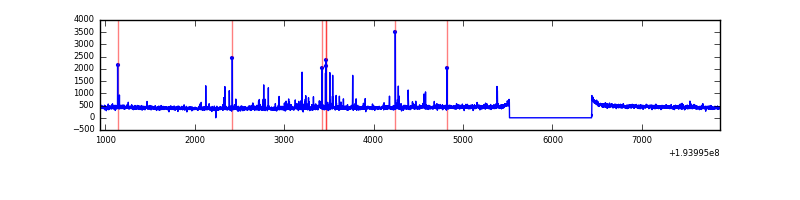 |
Top three noisy pixels from each quadrant. If the there are fewer than three noisy pixels in the level2.evt file, extra rows are filled as -1
| Pixel properties | Quadrant properties | ||||||
|---|---|---|---|---|---|---|---|
| Quadrant | DetID | PixID | Counts | Sigma | Mean | Median | Sigma |
| A | 15 | 171 | 1118859 | 8215.88 | 652 | 636 | 136.1 |
| A | 10 | 2 | 15696 | 110.65 | 652 | 636 | 136.1 |
| A | 3 | 1 | 11891 | 82.69 | 652 | 636 | 136.1 |
| B | 15 | 85 | 30320 | 223.05 | 688 | 672 | 132.9 |
| B | 4 | 158 | 23699 | 173.24 | 688 | 672 | 132.9 |
| B | 14 | 167 | 11463 | 81.18 | 688 | 672 | 132.9 |
| C | 0 | 187 | 10361194 | 73124.15 | 452 | 443 | 141.7 |
| C | 12 | 180 | 298125 | 2100.98 | 452 | 443 | 141.7 |
| C | 14 | 223 | 281636 | 1984.61 | 452 | 443 | 141.7 |
| D | 9 | 64 | 48798 | 307.37 | 653 | 638 | 156.7 |
| D | 10 | 149 | 20823 | 128.83 | 653 | 638 | 156.7 |
| D | 10 | 154 | 17229 | 105.89 | 653 | 638 | 156.7 |
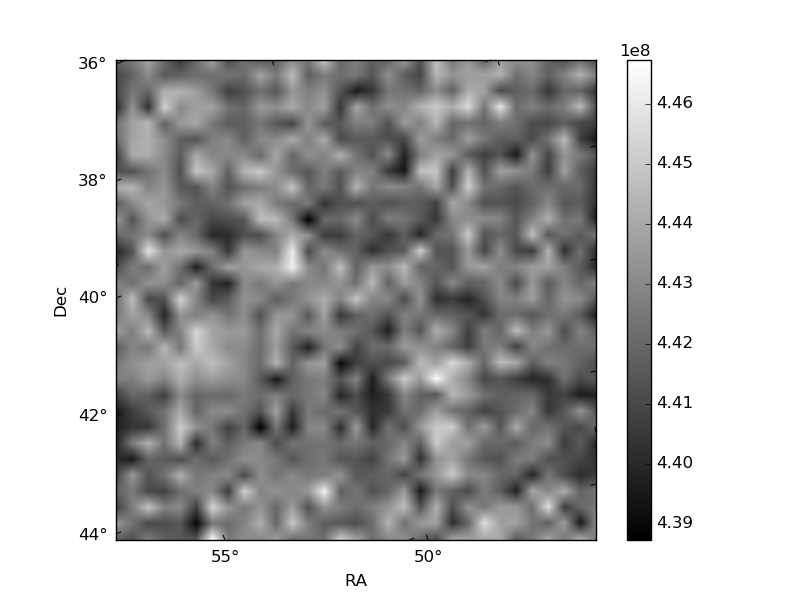
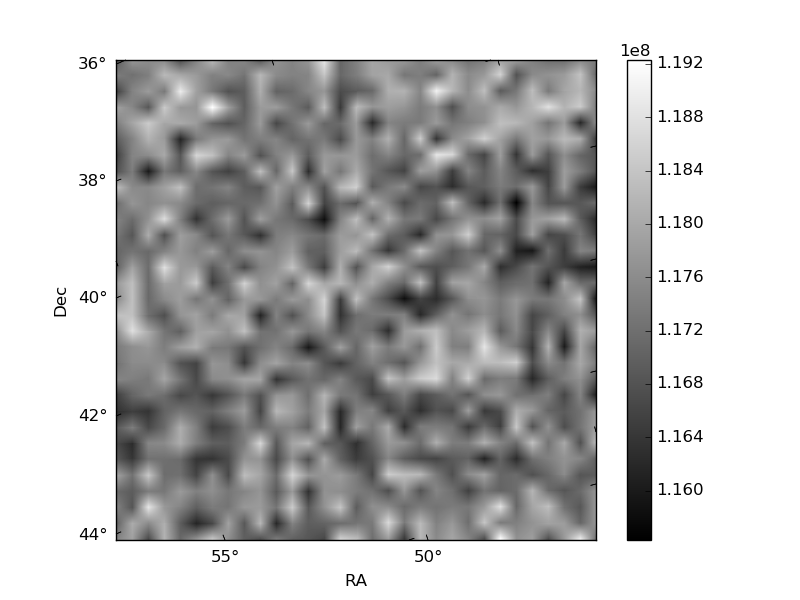
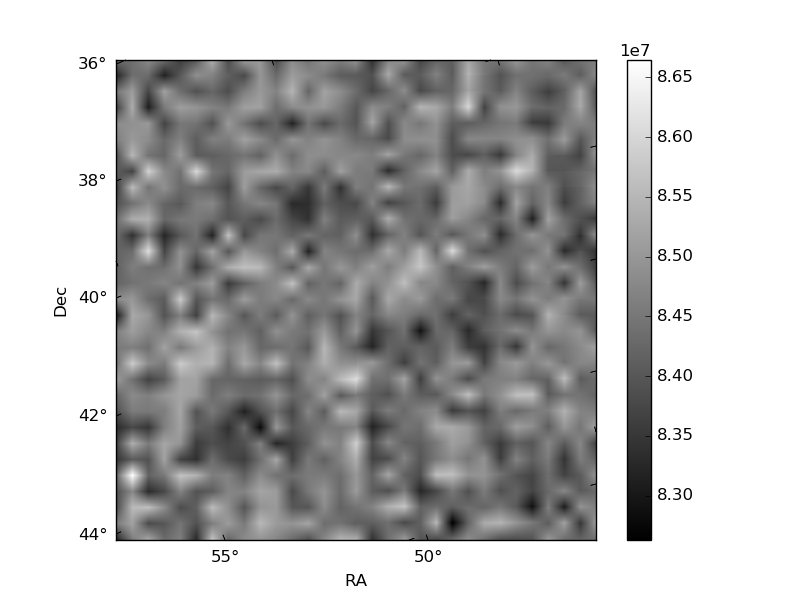
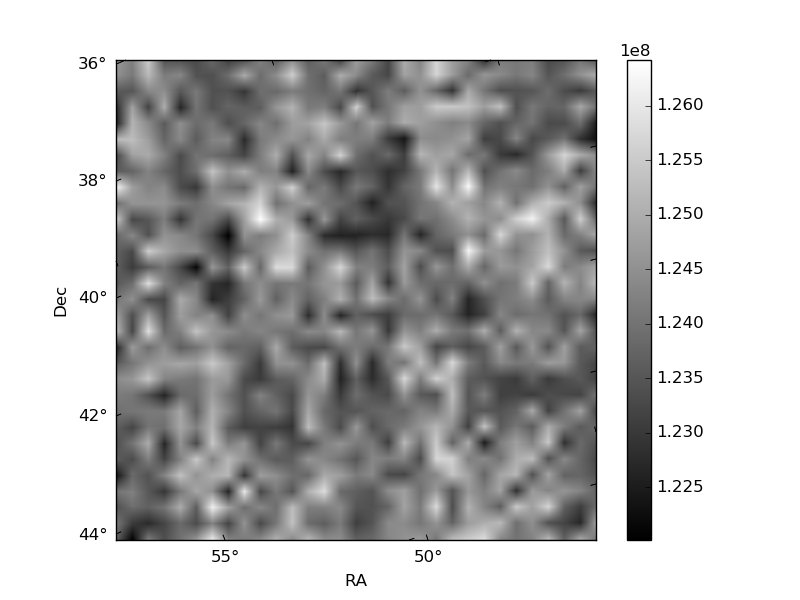
Histogram calculated using DETX and DETY for each event in the final _common_clean file
| Quadrant A | 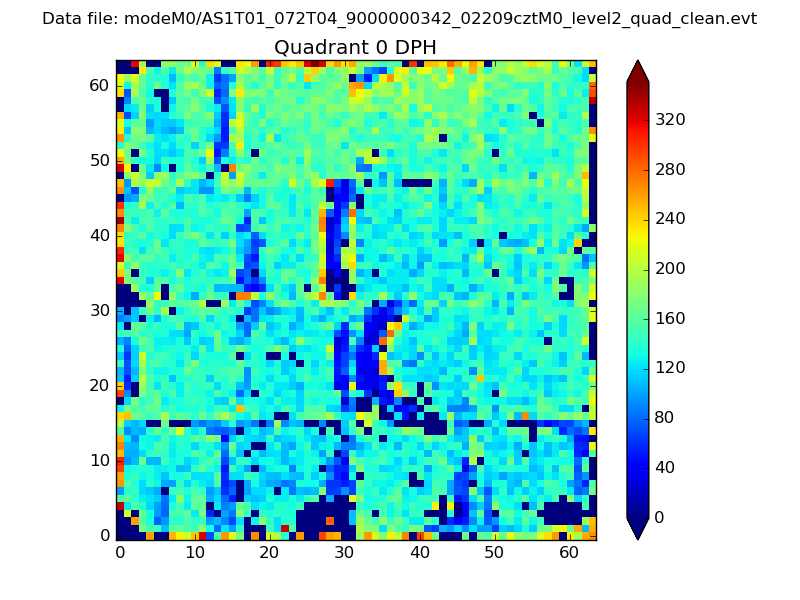 |
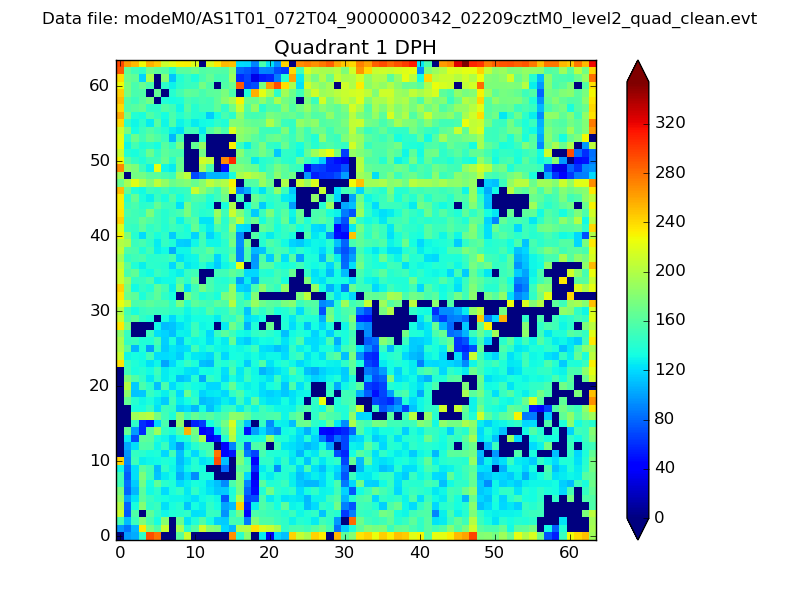 |
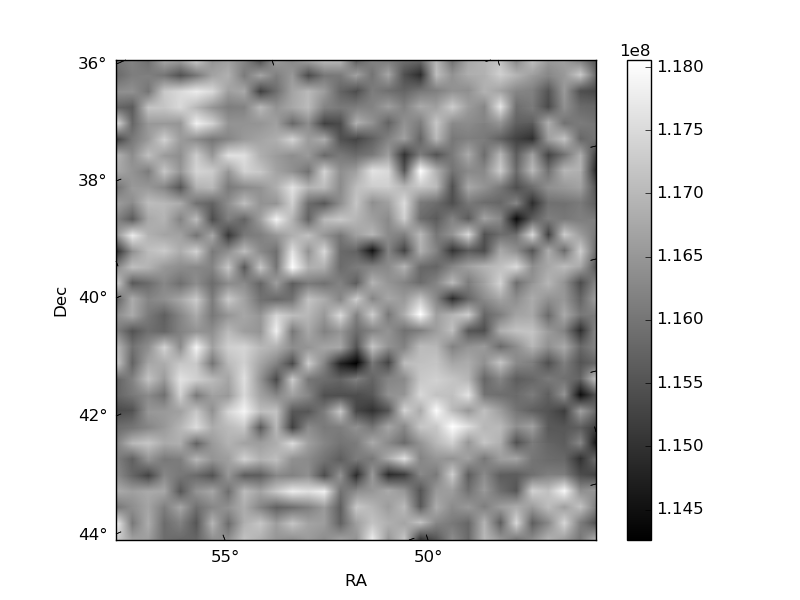
Quadrant B |
|---|---|---|---|
| Quadrant D | 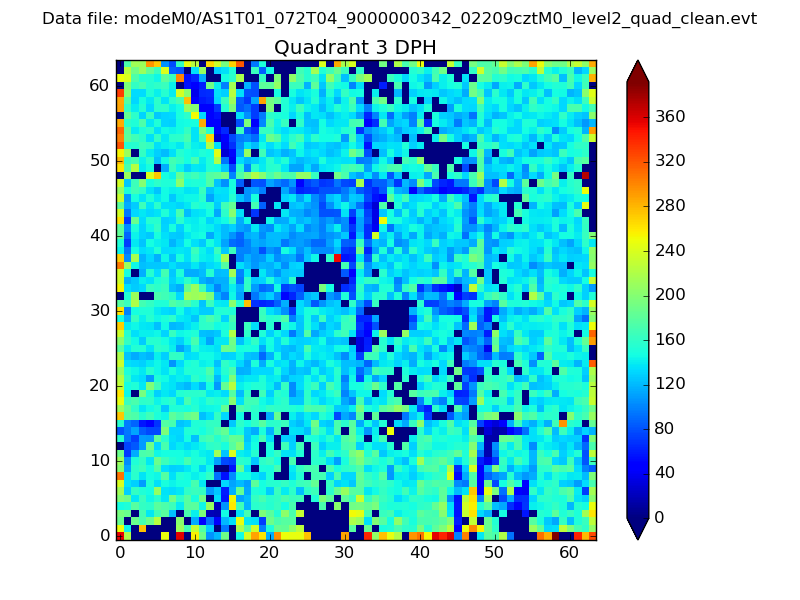 |
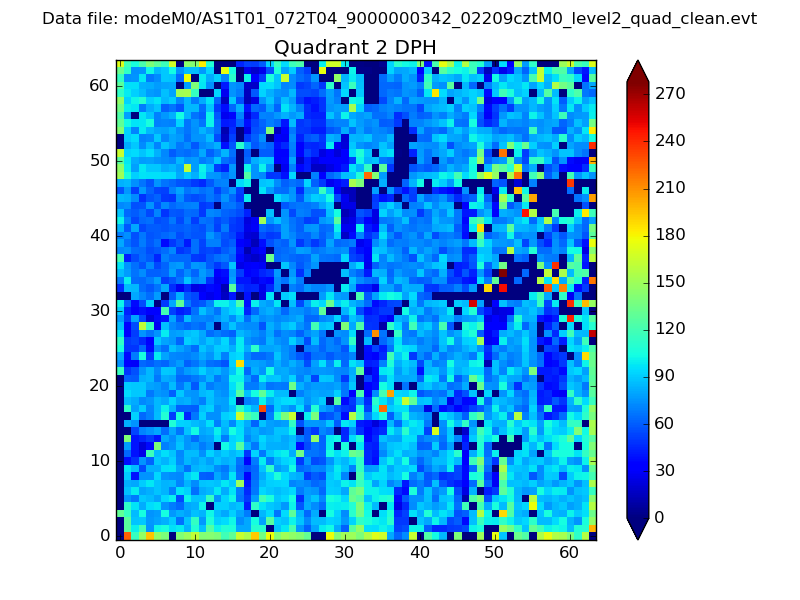 |
Quadrant C |
| Plot type | Count rate plots | Images |
|---|---|---|
| Comparison with Poisson distribution Blue bars denote a histogram of data divided into 1 sec bins. Red curve is a Poisson curve with rate = median count rate of data. |
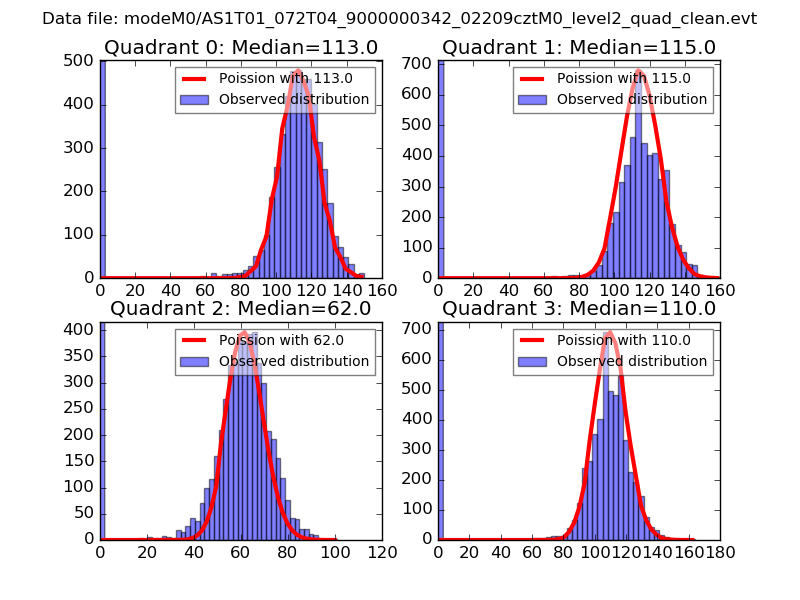 |
 |
| Quadrant-wise count rates Data is divided into 100 sec bins |
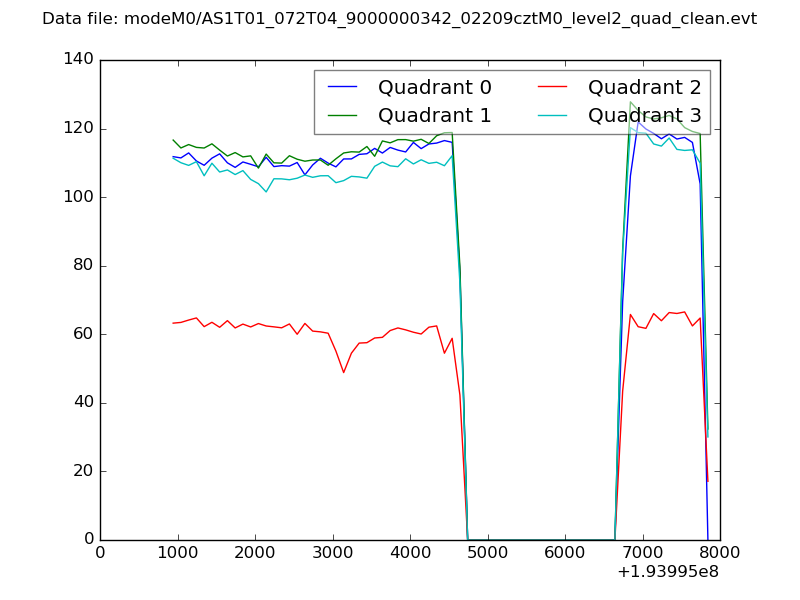 |
|
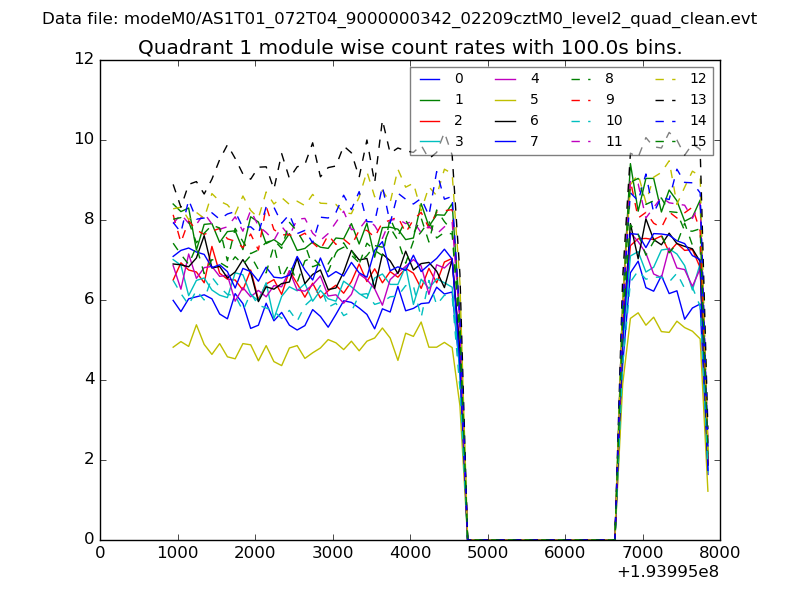
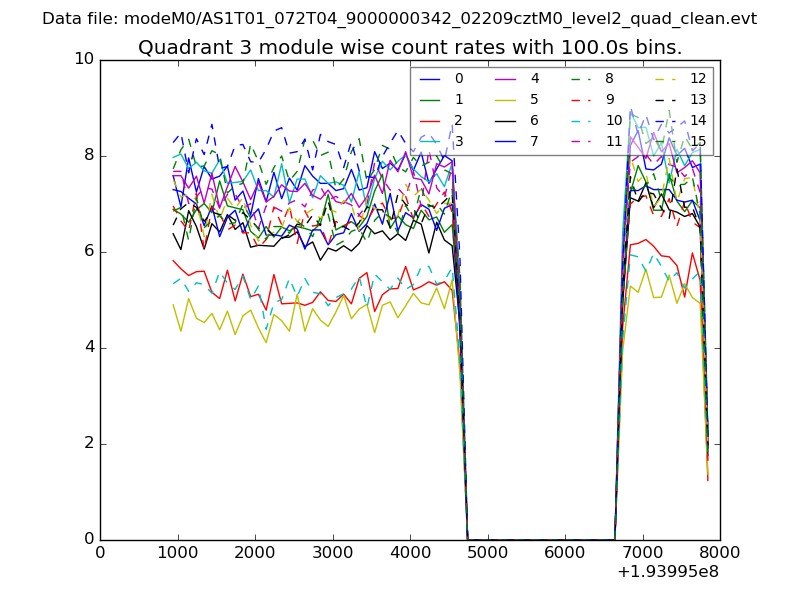
| Module-wise count rates for Quadrant A Data is divided into 100 sec bins |
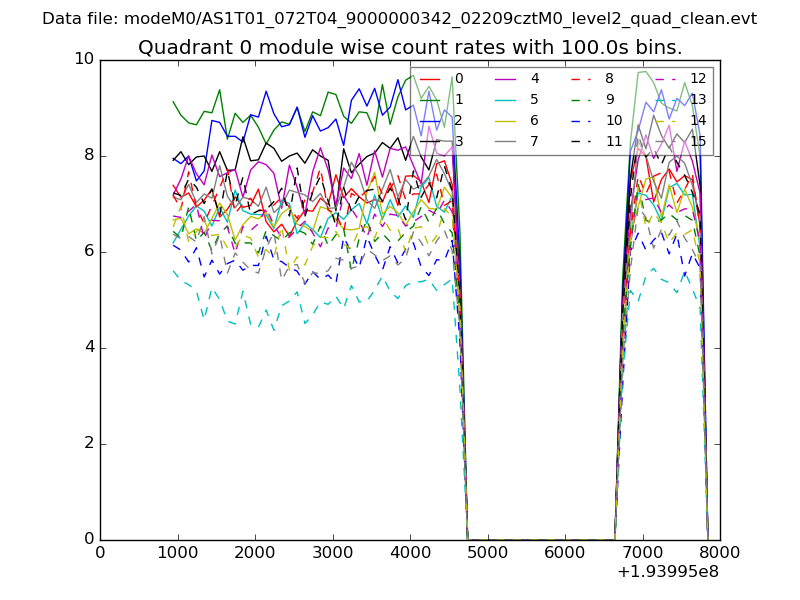 |
 |
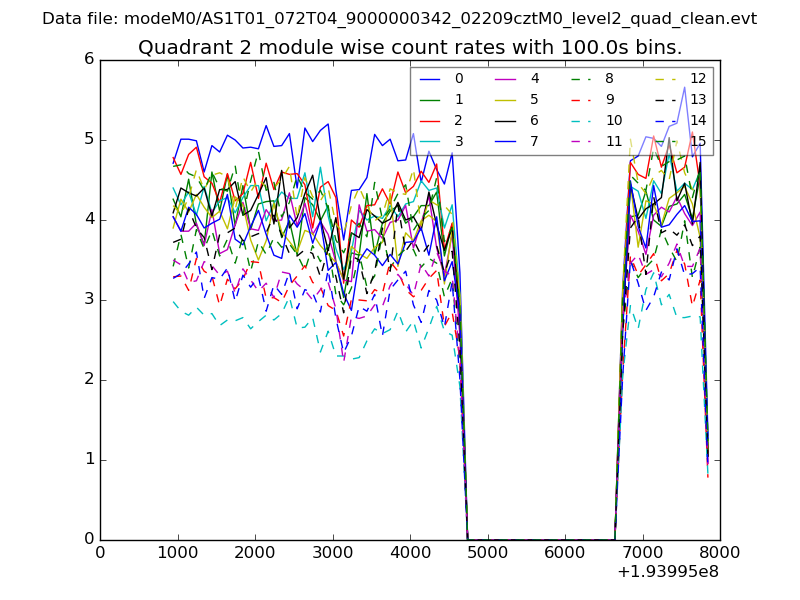
| Module-wise count rates for Quadrant B Data is divided into 100 sec bins |
 |
 |
| Module-wise count rates for Quadrant C Data is divided into 100 sec bins |
 |
 |
| Module-wise count rates for Quadrant D Data is divided into 100 sec bins |
 |
 |
| Parameter | Plot |
|---|---|
| CZT HV Monitor | 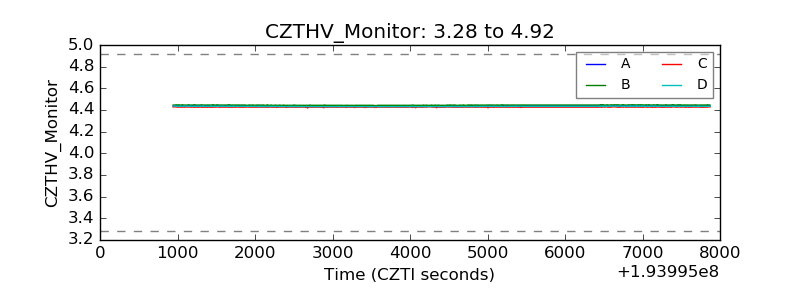 |
| D_VDD | 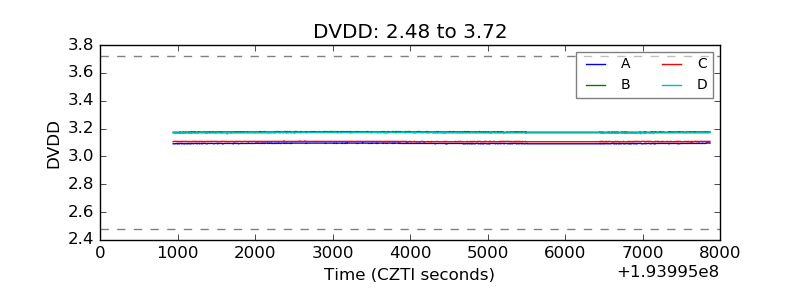 |
| Temperature 1 | 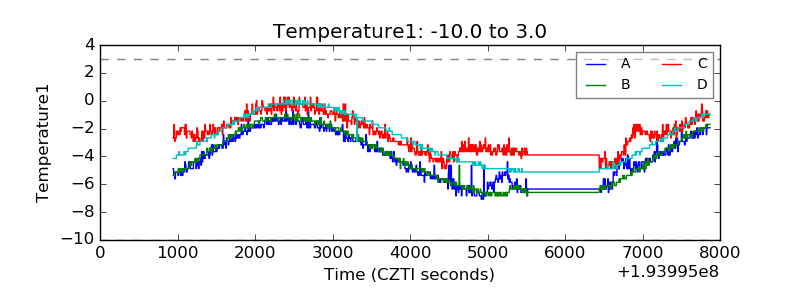 |
| Veto HV Monitor | 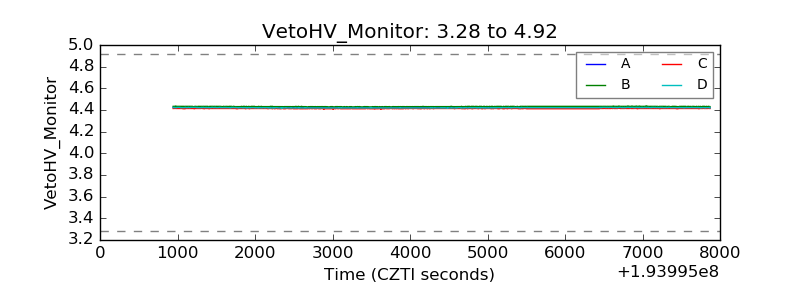 |
| Veto LLD | 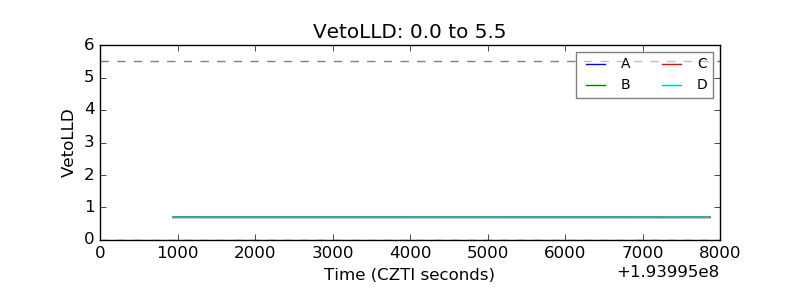 |
| Alpha Counter | 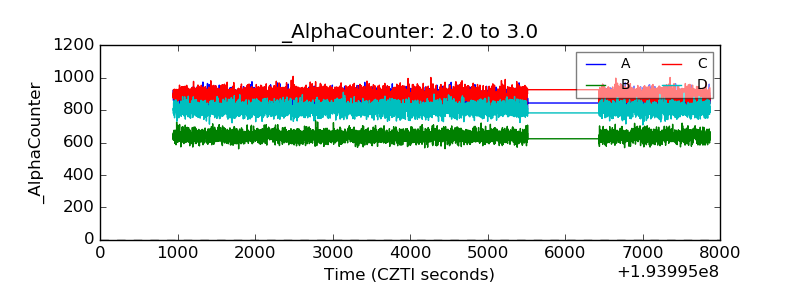 |
| _CPM_Rate | 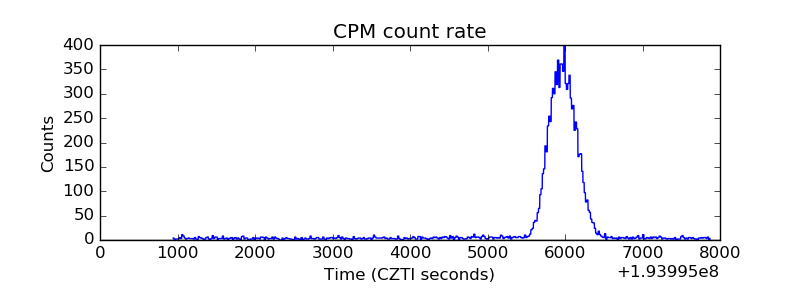 |
| CZT Counter | 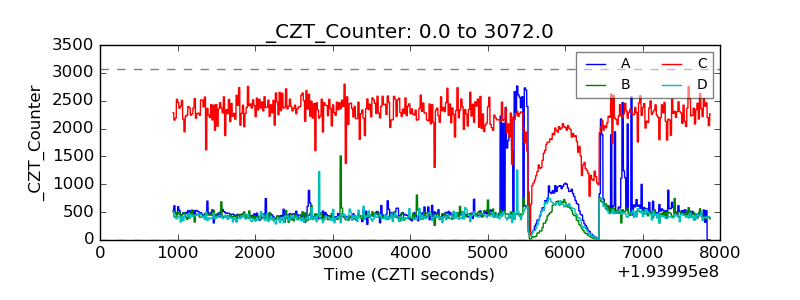 |
| +2.5 Volts monitor |  |
| +5 Volts monitor |  |
| _ROLL_ROT |  |
| _Roll_DEC |  |
| _Roll_RA | 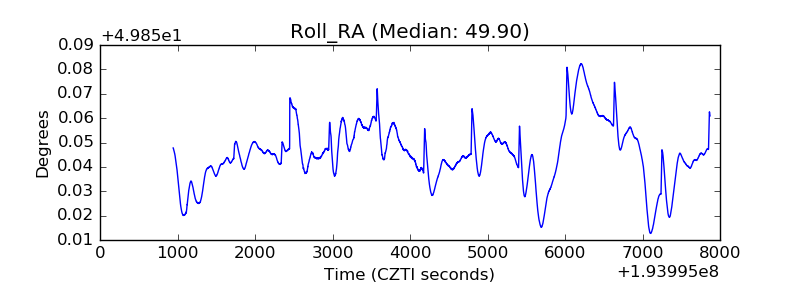 |
| Veto Counter | 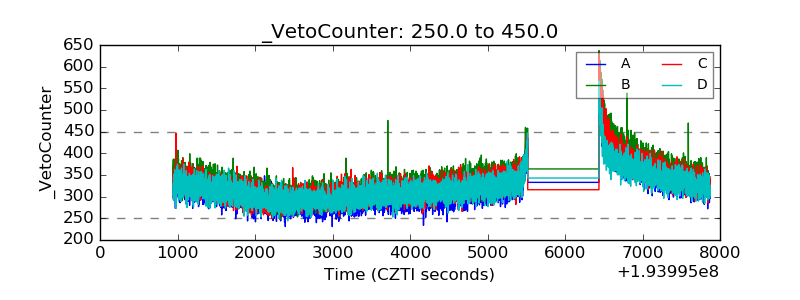 |