| Param | Original file | Final file |
|---|---|---|
| Filename | modeM0/AS1T01_072T04_9000000342_02210cztM0_level2.evt | modeM0/AS1T01_072T04_9000000342_02210cztM0_level2_quad_clean.evt |
| Size (bytes) | 1,321,539,840 | 57,096,000 |
| Size | 1.2 GB | 54.5 MB |
| Events in quadrant A | 11,970,871 | 298,229 |
| Events in quadrant B | 11,039,795 | 270,630 |
| Events in quadrant C | 5,946,193 | 488,002 |
| Events in quadrant D | 10,666,448 | 248,787 |
| Mode M0 | |||
|---|---|---|---|
| Quadrant | BADHDUFLAG | Total packets | Discarded packets |
| A | 0 | 39734 | 16 |
| B | 0 | 37166 | 1 |
| C | 0 | 22387 | 16 |
| D | 0 | 36500 | 1 |
| Mode SS | |||
|---|---|---|---|
| Quadrant | BADHDUFLAG | Total packets | Discarded packets |
| A | 0 | 122 | 0 |
| B | 0 | 122 | 0 |
| C | 0 | 122 | 0 |
| D | 0 | 122 | 0 |
| Mode M9 | |||
|---|---|---|---|
| Quadrant | BADHDUFLAG | Total packets | Discarded packets |
| A | 0 | 1 | 0 |
| B | 1 | 1 | 0 |
| C | 1 | -1 | -1 |
| D | 1 | -1 | -1 |
| Quadrant | Total seconds | Saturated seconds | Saturation percentage |
|---|---|---|---|
| A | 5956 | 4834 | 81.161854% |
| B | 5900 | 4048 | 68.610169% |
| C | 6128 | 1216 | 19.843342% |
| D | 5966 | 3744 | 62.755615% |
Noise dominated data is calculated using 1-second bins in cleaned event files. If a bin has >2000 counts, and if more than 50% of those come from <1% of pixels, then it is considered to be noise-dominated and hence unusable.
| Quadrant | # 1 sec bins | Bins with >0 counts | Bins with >2000 counts | High rate bins dominated by noise | Noise dominated (total time) | Noise dominated (detector-on time) | Marked lightcurve |
|---|---|---|---|---|---|---|---|
| A | 7216 | 5958 | 4386 | 4386 | 60.78% | 73.62% | 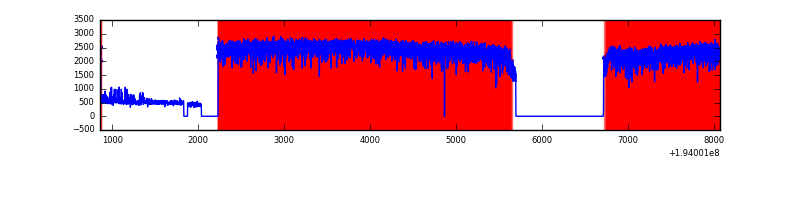 |
| B | 7216 | 5901 | 3947 | 3947 | 54.70% | 66.89% |  |
| C | 7216 | 6130 | 1014 | 1014 | 14.05% | 16.54% | 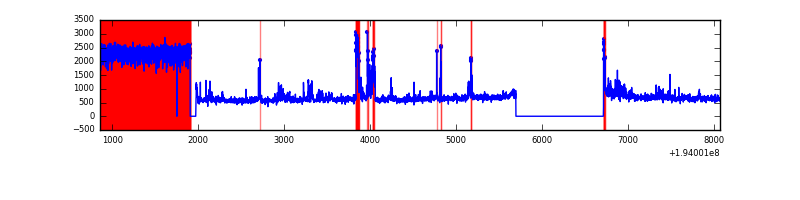 |
| D | 7216 | 5967 | 3586 | 3586 | 49.70% | 60.10% | 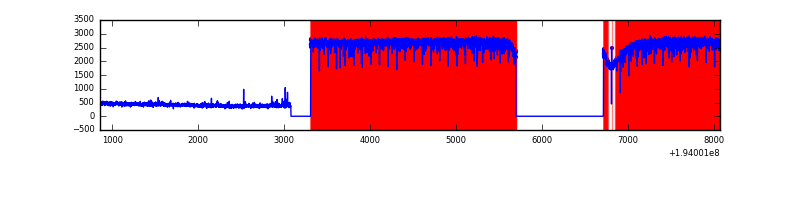 |
Top three noisy pixels from each quadrant. If the there are fewer than three noisy pixels in the level2.evt file, extra rows are filled as -1
| Pixel properties | Quadrant properties | ||||||
|---|---|---|---|---|---|---|---|
| Quadrant | DetID | PixID | Counts | Sigma | Mean | Median | Sigma |
| A | 3 | 159 | 2774979 | 17307.01 | 446 | 416 | 160.3 |
| A | 3 | 254 | 1755539 | 10948.0 | 446 | 416 | 160.3 |
| A | 11 | 246 | 657702 | 4099.98 | 446 | 416 | 160.3 |
| B | 3 | 191 | 7716733 | 45767.8 | 374 | 335 | 168.6 |
| B | 14 | 181 | 254056 | 1504.88 | 374 | 335 | 168.6 |
| B | 15 | 26 | 179545 | 1062.94 | 374 | 335 | 168.6 |
| C | 0 | 187 | 1801136 | 9529.94 | 657 | 651 | 188.9 |
| C | 1 | 192 | 279343 | 1475.11 | 657 | 651 | 188.9 |
| C | 5 | 234 | 263210 | 1389.72 | 657 | 651 | 188.9 |
| D | 3 | 254 | 2207251 | 17651.9 | 297 | 277 | 125.0 |
| D | 3 | 238 | 757285 | 6054.73 | 297 | 277 | 125.0 |
| D | 3 | 184 | 745203 | 5958.1 | 297 | 277 | 125.0 |
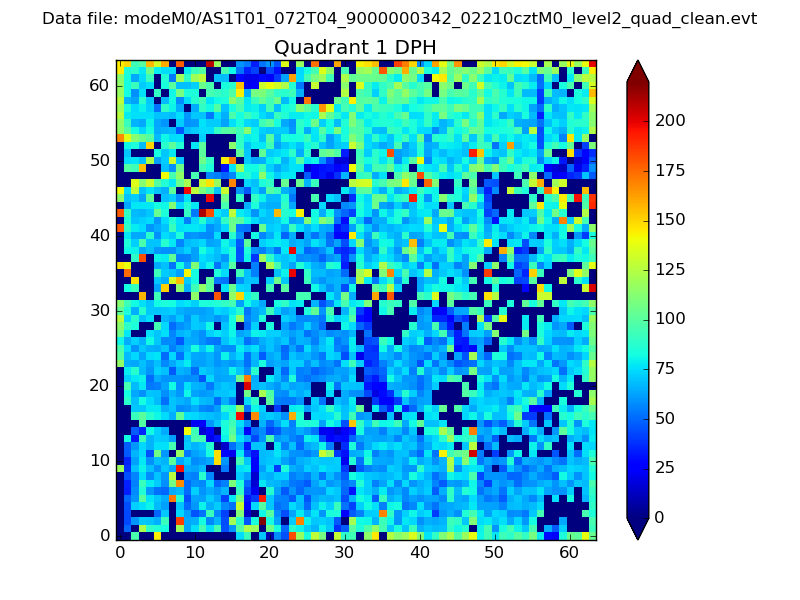
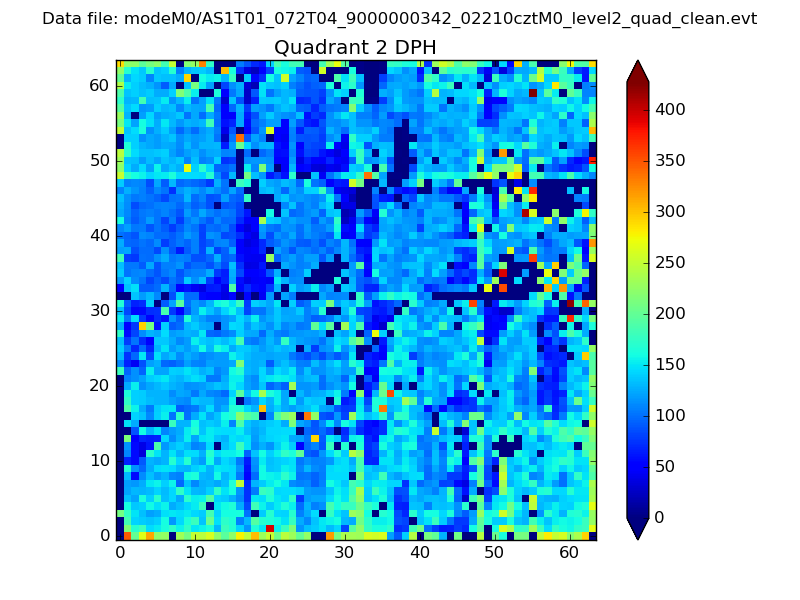
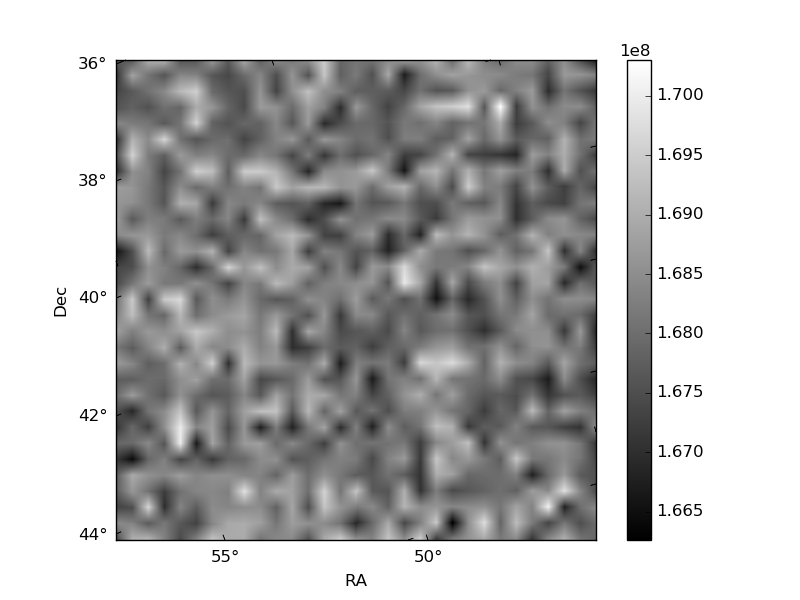
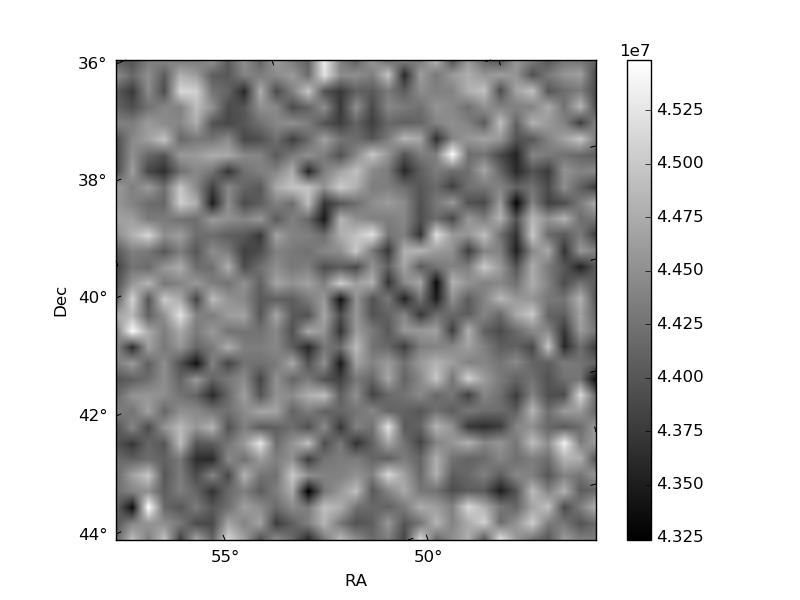
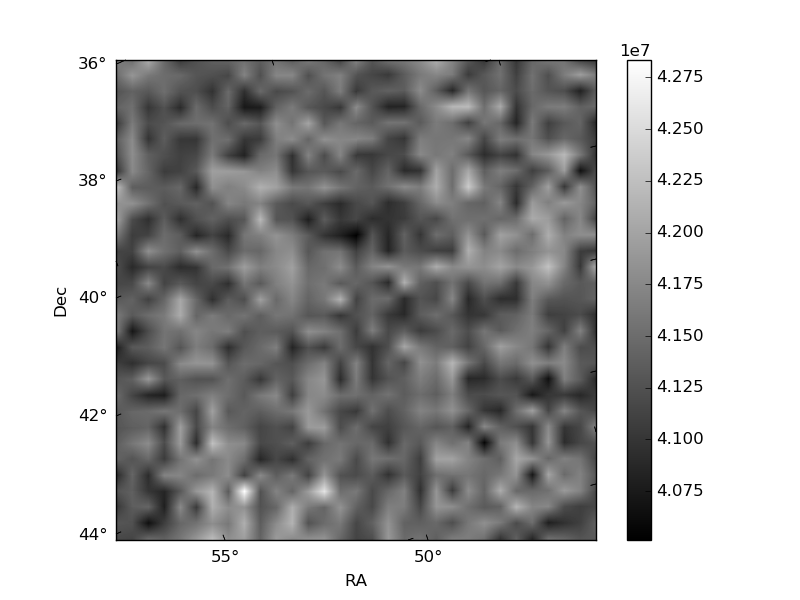
Histogram calculated using DETX and DETY for each event in the final _common_clean file
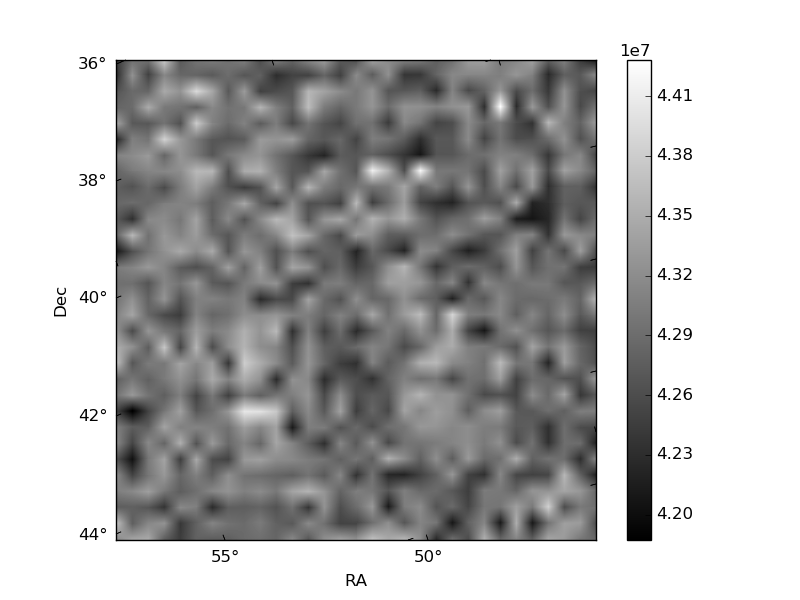
| Quadrant A | 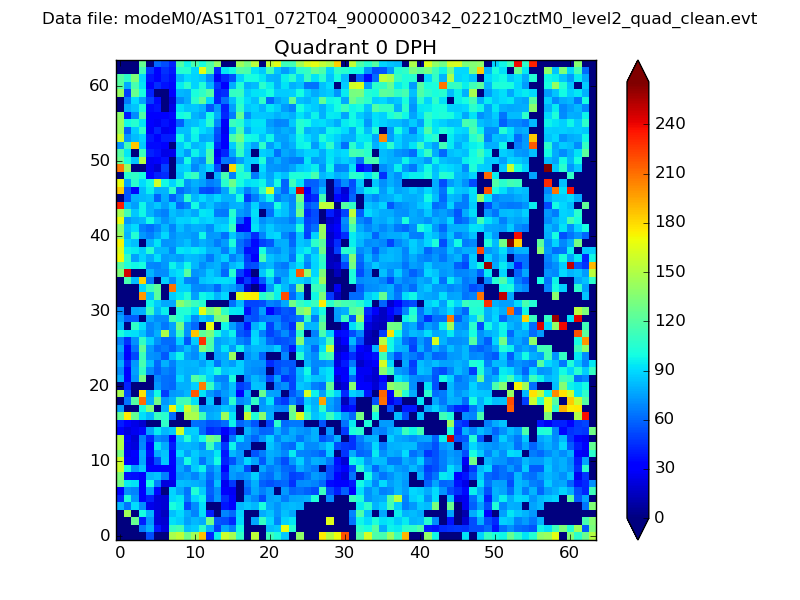 |
 |
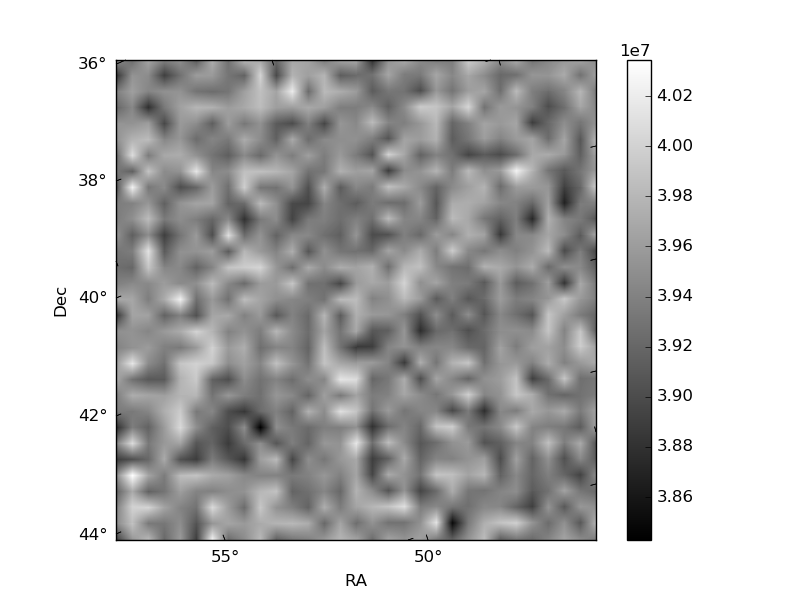
Quadrant B |
|---|---|---|---|
| Quadrant D | 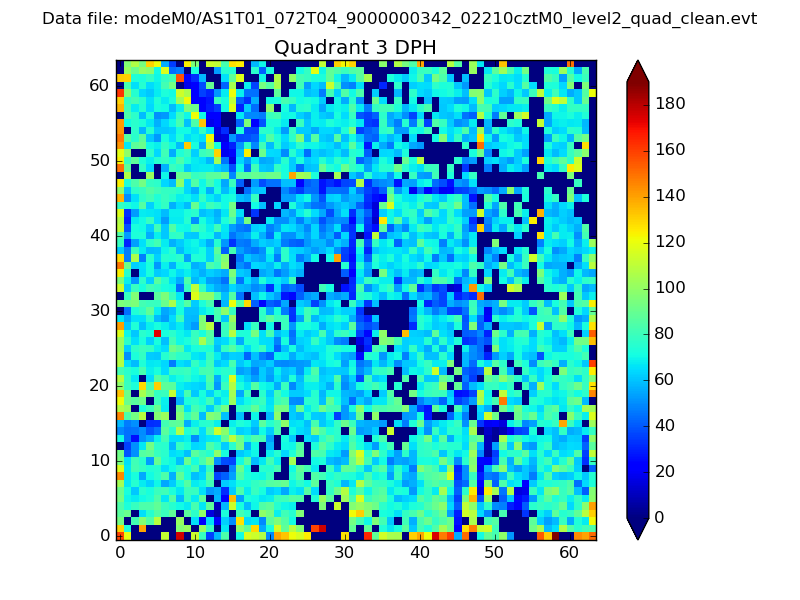 |
 |
Quadrant C |
| Plot type | Count rate plots | Images |
|---|---|---|
| Comparison with Poisson distribution Blue bars denote a histogram of data divided into 1 sec bins. Red curve is a Poisson curve with rate = median count rate of data. |
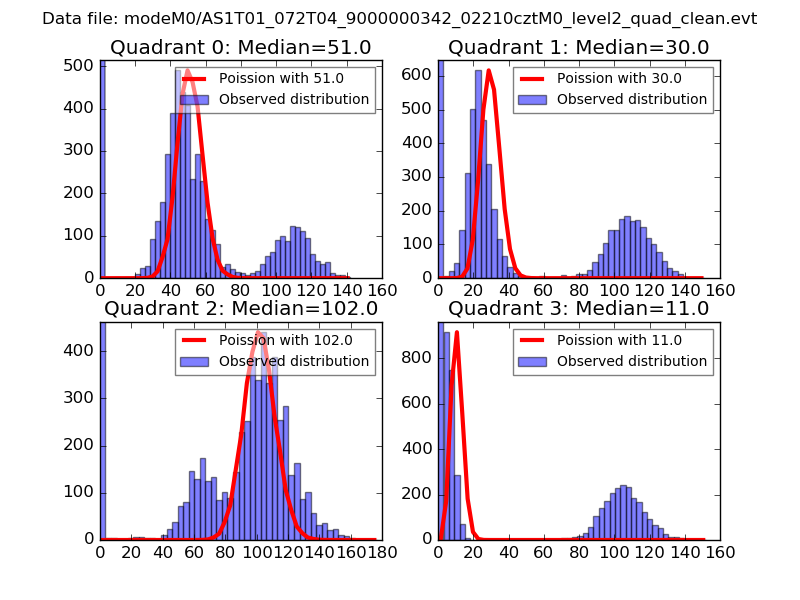 |
 |
| Quadrant-wise count rates Data is divided into 100 sec bins |
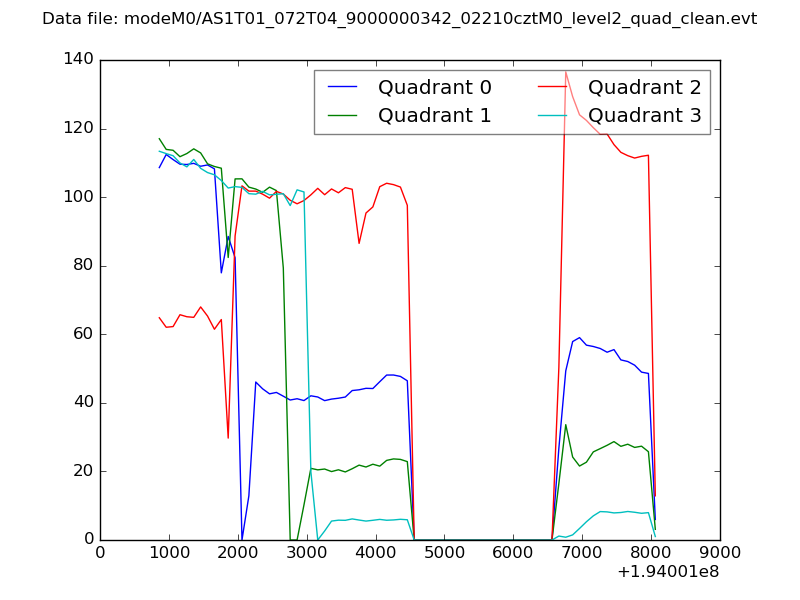 |
|
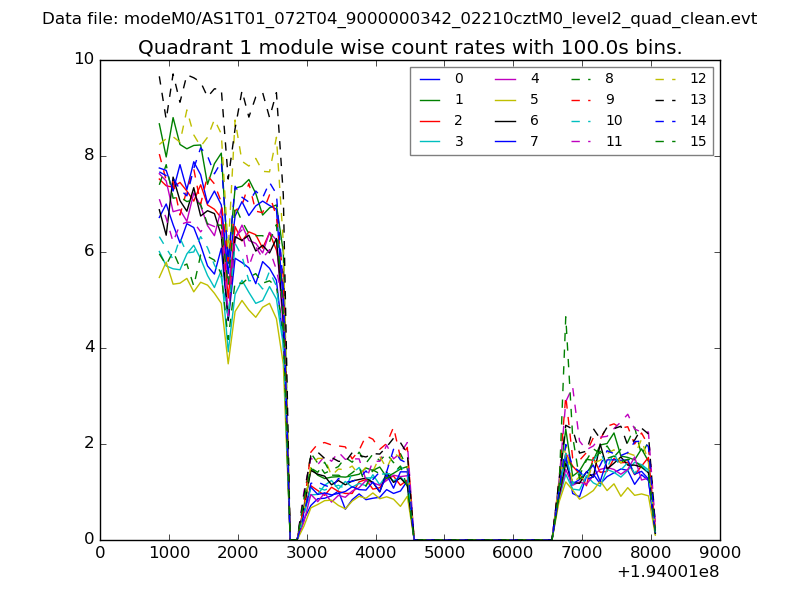
| Module-wise count rates for Quadrant A Data is divided into 100 sec bins |
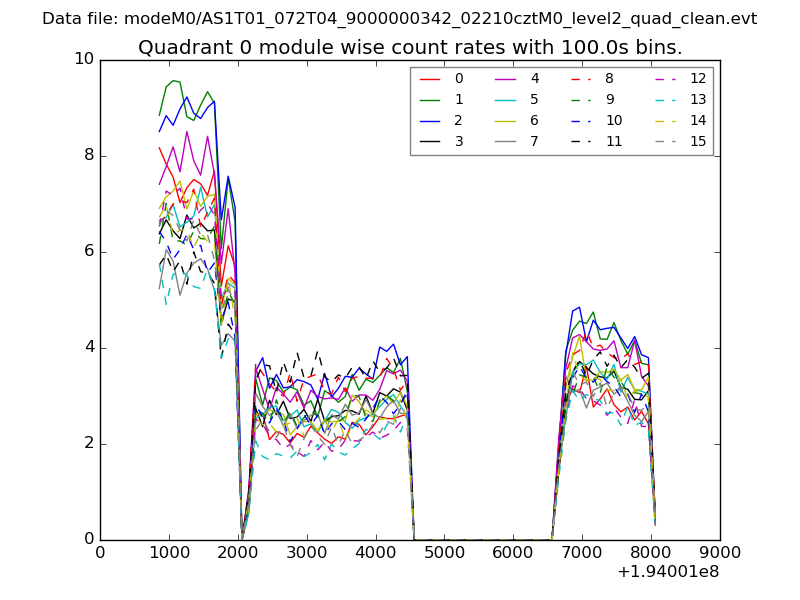 |
 |
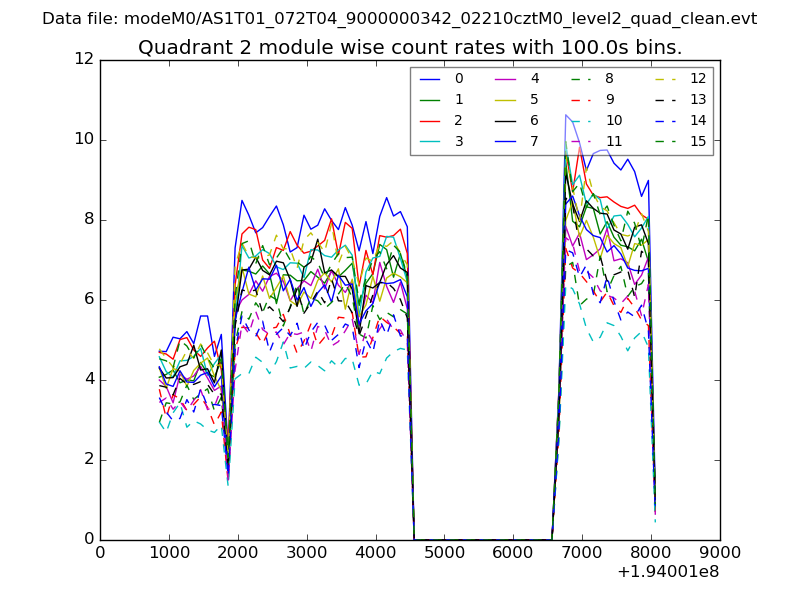
| Module-wise count rates for Quadrant B Data is divided into 100 sec bins |
 |
 |
| Module-wise count rates for Quadrant C Data is divided into 100 sec bins |
 |
 |
| Module-wise count rates for Quadrant D Data is divided into 100 sec bins |
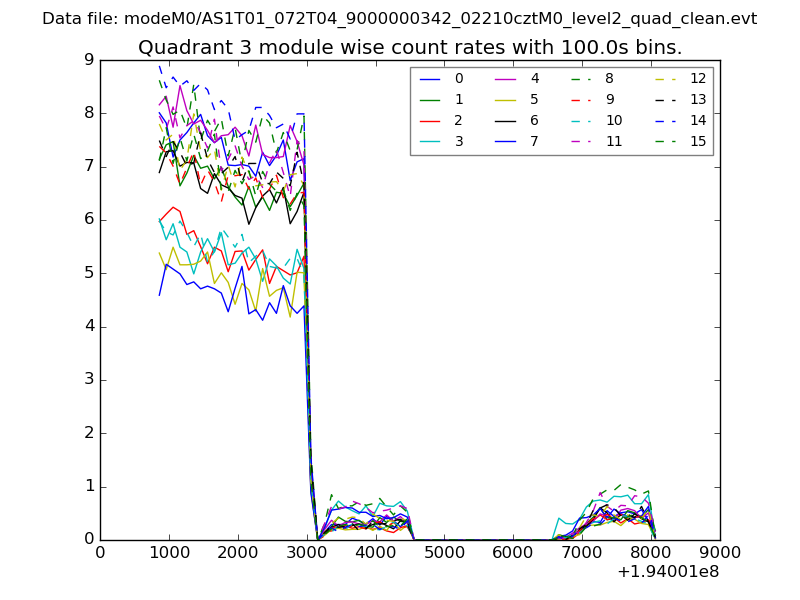 |
 |
| Parameter | Plot |
|---|---|
| CZT HV Monitor | 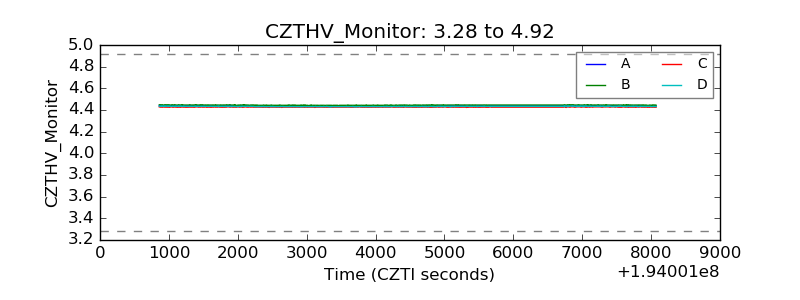 |
| D_VDD | 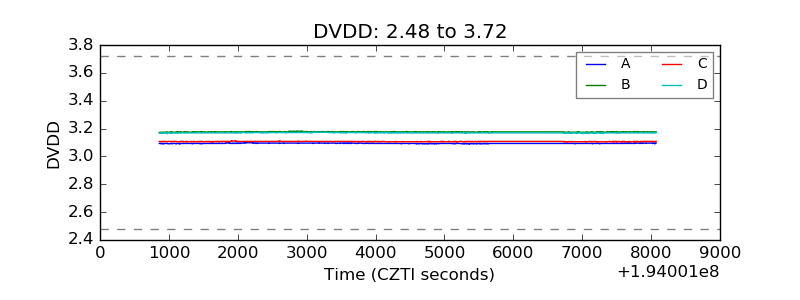 |
| Temperature 1 | 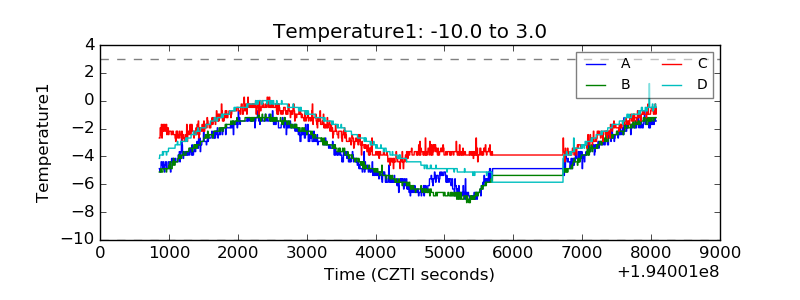 |
| Veto HV Monitor | 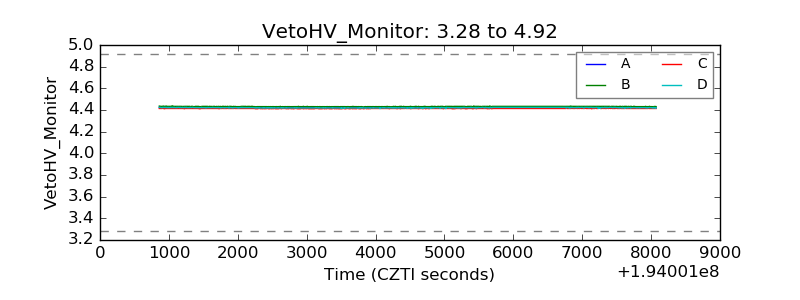 |
| Veto LLD | 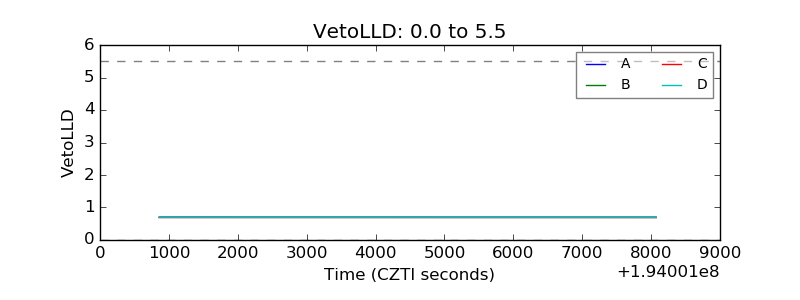 |
| Alpha Counter | 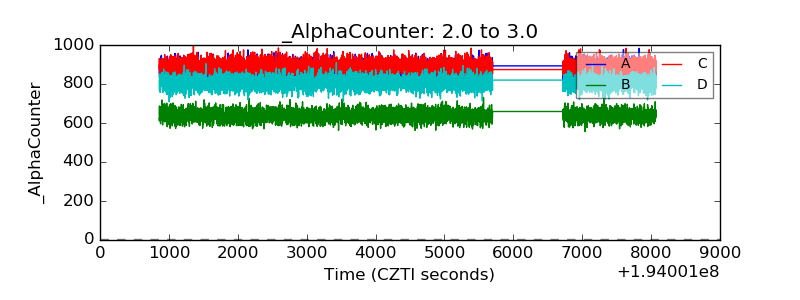 |
| _CPM_Rate | 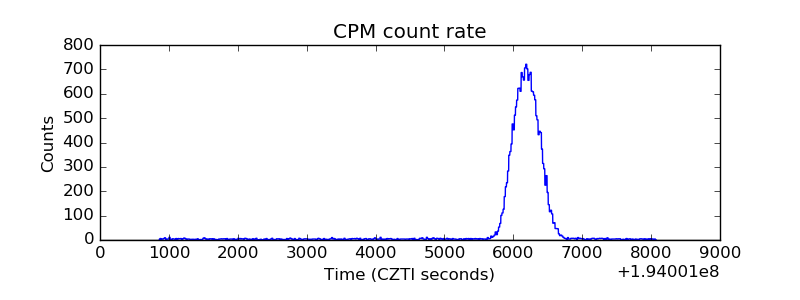 |
| CZT Counter | 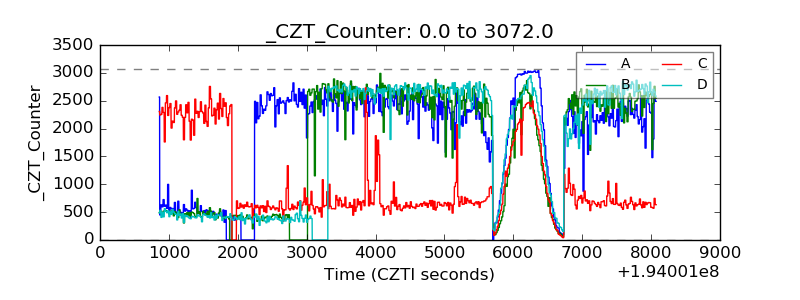 |
| +2.5 Volts monitor | 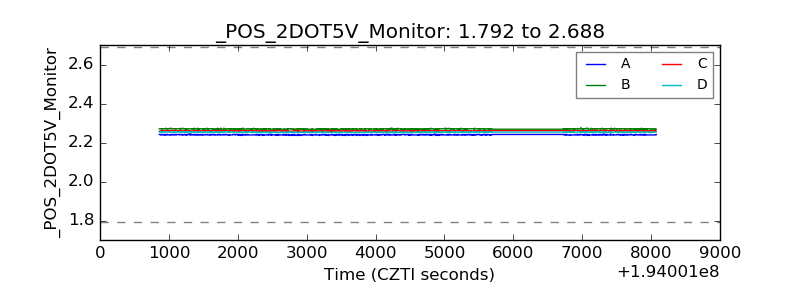 |
| +5 Volts monitor | 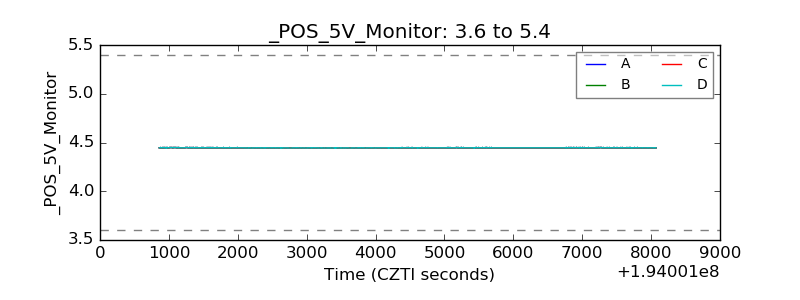 |
| _ROLL_ROT | 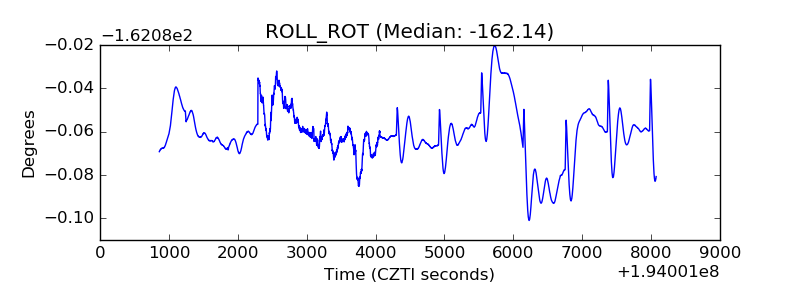 |
| _Roll_DEC | 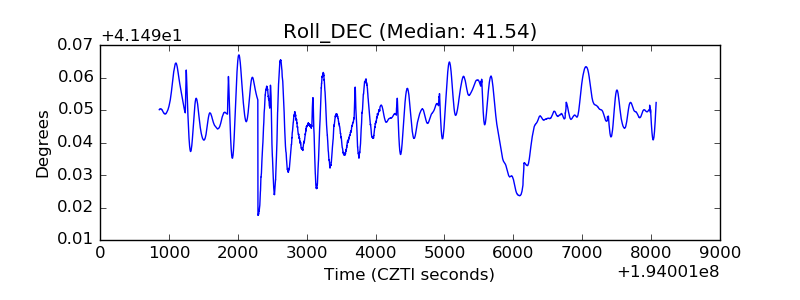 |
| _Roll_RA | 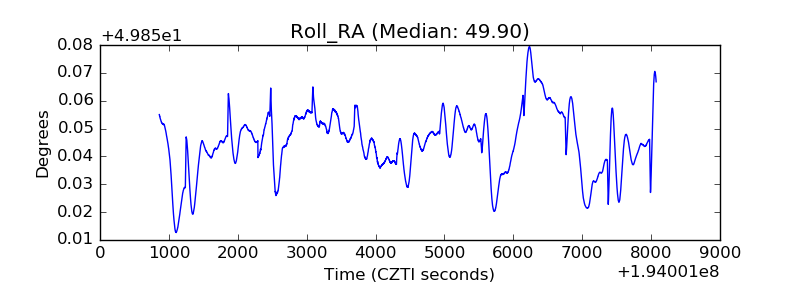 |
| Veto Counter | 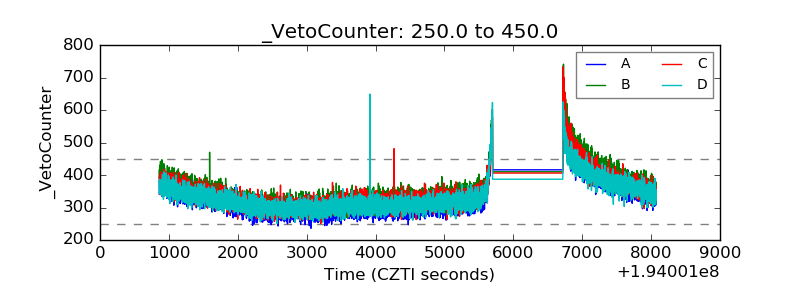 |