| Param | Original file | Final file |
|---|---|---|
| Filename | modeM0/AS1T01_072T04_9000000342_02213cztM0_level2.evt | modeM0/AS1T01_072T04_9000000342_02213cztM0_level2_quad_clean.evt |
| Size (bytes) | 1,090,301,760 | 54,432,000 |
| Size | 1.0 GB | 51.9 MB |
| Events in quadrant A | 4,410,960 | 451,067 |
| Events in quadrant B | 5,330,313 | 413,817 |
| Events in quadrant C | 6,504,120 | 331,385 |
| Events in quadrant D | 16,365,417 | 23,004 |
| Mode M0 | |||
|---|---|---|---|
| Quadrant | BADHDUFLAG | Total packets | Discarded packets |
| A | 0 | 17829 | 20 |
| B | 0 | 20130 | 7 |
| C | 0 | 24162 | 7 |
| D | 0 | 53274 | 1 |
| Mode SS | |||
|---|---|---|---|
| Quadrant | BADHDUFLAG | Total packets | Discarded packets |
| A | 0 | 122 | 0 |
| B | 0 | 122 | 0 |
| C | 0 | 122 | 0 |
| D | 0 | 122 | 0 |
| Mode M9 | |||
|---|---|---|---|
| Quadrant | BADHDUFLAG | Total packets | Discarded packets |
| A | 0 | 1 | 0 |
| B | 1 | 1 | 0 |
| C | 1 | -1 | -1 |
| D | 1 | -1 | -1 |
| Quadrant | Total seconds | Saturated seconds | Saturation percentage |
|---|---|---|---|
| A | 6021 | 1060 | 17.605049% |
| B | 6027 | 1297 | 21.519827% |
| C | 6089 | 1498 | 24.601741% |
| D | 6220 | 6220 | 100.000000% |
Noise dominated data is calculated using 1-second bins in cleaned event files. If a bin has >2000 counts, and if more than 50% of those come from <1% of pixels, then it is considered to be noise-dominated and hence unusable.
| Quadrant | # 1 sec bins | Bins with >0 counts | Bins with >2000 counts | High rate bins dominated by noise | Noise dominated (total time) | Noise dominated (detector-on time) | Marked lightcurve |
|---|---|---|---|---|---|---|---|
| A | 7381 | 6024 | 893 | 893 | 12.10% | 14.82% | 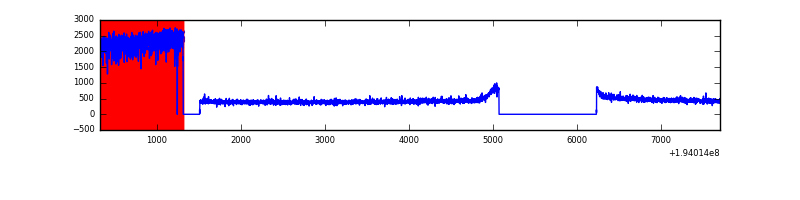 |
| B | 7381 | 6028 | 1194 | 1194 | 16.18% | 19.81% | 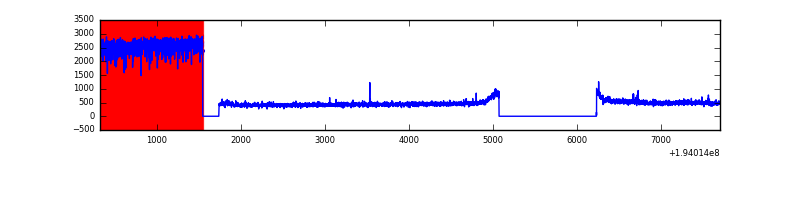 |
| C | 7250 | 6090 | 1279 | 1279 | 17.64% | 21.00% | 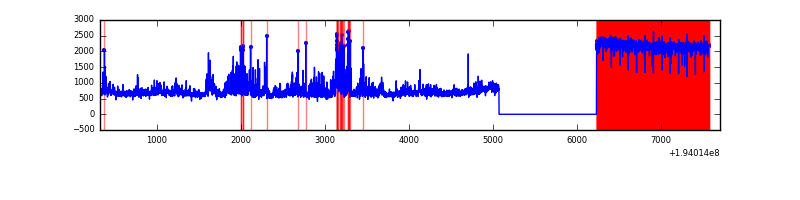 |
| D | 7381 | 6221 | 6021 | 6021 | 81.57% | 96.79% | 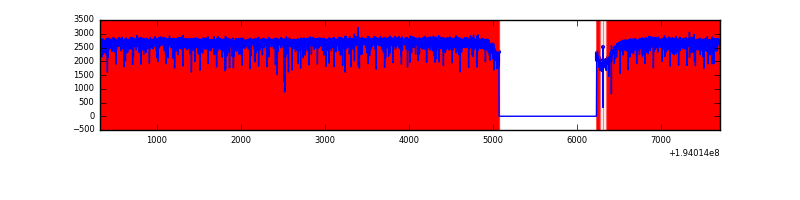 |
Top three noisy pixels from each quadrant. If the there are fewer than three noisy pixels in the level2.evt file, extra rows are filled as -1
| Pixel properties | Quadrant properties | ||||||
|---|---|---|---|---|---|---|---|
| Quadrant | DetID | PixID | Counts | Sigma | Mean | Median | Sigma |
| A | 3 | 159 | 496776 | 2690.11 | 640 | 634 | 184.4 |
| A | 3 | 254 | 367994 | 1991.84 | 640 | 634 | 184.4 |
| A | 11 | 246 | 122260 | 659.46 | 640 | 634 | 184.4 |
| B | 3 | 191 | 2301856 | 16054.74 | 626 | 602 | 143.3 |
| B | 14 | 181 | 78124 | 540.83 | 626 | 602 | 143.3 |
| B | 15 | 26 | 51080 | 352.16 | 626 | 602 | 143.3 |
| C | 8 | 112 | 1022829 | 6250.67 | 565 | 559 | 163.5 |
| C | 8 | 128 | 883758 | 5400.32 | 565 | 559 | 163.5 |
| C | 8 | 144 | 723046 | 4417.65 | 565 | 559 | 163.5 |
| D | 3 | 254 | 3566076 | 25435.26 | 107 | 82 | 140.2 |
| D | 3 | 184 | 1303797 | 9299.04 | 107 | 82 | 140.2 |
| D | 3 | 159 | 1244776 | 8878.06 | 107 | 82 | 140.2 |
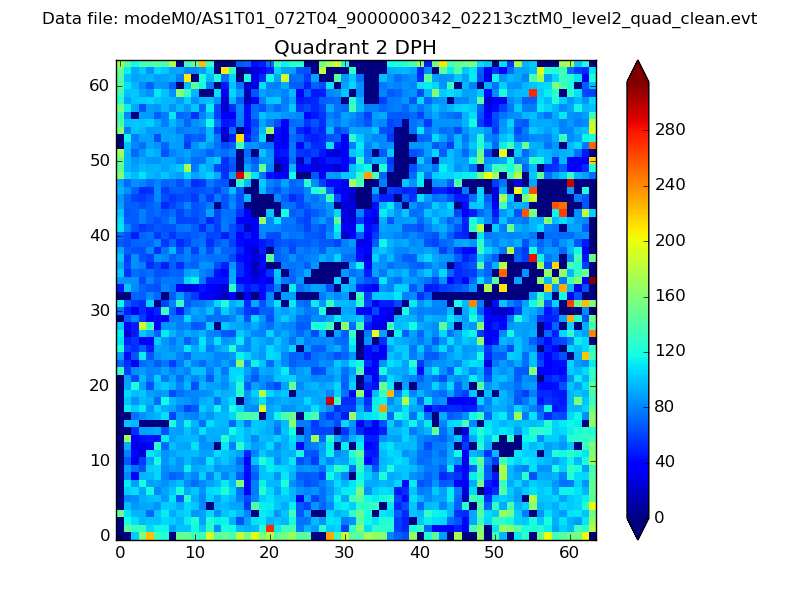
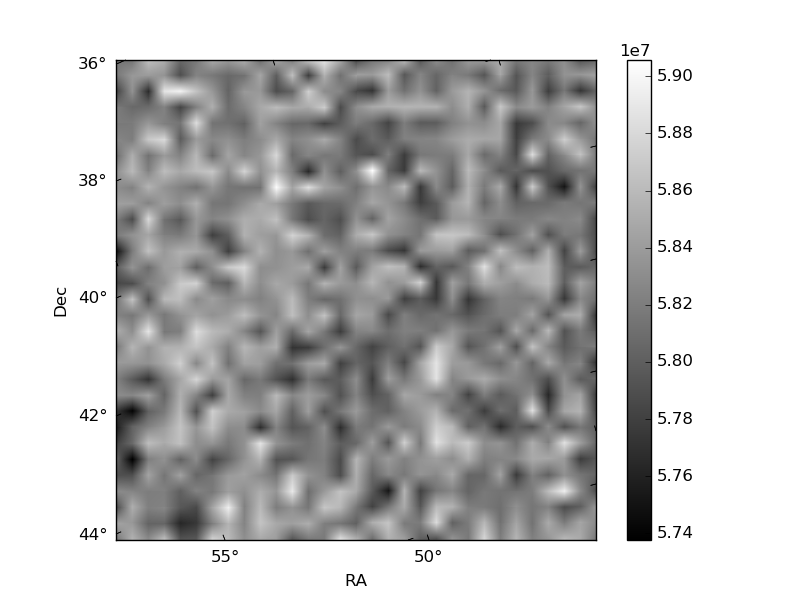
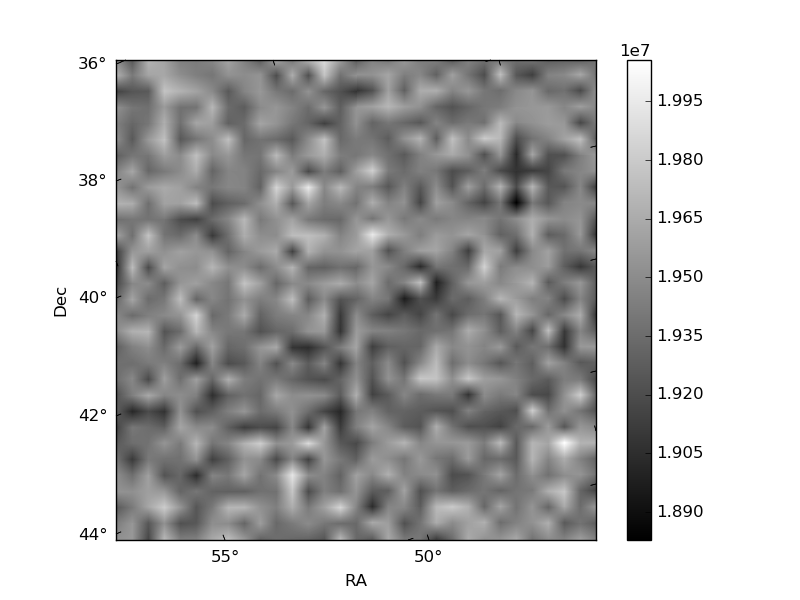
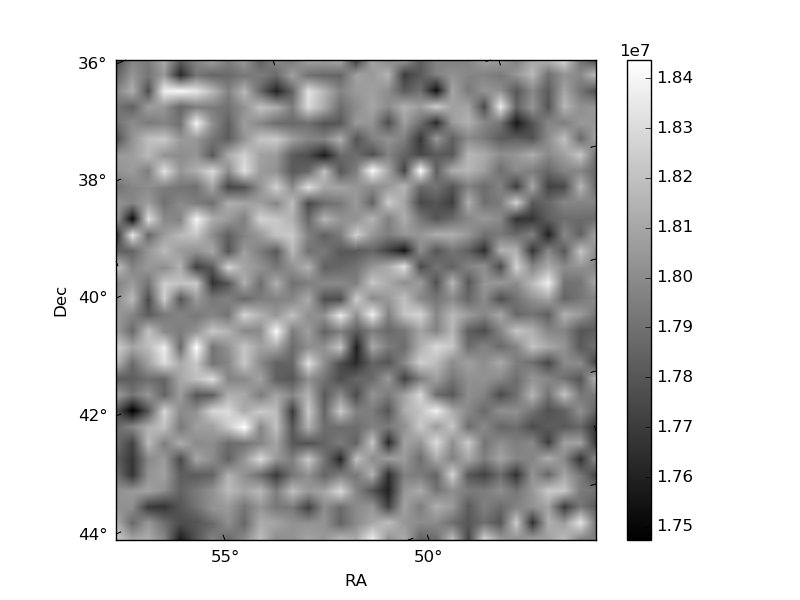
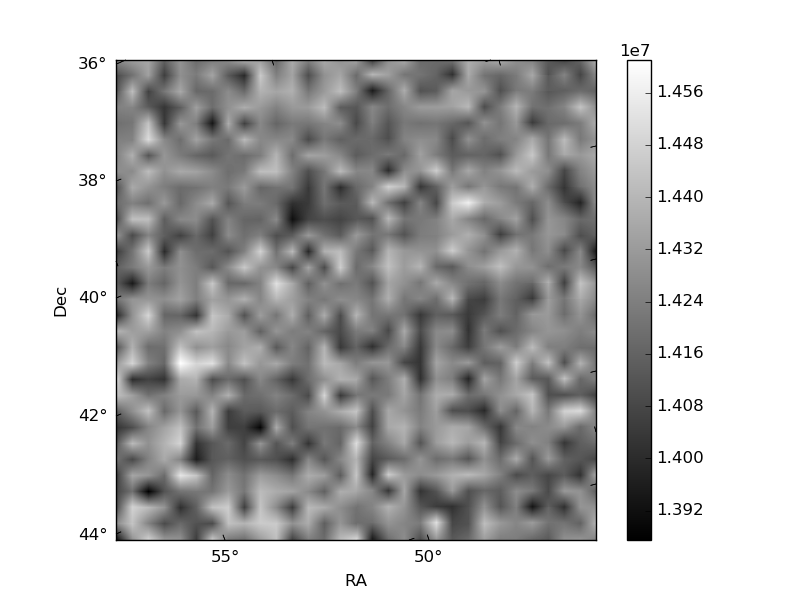
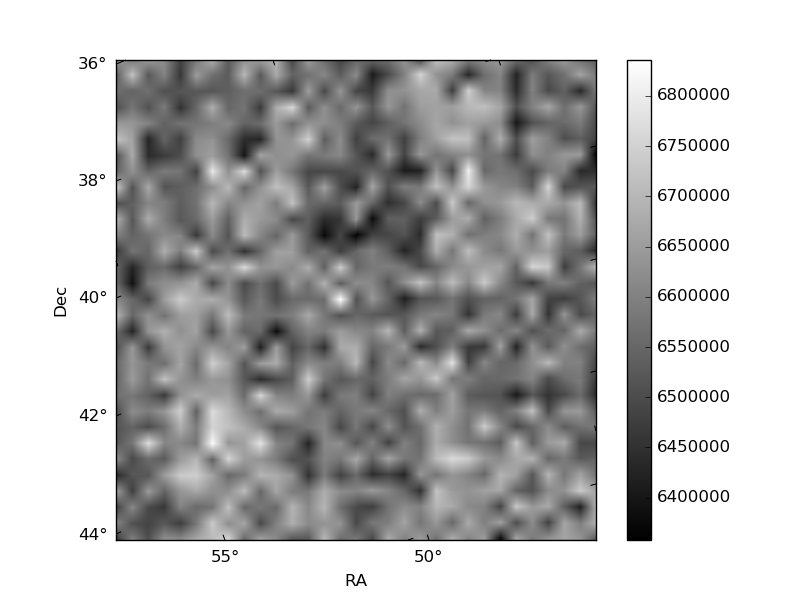
Histogram calculated using DETX and DETY for each event in the final _common_clean file
| Quadrant A | 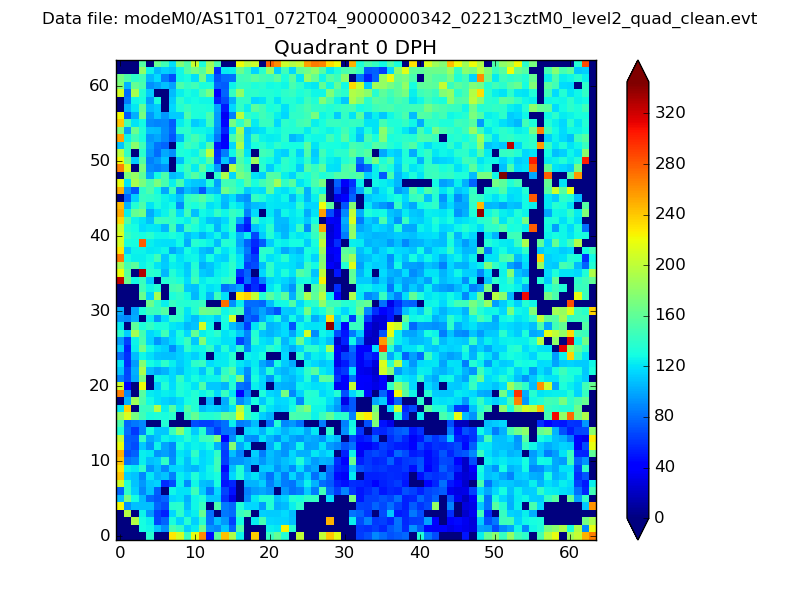 |
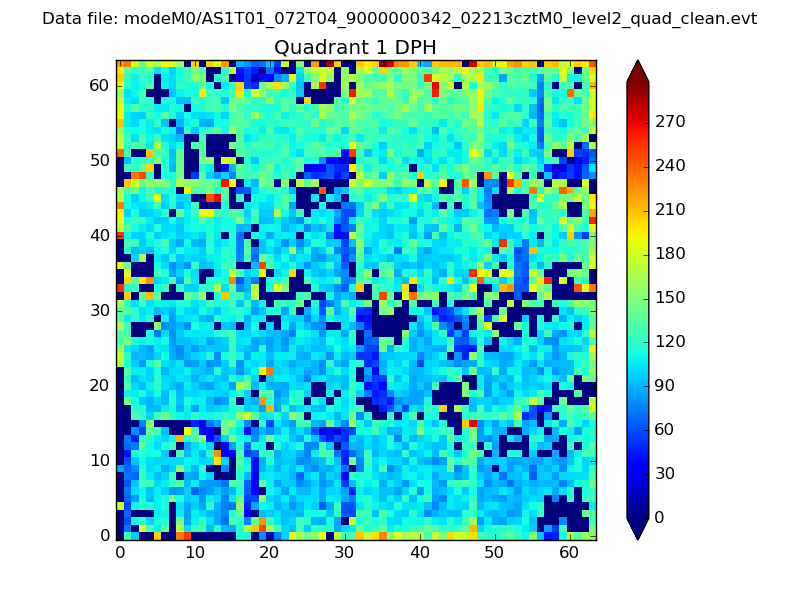 |
Quadrant B |
|---|---|---|---|
| Quadrant D | 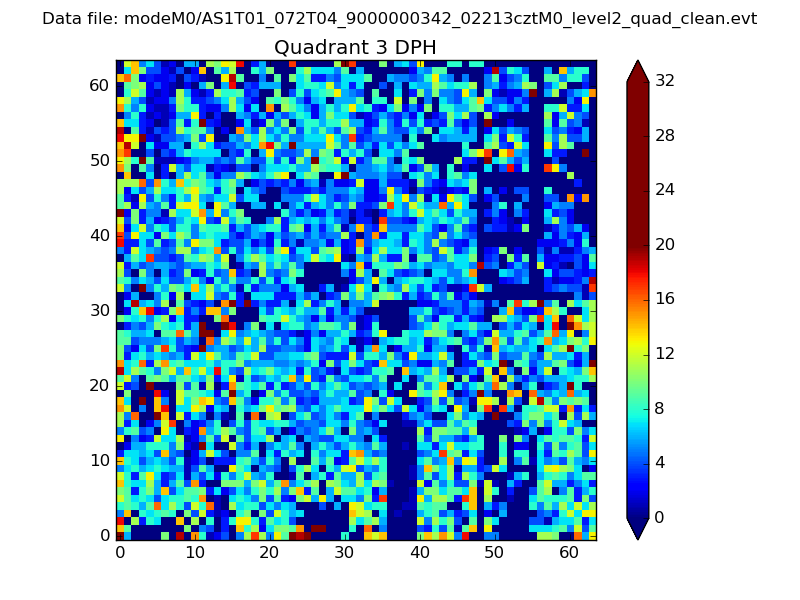 |
 |
Quadrant C |
| Plot type | Count rate plots | Images |
|---|---|---|
| Comparison with Poisson distribution Blue bars denote a histogram of data divided into 1 sec bins. Red curve is a Poisson curve with rate = median count rate of data. |
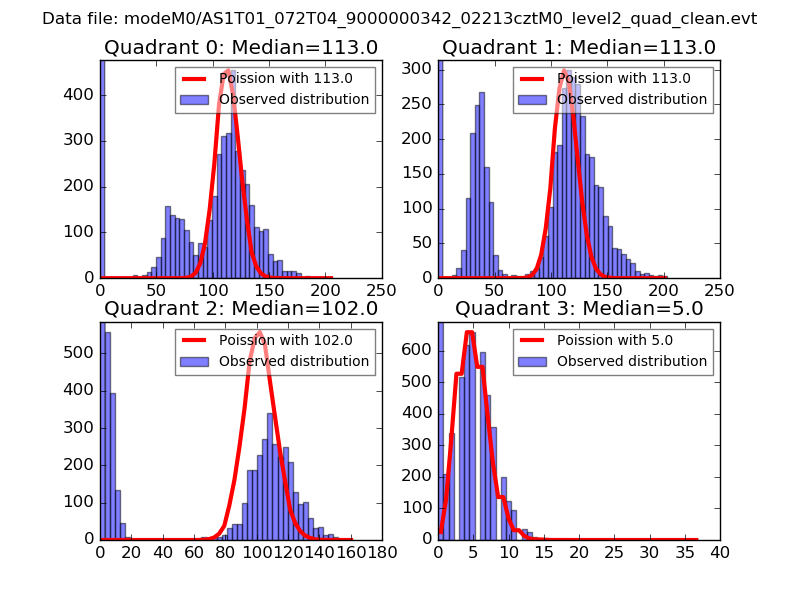 |
 |
| Quadrant-wise count rates Data is divided into 100 sec bins |
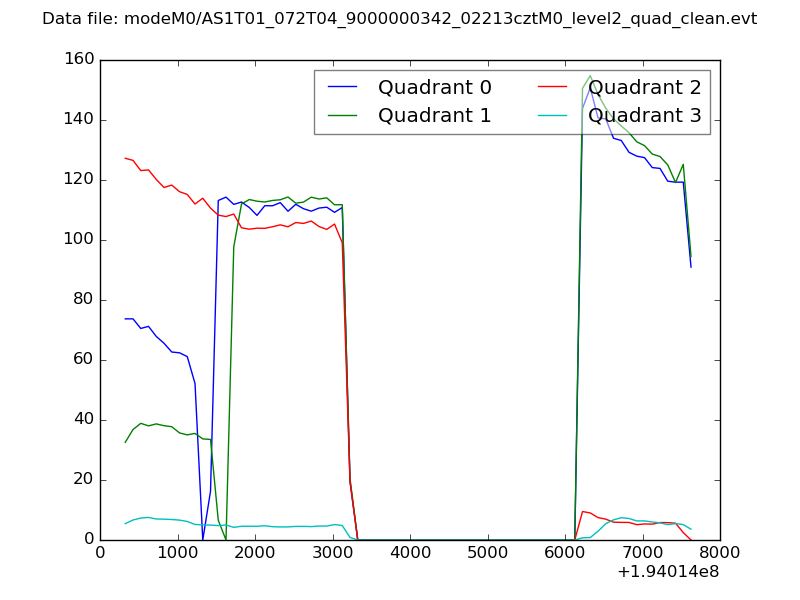 |
|
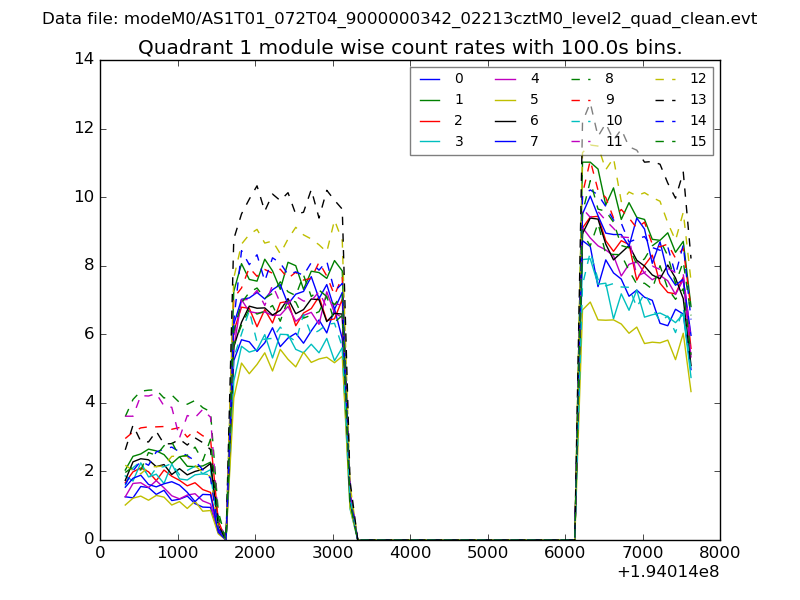
| Module-wise count rates for Quadrant A Data is divided into 100 sec bins |
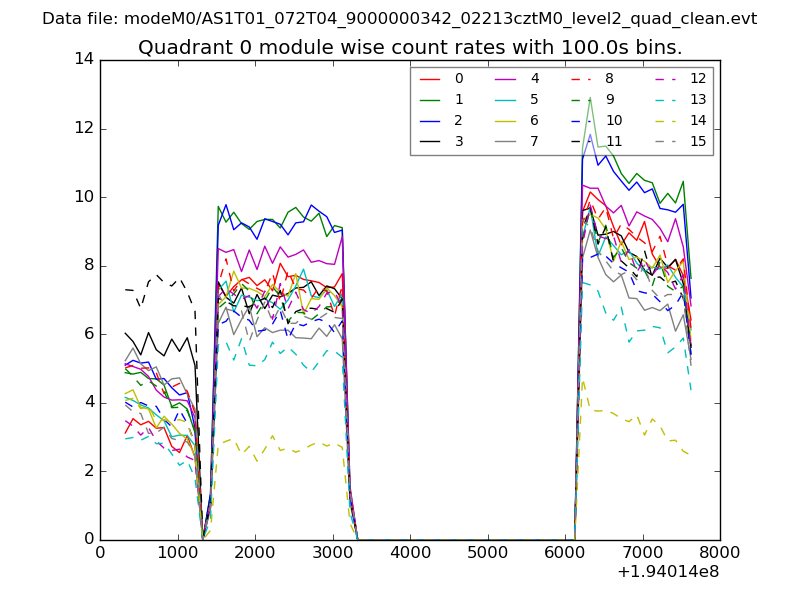 |
 |
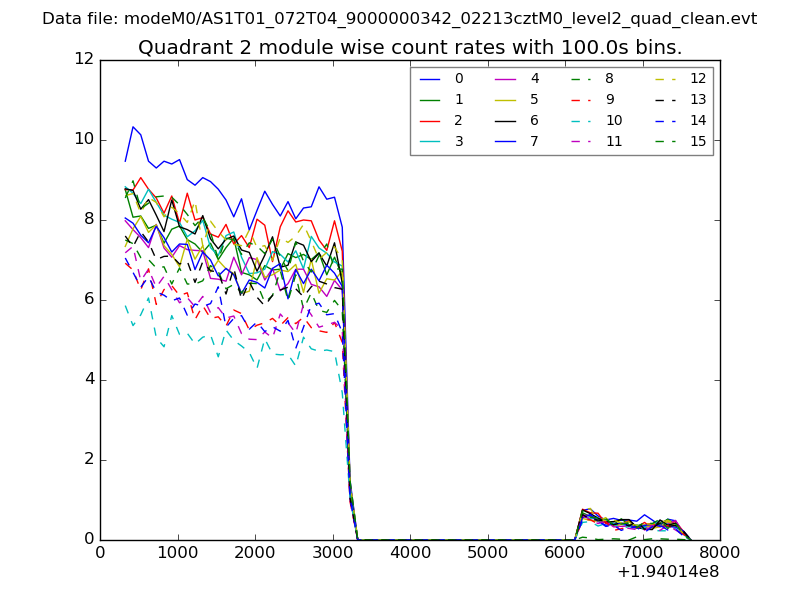
| Module-wise count rates for Quadrant B Data is divided into 100 sec bins |
 |
 |
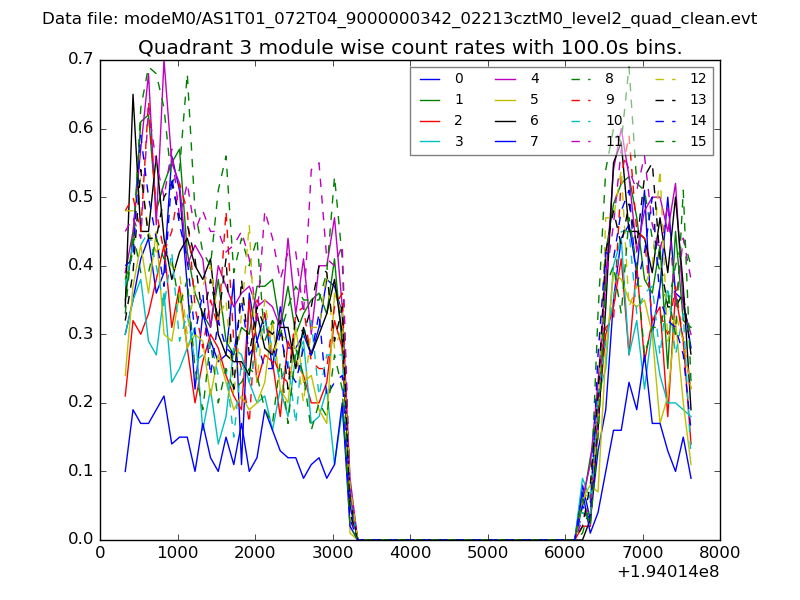
| Module-wise count rates for Quadrant C Data is divided into 100 sec bins |
 |
 |
| Module-wise count rates for Quadrant D Data is divided into 100 sec bins |
 |
 |
| Parameter | Plot |
|---|---|
| CZT HV Monitor | 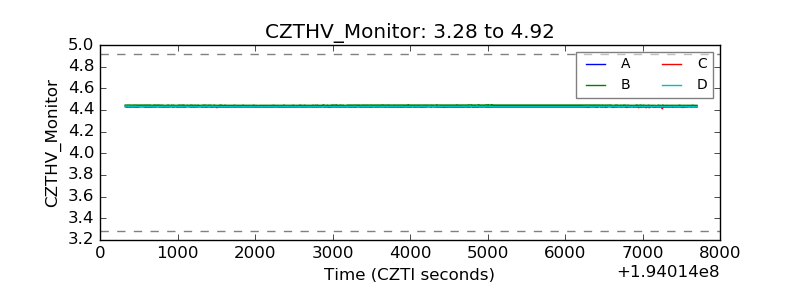 |
| D_VDD | 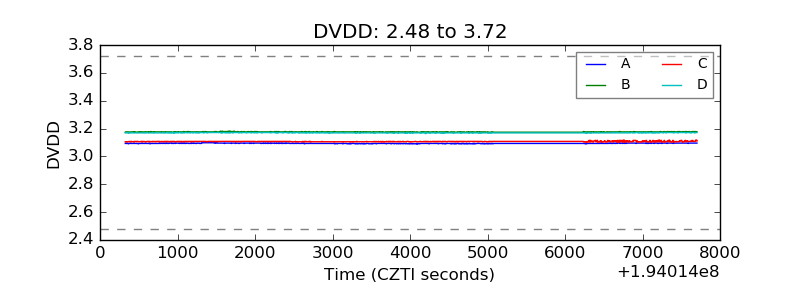 |
| Temperature 1 | 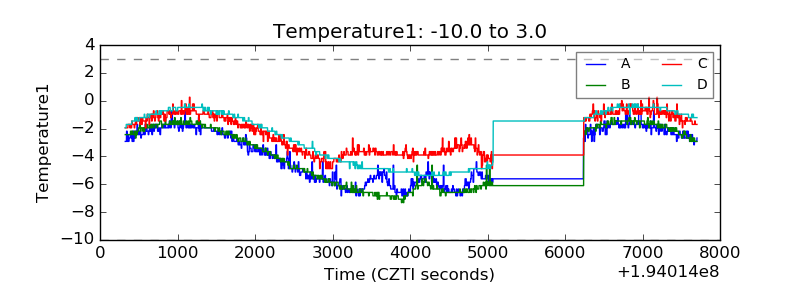 |
| Veto HV Monitor | 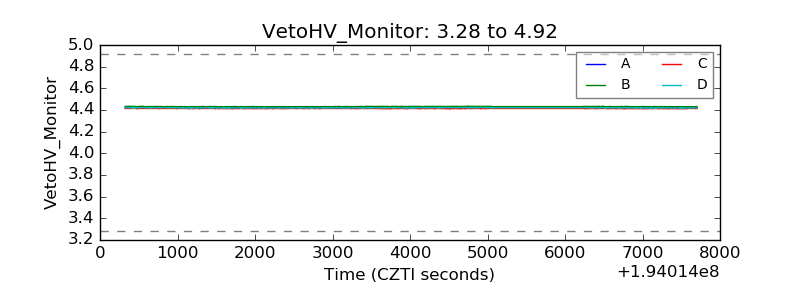 |
| Veto LLD | 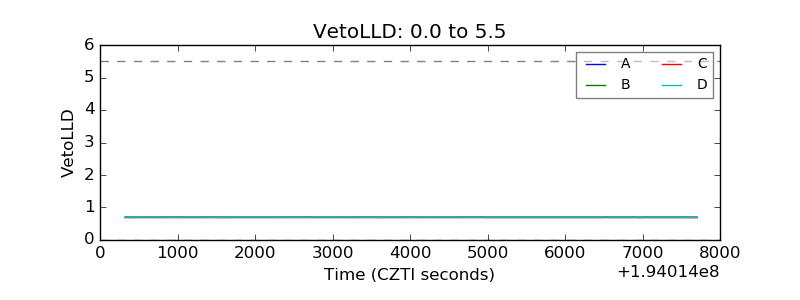 |
| Alpha Counter | 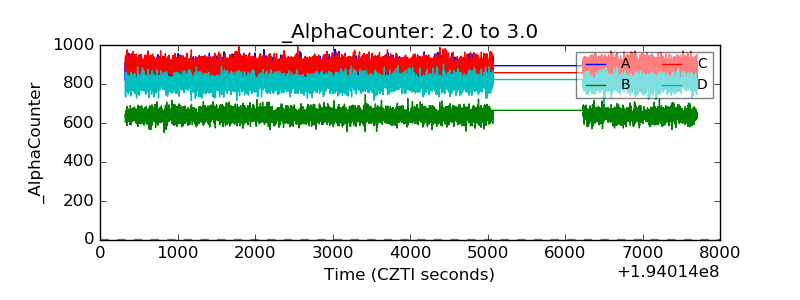 |
| _CPM_Rate | 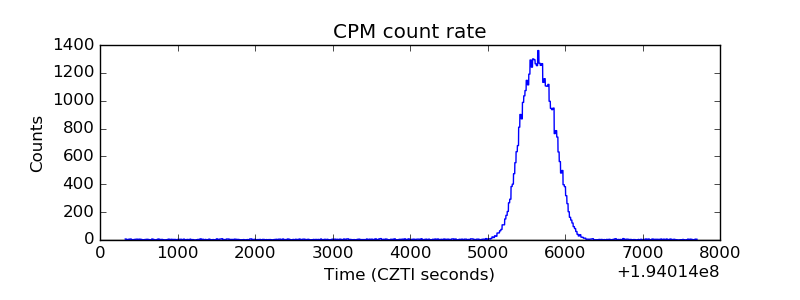 |
| CZT Counter | 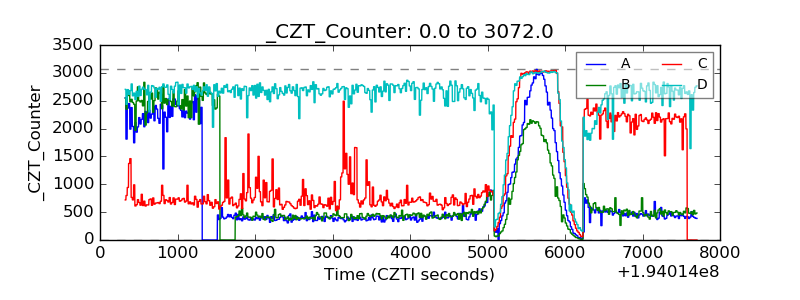 |
| +2.5 Volts monitor | 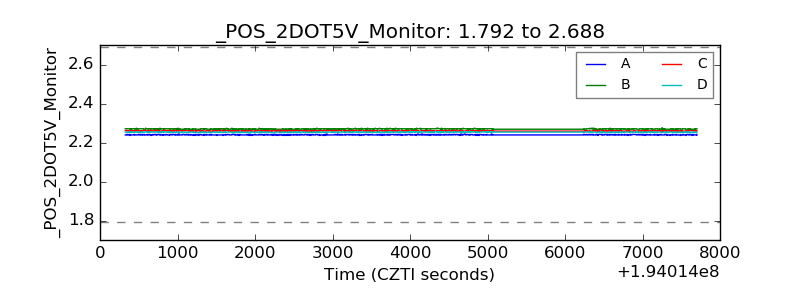 |
| +5 Volts monitor | 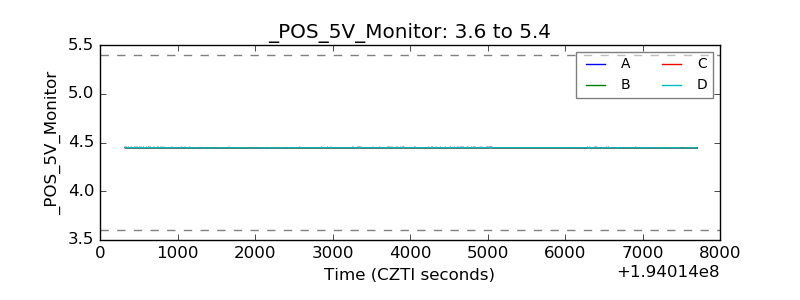 |
| _ROLL_ROT | 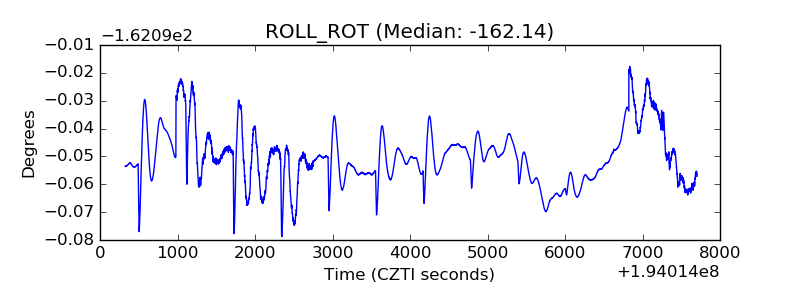 |
| _Roll_DEC | 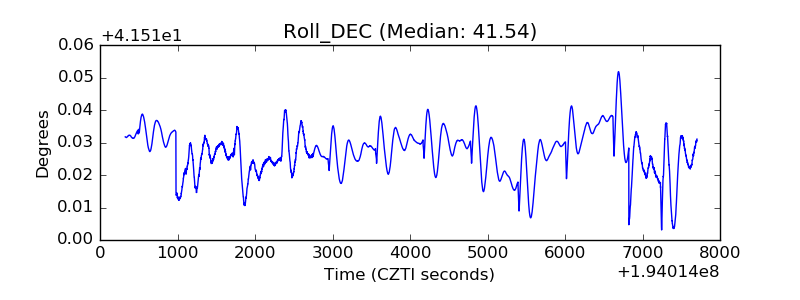 |
| _Roll_RA | 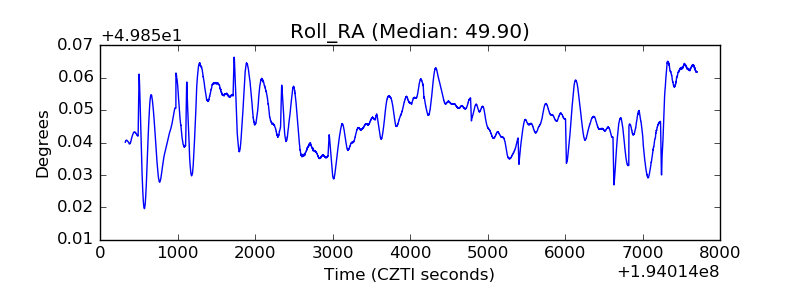 |
| Veto Counter | 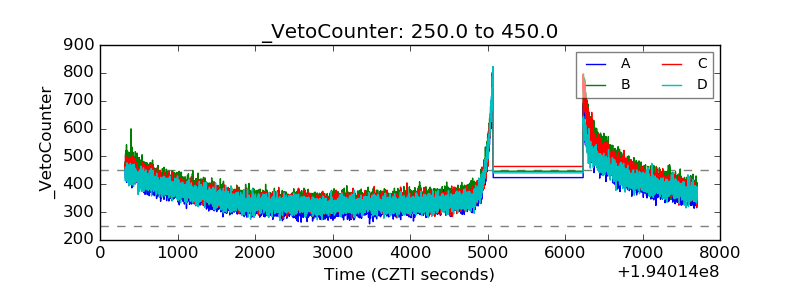 |