| Param | Original file | Final file |
|---|---|---|
| Filename | modeM0/AS1T01_072T04_9000000342_02214cztM0_level2.evt | modeM0/AS1T01_072T04_9000000342_02214cztM0_level2_quad_clean.evt |
| Size (bytes) | 458,435,520 | 49,320,000 |
| Size | 437.2 MB | 47.0 MB |
| Events in quadrant A | 2,159,908 | 372,300 |
| Events in quadrant B | 2,330,271 | 386,836 |
| Events in quadrant C | 4,058,989 | 209,454 |
| Events in quadrant D | 4,999,676 | 177,966 |
| Mode M0 | |||
|---|---|---|---|
| Quadrant | BADHDUFLAG | Total packets | Discarded packets |
| A | 0 | 10216 | 1 |
| B | 0 | 10335 | 1 |
| C | 0 | 15547 | 7 |
| D | 0 | 18761 | 9 |
| Mode SS | |||
|---|---|---|---|
| Quadrant | BADHDUFLAG | Total packets | Discarded packets |
| A | 0 | 102 | 0 |
| B | 0 | 102 | 0 |
| C | 0 | 102 | 0 |
| D | 0 | 102 | 0 |
| Mode M9 | |||
|---|---|---|---|
| Quadrant | BADHDUFLAG | Total packets | Discarded packets |
| A | 0 | 1 | 0 |
| B | 1 | 1 | 0 |
| C | 1 | -1 | -1 |
| D | 1 | -1 | -1 |
| Quadrant | Total seconds | Saturated seconds | Saturation percentage |
|---|---|---|---|
| A | 5004 | 51 | 1.019185% |
| B | 5004 | 46 | 0.919265% |
| C | 4820 | 1135 | 23.547718% |
| D | 4839 | 1358 | 28.063650% |
Noise dominated data is calculated using 1-second bins in cleaned event files. If a bin has >2000 counts, and if more than 50% of those come from <1% of pixels, then it is considered to be noise-dominated and hence unusable.
| Quadrant | # 1 sec bins | Bins with >0 counts | Bins with >2000 counts | High rate bins dominated by noise | Noise dominated (total time) | Noise dominated (detector-on time) | Marked lightcurve |
|---|---|---|---|---|---|---|---|
| A | 6234 | 5005 | 0 | 0 | 0.00% | 0.00% | 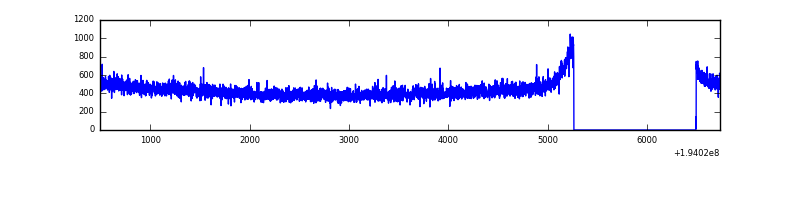 |
| B | 6234 | 5005 | 0 | 0 | 0.00% | 0.00% |  |
| C | 6234 | 4821 | 1000 | 1000 | 16.04% | 20.74% | 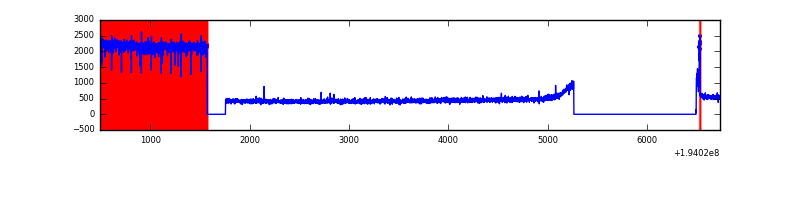 |
| D | 6234 | 4840 | 1296 | 1296 | 20.79% | 26.78% | 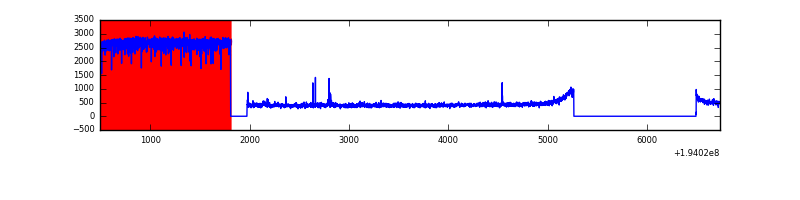 |
Top three noisy pixels from each quadrant. If the there are fewer than three noisy pixels in the level2.evt file, extra rows are filled as -1
| Pixel properties | Quadrant properties | ||||||
|---|---|---|---|---|---|---|---|
| Quadrant | DetID | PixID | Counts | Sigma | Mean | Median | Sigma |
| A | 12 | 194 | 6947 | 40.66 | 561 | 565 | 157.0 |
| A | 0 | 226 | 6240 | 36.16 | 561 | 565 | 157.0 |
| A | 3 | 1 | 5849 | 33.66 | 561 | 565 | 157.0 |
| B | 4 | 158 | 22217 | 190.55 | 593 | 577 | 113.6 |
| B | 4 | 200 | 13855 | 116.92 | 593 | 577 | 113.6 |
| B | 10 | 244 | 7332 | 59.48 | 593 | 577 | 113.6 |
| C | 8 | 112 | 856515 | 8043.68 | 438 | 438 | 106.4 |
| C | 8 | 128 | 701611 | 6588.2 | 438 | 438 | 106.4 |
| C | 8 | 144 | 565870 | 5312.78 | 438 | 438 | 106.4 |
| D | 3 | 254 | 736595 | 6497.98 | 420 | 406 | 113.3 |
| D | 3 | 184 | 272486 | 2401.52 | 420 | 406 | 113.3 |
| D | 3 | 159 | 256306 | 2258.7 | 420 | 406 | 113.3 |
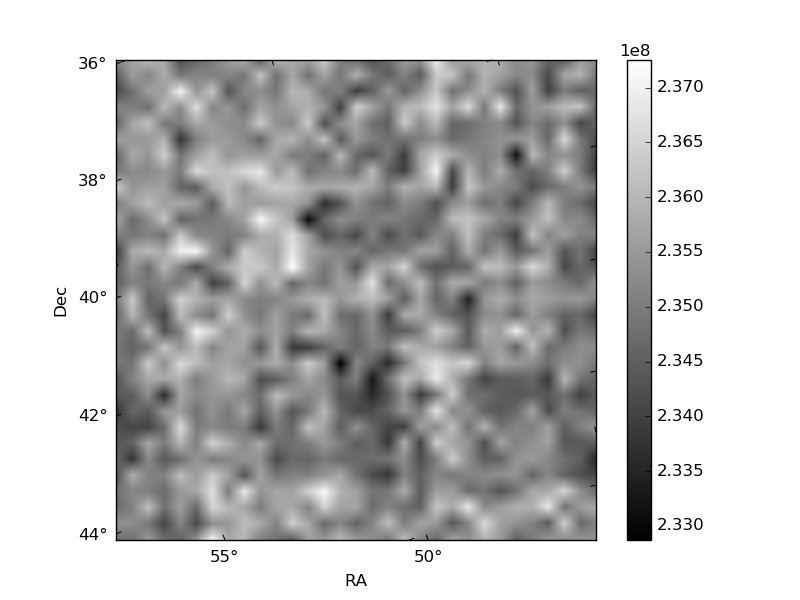
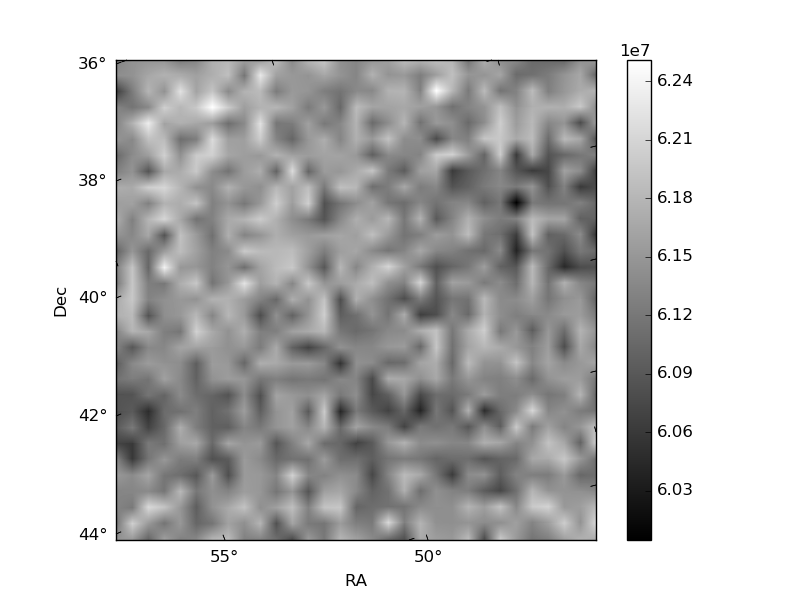
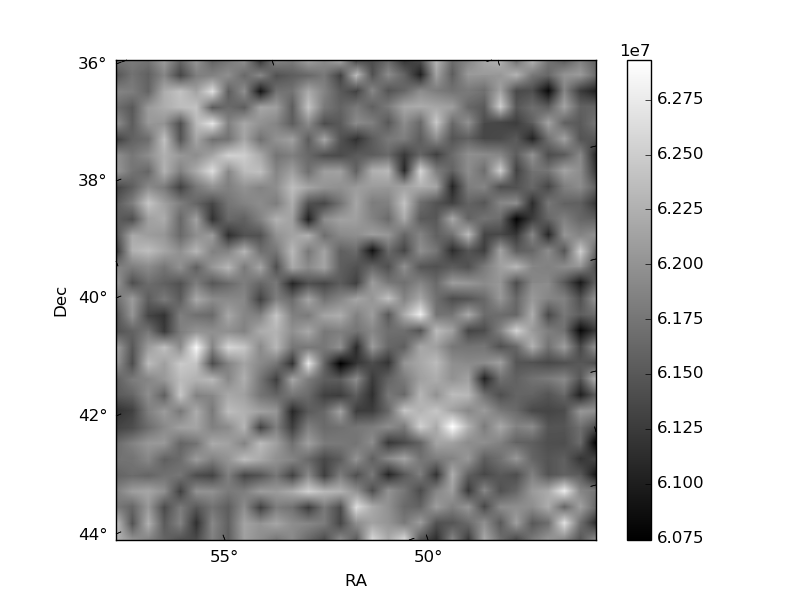
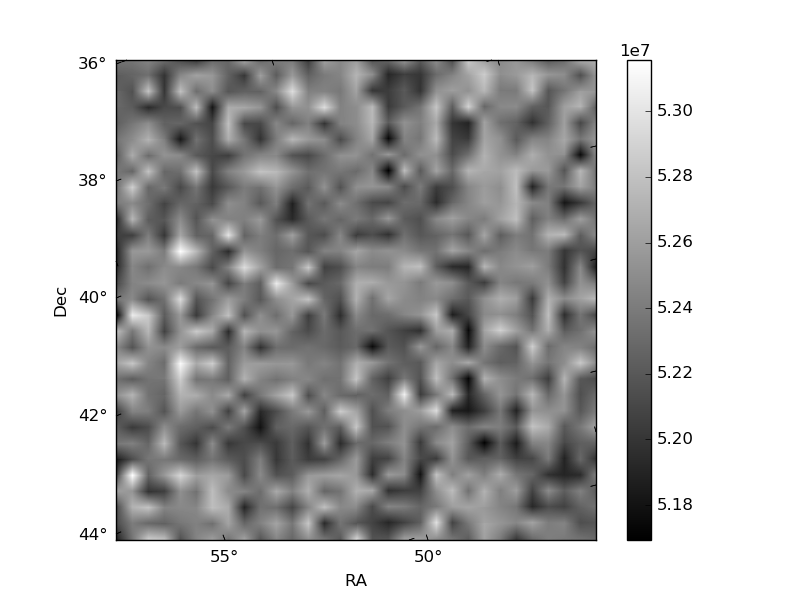
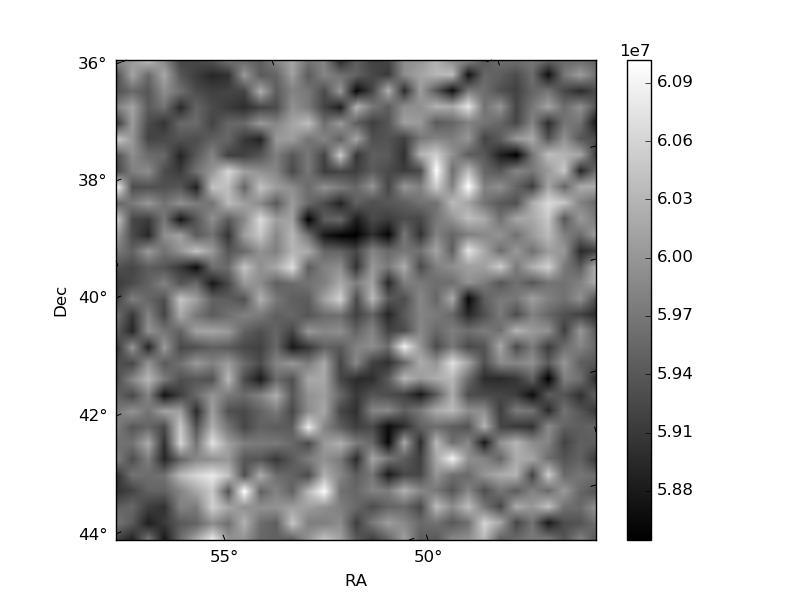
Histogram calculated using DETX and DETY for each event in the final _common_clean file
| Quadrant A | 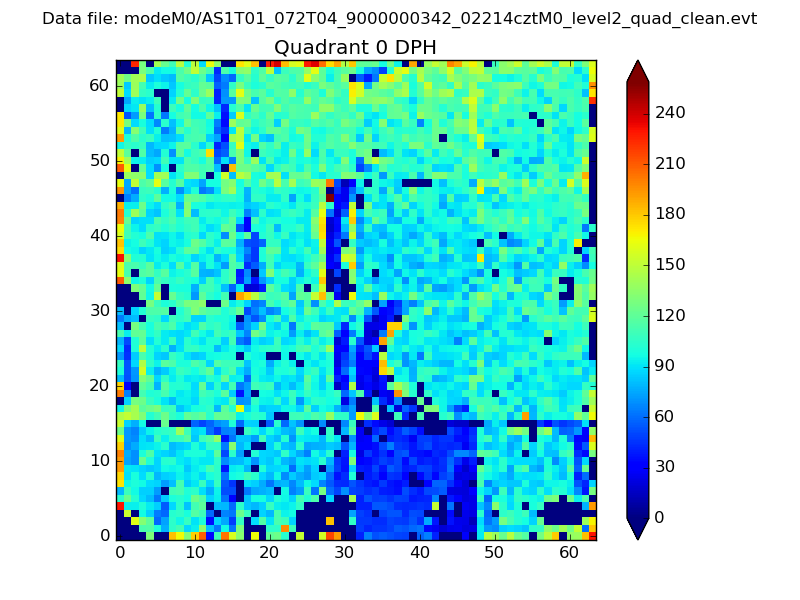 |
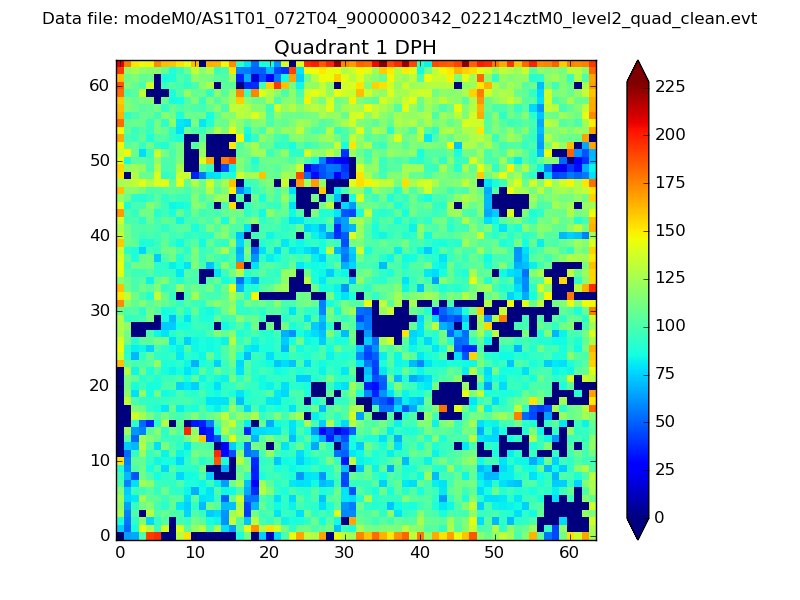 |
Quadrant B |
|---|---|---|---|
| Quadrant D | 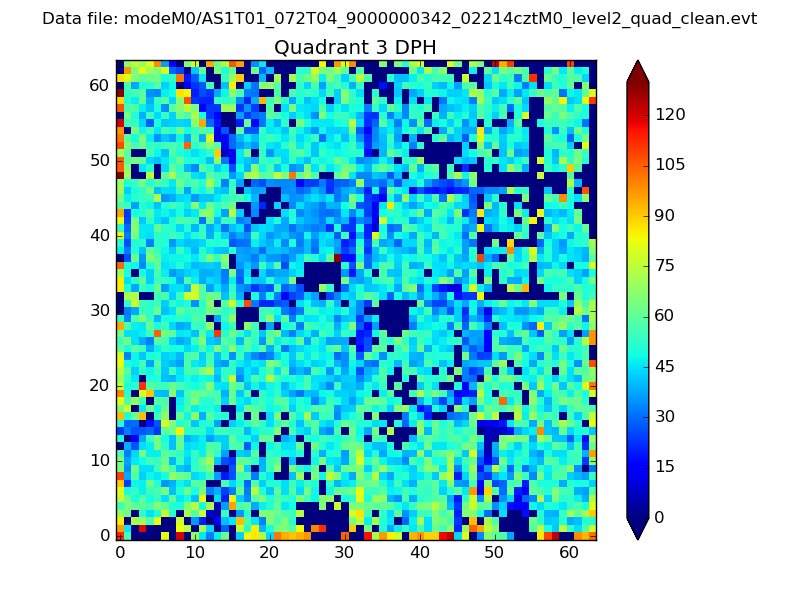 |
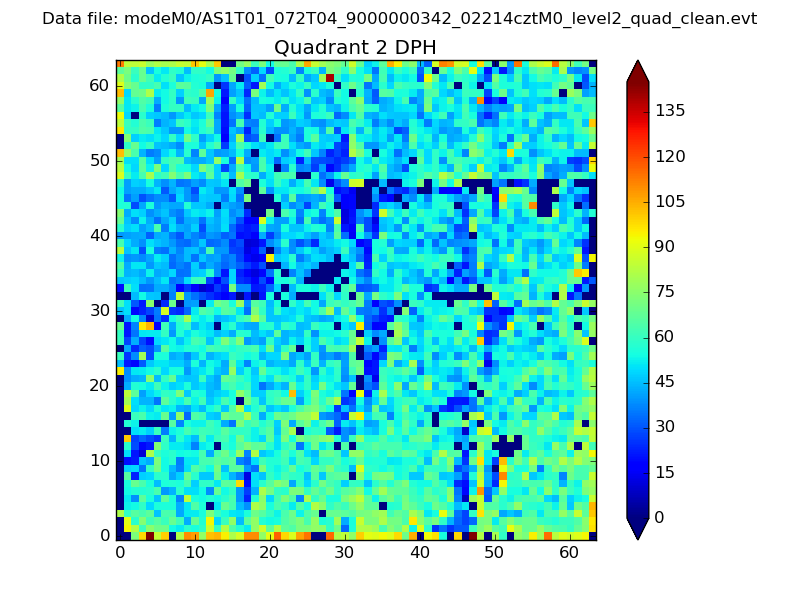 |
Quadrant C |
| Plot type | Count rate plots | Images |
|---|---|---|
| Comparison with Poisson distribution Blue bars denote a histogram of data divided into 1 sec bins. Red curve is a Poisson curve with rate = median count rate of data. |
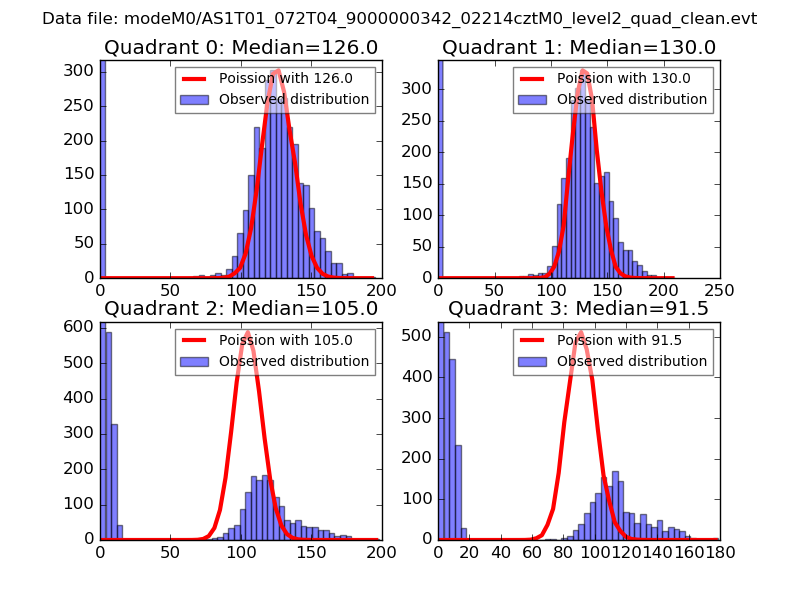 |
 |
| Quadrant-wise count rates Data is divided into 100 sec bins |
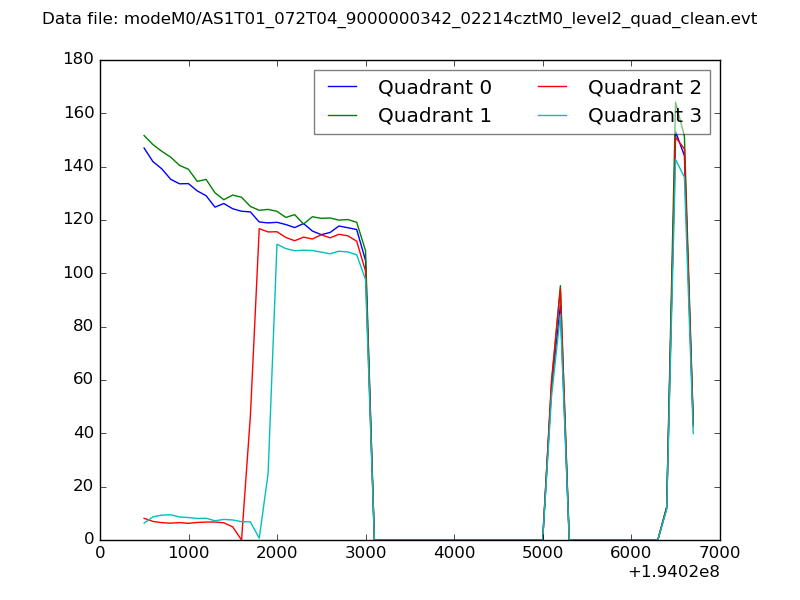 |
|
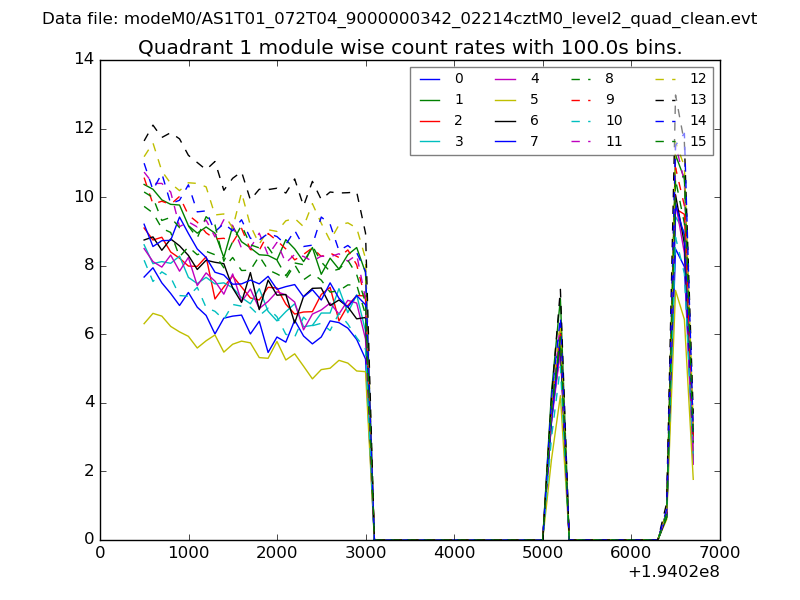
| Module-wise count rates for Quadrant A Data is divided into 100 sec bins |
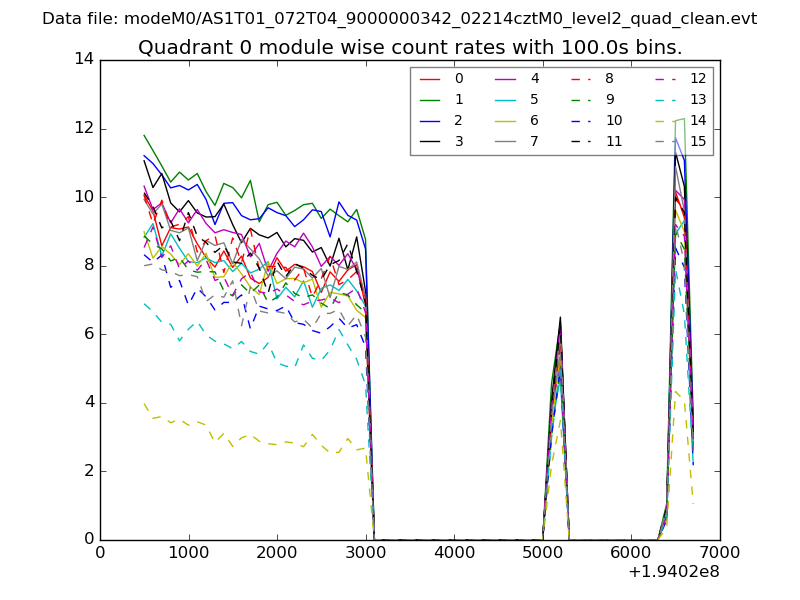 |
 |
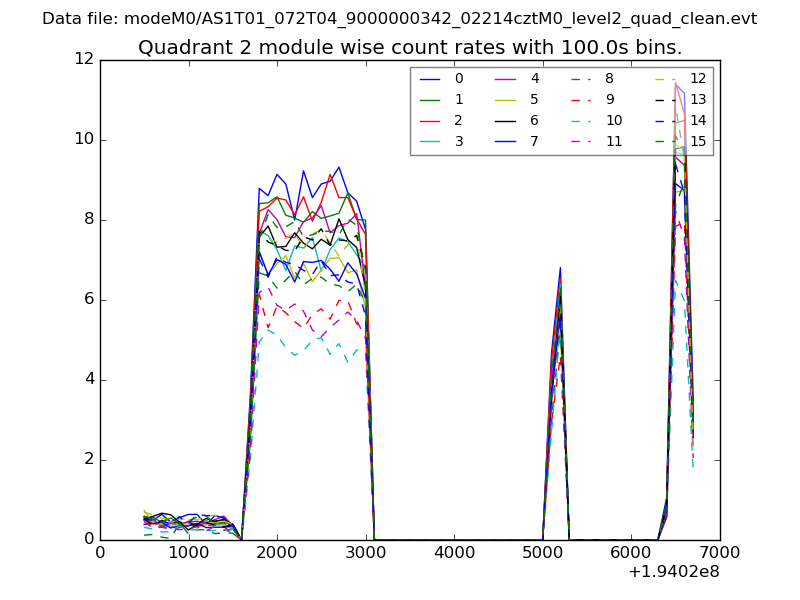
| Module-wise count rates for Quadrant B Data is divided into 100 sec bins |
 |
 |
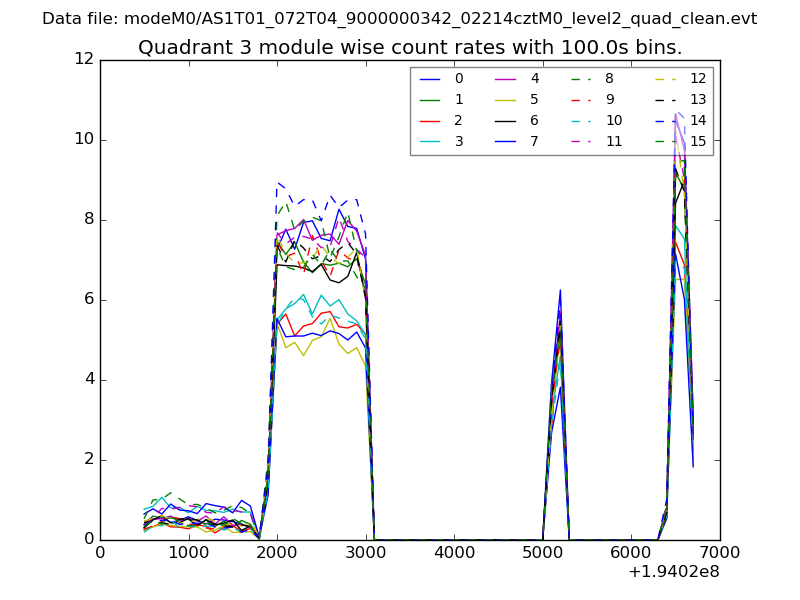
| Module-wise count rates for Quadrant C Data is divided into 100 sec bins |
 |
 |
| Module-wise count rates for Quadrant D Data is divided into 100 sec bins |
 |
 |
| Parameter | Plot |
|---|---|
| CZT HV Monitor | 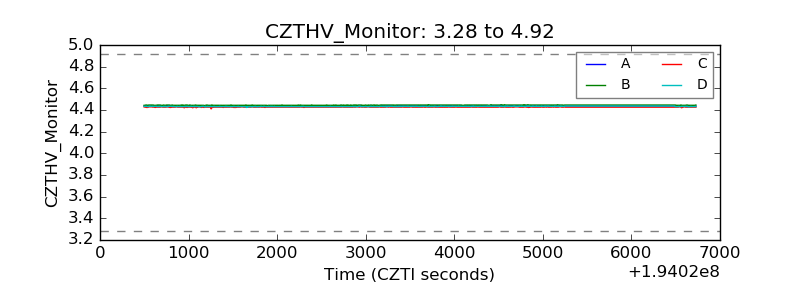 |
| D_VDD | 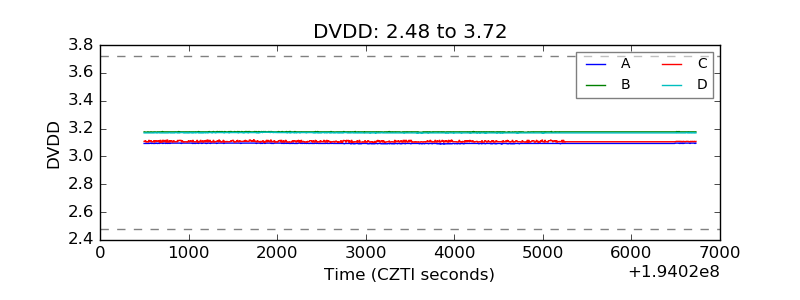 |
| Temperature 1 | 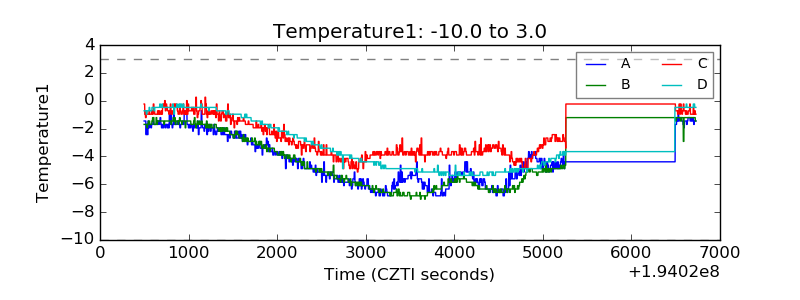 |
| Veto HV Monitor | 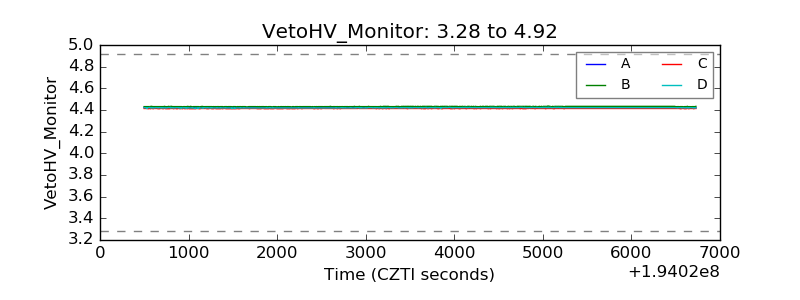 |
| Veto LLD | 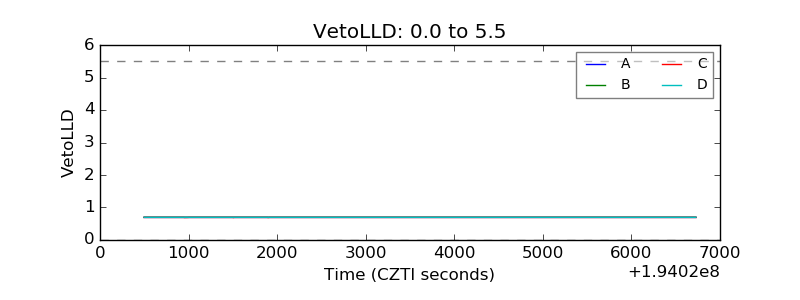 |
| Alpha Counter | 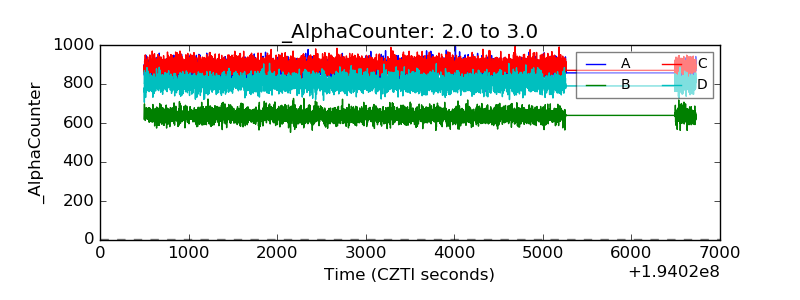 |
| _CPM_Rate | 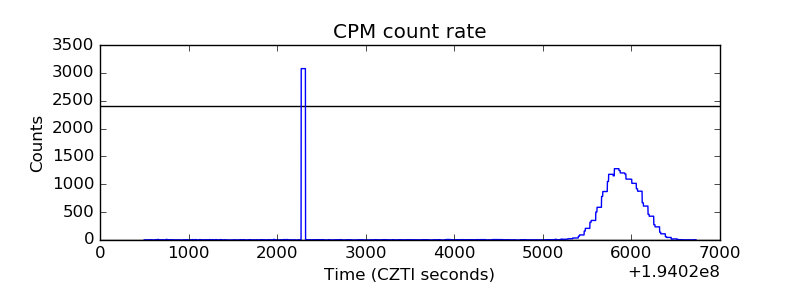 |
| CZT Counter | 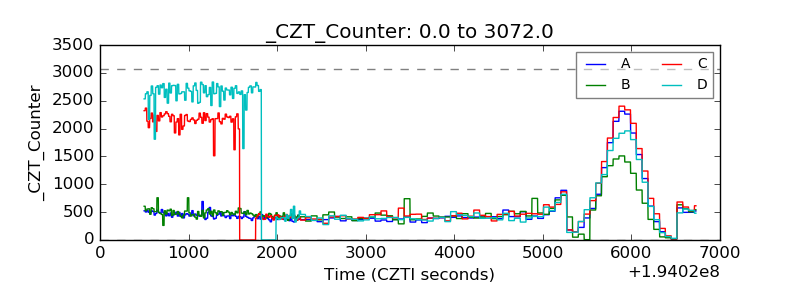 |
| +2.5 Volts monitor | 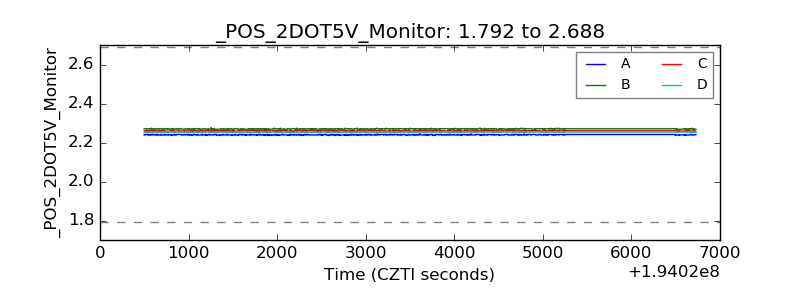 |
| +5 Volts monitor | 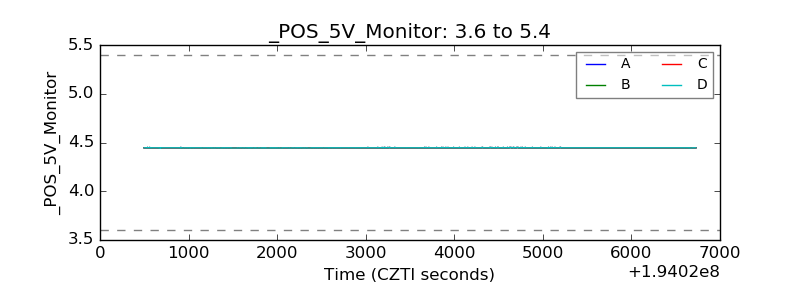 |
| _ROLL_ROT | 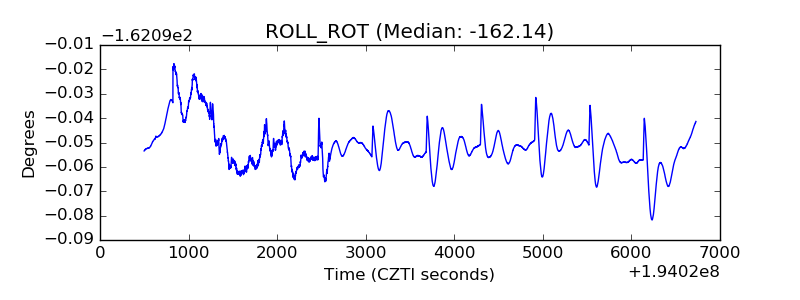 |
| _Roll_DEC | 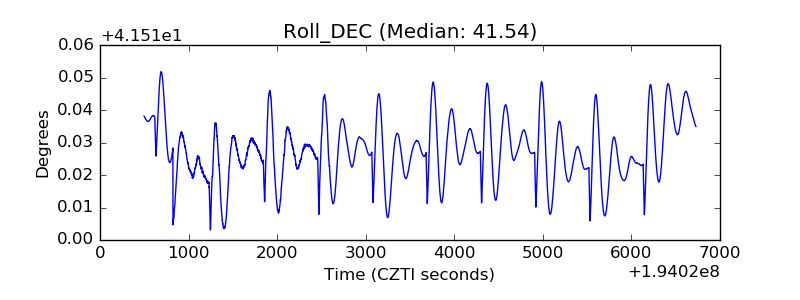 |
| _Roll_RA | 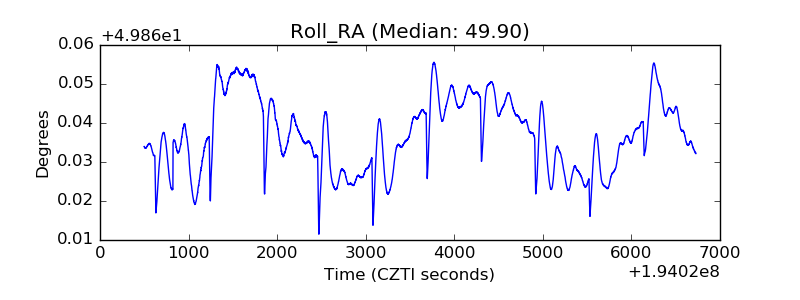 |
| Veto Counter | 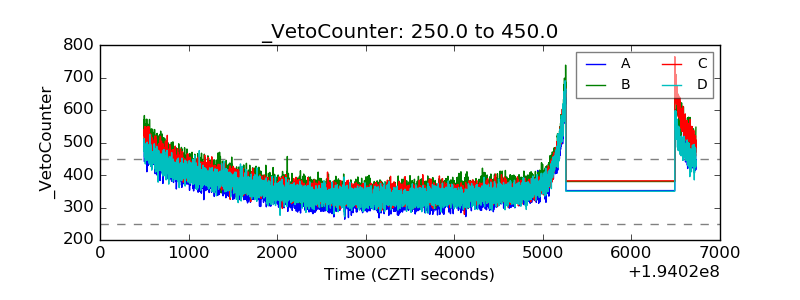 |