| Param | Original file | Final file |
|---|---|---|
| Filename | modeM0/AS1T01_072T05_9000000344cztM0_level2.fits | modeM0/AS1T01_072T05_9000000344cztM0_level2_quad_clean.evt |
| Size (bytes) | 1,097,616,960 | 1,079,899,200 |
| Size | 1.0 GB | 1.0 GB |
| Events in quadrant A | 6,490,816 | 6,199,319 |
| Events in quadrant B | 6,377,658 | 6,406,656 |
| Events in quadrant C | 6,443,682 | 6,131,381 |
| Events in quadrant D | 5,566,579 | 5,607,304 |
| Mode SS | |||
|---|---|---|---|
| Quadrant | BADHDUFLAG | Total packets | Discarded packets |
| A | 0 | 2440 | 0 |
| B | 0 | 2454 | 0 |
| C | 0 | 2438 | 0 |
| D | 0 | 2444 | 0 |
| Mode M0 | |||
|---|---|---|---|
| Quadrant | BADHDUFLAG | Total packets | Discarded packets |
| A | 0 | 250431 | 0 |
| B | 0 | 253860 | 0 |
| C | 0 | 251199 | 0 |
| D | 0 | 256162 | 0 |
| Mode M9 | |||
|---|---|---|---|
| Quadrant | BADHDUFLAG | Total packets | Discarded packets |
| A | 1 | 140710725531688 | 140707423584302 |
| B | 1 | 140710725531688 | 140707423584302 |
| C | 1 | 140710725531688 | 140707423584302 |
| D | 1 | 140710725531688 | 140707423584302 |
| Quadrant | Total seconds | Saturated seconds | Saturation percentage |
|---|---|---|---|
| A | 121910 | 1226 | 1.005660% |
| B | 122048 | 1486 | 1.217554% |
| C | 122039 | 964 | 0.789911% |
| D | 122051 | 1118 | 0.916011% |
Noise dominated data is calculated using 1-second bins in cleaned event files. If a bin has >2000 counts, and if more than 50% of those come from <1% of pixels, then it is considered to be noise-dominated and hence unusable.
| Quadrant | # 1 sec bins | Bins with >0 counts | Bins with >2000 counts | High rate bins dominated by noise | Noise dominated (total time) | Noise dominated (detector-on time) | Marked lightcurve |
|---|---|---|---|---|---|---|---|
| A | 157727 | 122496 | 0 | 0 | 0.00% | 0.00% |  |
| B | 157728 | 122680 | 0 | 0 | 0.00% | 0.00% | 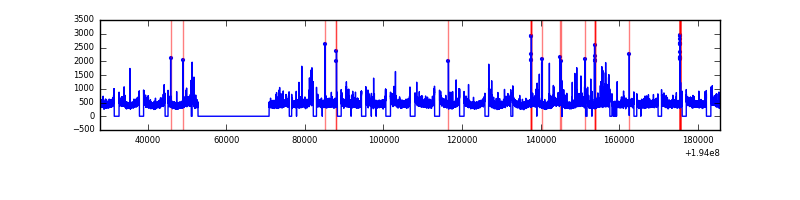 |
| C | 157727 | 122661 | 0 | 0 | 0.00% | 0.00% |  |
| D | 157728 | 122648 | 0 | 0 | 0.00% | 0.00% |  |
Top three noisy pixels from each quadrant. If the there are fewer than three noisy pixels in the level2.evt file, extra rows are filled as -1
| Pixel properties | Quadrant properties | ||||||
|---|---|---|---|---|---|---|---|
| Quadrant | DetID | PixID | Counts | Sigma | Mean | Median | Sigma |
| A | 0 | 29 | 6012 | 10.15 | 1682 | 1559 | 438.9 |
| A | 7 | 110 | 5778 | 9.61 | 1682 | 1559 | 438.9 |
| A | 14 | 188 | 5238 | 8.38 | 1682 | 1559 | 438.9 |
| B | 2 | 9 | 5649 | 12.26 | 1676 | 1585 | 331.6 |
| B | 12 | 226 | 4922 | 10.06 | 1676 | 1585 | 331.6 |
| B | 5 | 128 | 4410 | 8.52 | 1676 | 1585 | 331.6 |
| C | 9 | 242 | 4251 | 5.86 | 1707 | 1569 | 458.0 |
| C | 9 | 188 | 4220 | 5.79 | 1707 | 1569 | 458.0 |
| C | 3 | 158 | 4204 | 5.75 | 1707 | 1569 | 458.0 |
| D | 3 | 14 | 4280 | 6.43 | 1588 | 1437 | 442.3 |
| D | 11 | 82 | 4105 | 6.03 | 1588 | 1437 | 442.3 |
| D | 1 | 19 | 4061 | 5.93 | 1588 | 1437 | 442.3 |
Histogram calculated using DETX and DETY for each event in the final _common_clean file
| Quadrant A |  |
 |
Quadrant B |
|---|---|---|---|
| Quadrant D |  |
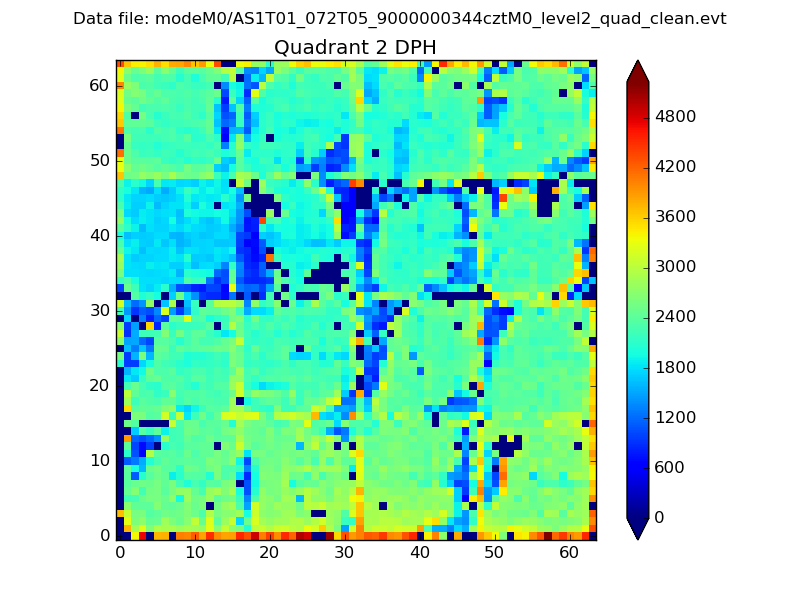 |
Quadrant C |
| Plot type | Count rate plots | Images |
|---|---|---|
| Comparison with Poisson distribution Blue bars denote a histogram of data divided into 1 sec bins. Red curve is a Poisson curve with rate = median count rate of data. |
 |
 |
| Quadrant-wise count rates Data is divided into 100 sec bins |
 |
|
| Module-wise count rates for Quadrant A Data is divided into 100 sec bins |
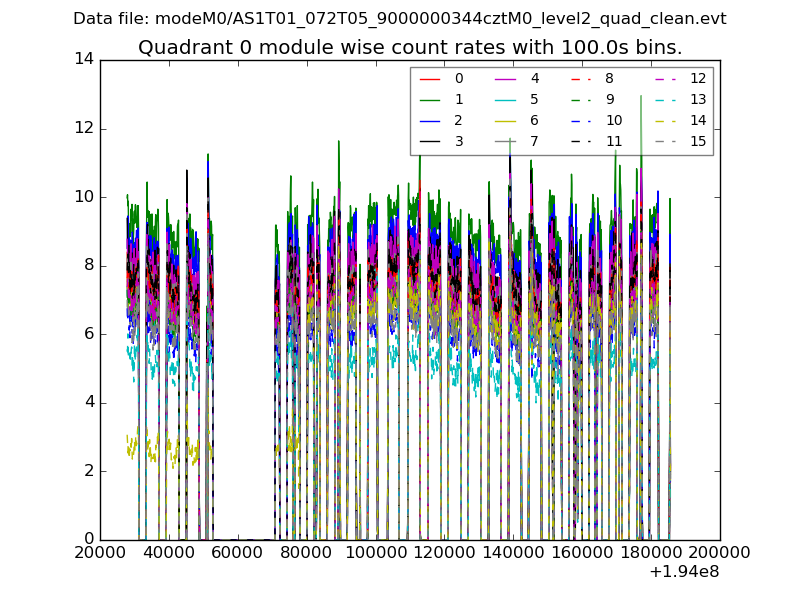 |
 |
| Module-wise count rates for Quadrant B Data is divided into 100 sec bins |
 |
 |
| Module-wise count rates for Quadrant C Data is divided into 100 sec bins |
 |
 |
| Module-wise count rates for Quadrant D Data is divided into 100 sec bins |
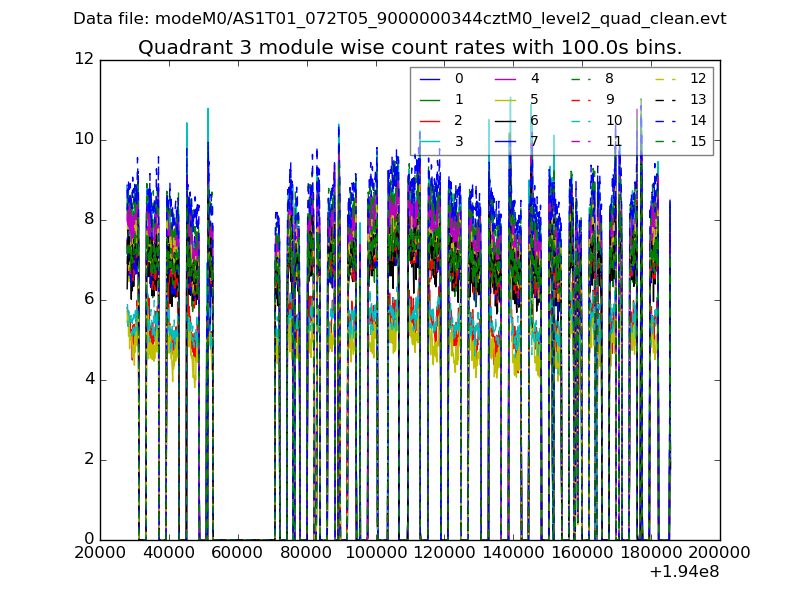 |
 |
| Parameter | Plot |
|---|---|
| CZT HV Monitor |  |
| D_VDD |  |
| Temperature 1 |  |
| Veto HV Monitor |  |
| Veto LLD |  |
| Alpha Counter |  |
| _CPM_Rate |  |
| CZT Counter | 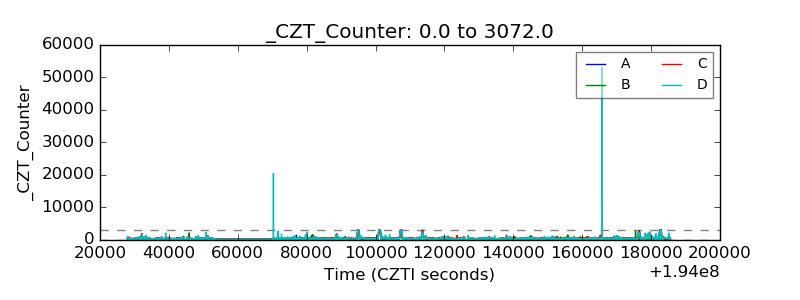 |
| +2.5 Volts monitor |  |
| +5 Volts monitor |  |
| _ROLL_ROT |  |
| _Roll_DEC |  |
| _Roll_RA |  |
| Veto Counter |  |