| Param | Original file | Final file |
|---|---|---|
| Filename | modeM0/AS1T01_072T05_9000000344_02218cztM0_level2.evt | modeM0/AS1T01_072T05_9000000344_02218cztM0_level2_quad_clean.evt |
| Size (bytes) | 460,512,000 | 84,424,320 |
| Size | 439.2 MB | 80.5 MB |
| Events in quadrant A | 3,216,074 | 500,174 |
| Events in quadrant B | 3,437,502 | 519,786 |
| Events in quadrant C | 3,359,578 | 519,029 |
| Events in quadrant D | 3,430,722 | 503,058 |
| Mode SS | |||
|---|---|---|---|
| Quadrant | BADHDUFLAG | Total packets | Discarded packets |
| A | 0 | 148 | 0 |
| B | 0 | 148 | 0 |
| C | 0 | 148 | 0 |
| D | 0 | 148 | 0 |
| Mode M0 | |||
|---|---|---|---|
| Quadrant | BADHDUFLAG | Total packets | Discarded packets |
| A | 0 | 15342 | 2 |
| B | 0 | 15539 | 2 |
| C | 0 | 15442 | 2 |
| D | 0 | 15814 | 2 |
| Mode M9 | |||
|---|---|---|---|
| Quadrant | BADHDUFLAG | Total packets | Discarded packets |
| A | 0 | 1 | 0 |
| B | 1 | 1 | 0 |
| C | 1 | -1 | -1 |
| D | 1 | -1 | -1 |
| Quadrant | Total seconds | Saturated seconds | Saturation percentage |
|---|---|---|---|
| A | 7390 | 56 | 0.757781% |
| B | 7390 | 138 | 1.867388% |
| C | 7390 | 54 | 0.730717% |
| D | 7390 | 35 | 0.473613% |
Noise dominated data is calculated using 1-second bins in cleaned event files. If a bin has >2000 counts, and if more than 50% of those come from <1% of pixels, then it is considered to be noise-dominated and hence unusable.
| Quadrant | # 1 sec bins | Bins with >0 counts | Bins with >2000 counts | High rate bins dominated by noise | Noise dominated (total time) | Noise dominated (detector-on time) | Marked lightcurve |
|---|---|---|---|---|---|---|---|
| A | 7625 | 7391 | 0 | 0 | 0.00% | 0.00% | 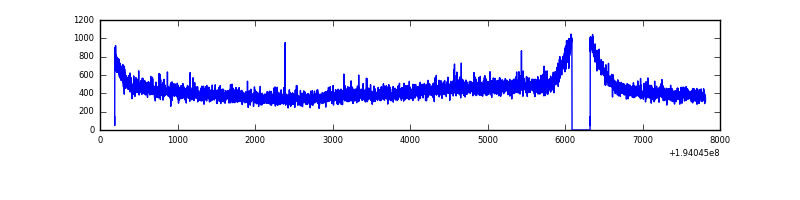 |
| B | 7625 | 7391 | 2 | 2 | 0.03% | 0.03% | 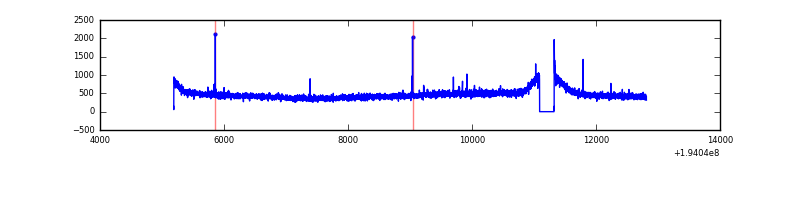 |
| C | 7625 | 7391 | 0 | 0 | 0.00% | 0.00% | 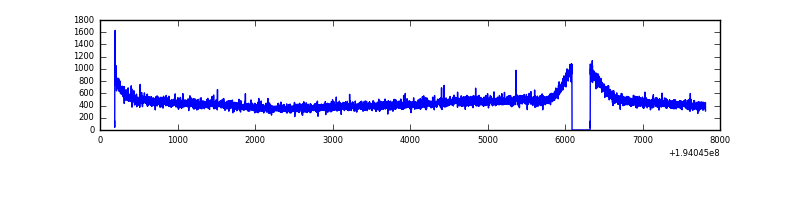 |
| D | 7625 | 7391 | 10 | 10 | 0.13% | 0.14% | 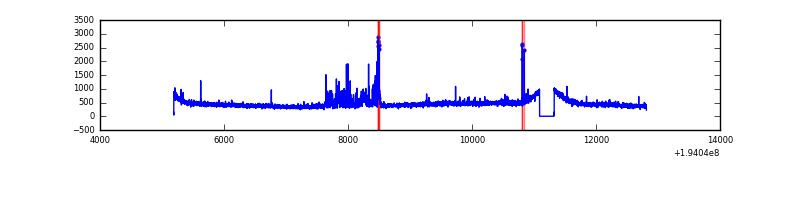 |
Top three noisy pixels from each quadrant. If the there are fewer than three noisy pixels in the level2.evt file, extra rows are filled as -1
| Pixel properties | Quadrant properties | ||||||
|---|---|---|---|---|---|---|---|
| Quadrant | DetID | PixID | Counts | Sigma | Mean | Median | Sigma |
| A | 12 | 194 | 9811 | 38.09 | 837 | 839 | 235.5 |
| A | 0 | 226 | 9397 | 36.33 | 837 | 839 | 235.5 |
| A | 15 | 47 | 3865 | 12.85 | 837 | 839 | 235.5 |
| B | 15 | 85 | 15100 | 81.52 | 886 | 862 | 174.6 |
| B | 12 | 111 | 12777 | 68.22 | 886 | 862 | 174.6 |
| B | 11 | 111 | 10774 | 56.75 | 886 | 862 | 174.6 |
| C | 5 | 234 | 12454 | 57.56 | 850 | 853 | 201.5 |
| C | 8 | 112 | 8669 | 38.78 | 850 | 853 | 201.5 |
| C | 13 | 61 | 7784 | 34.39 | 850 | 853 | 201.5 |
| D | 12 | 217 | 213801 | 1059.66 | 835 | 814 | 201.0 |
| D | 2 | 63 | 16143 | 76.27 | 835 | 814 | 201.0 |
| D | 15 | 194 | 15234 | 71.74 | 835 | 814 | 201.0 |
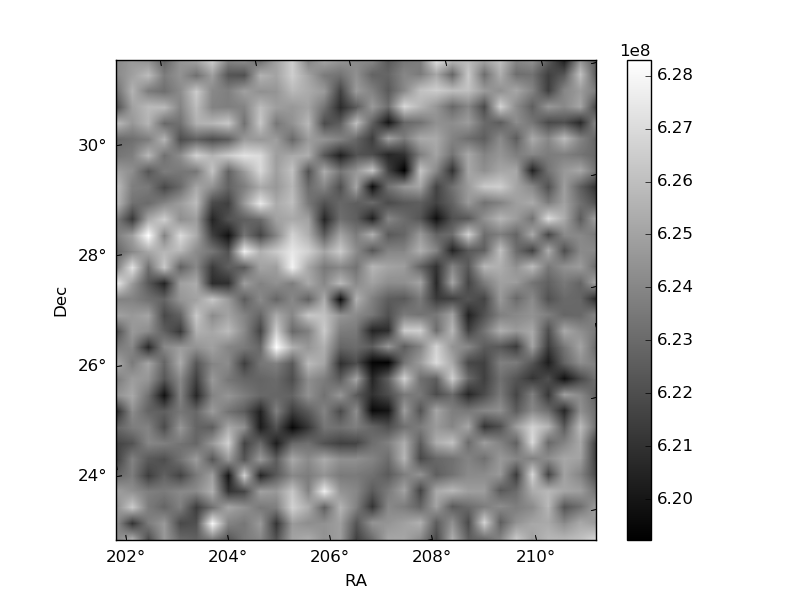
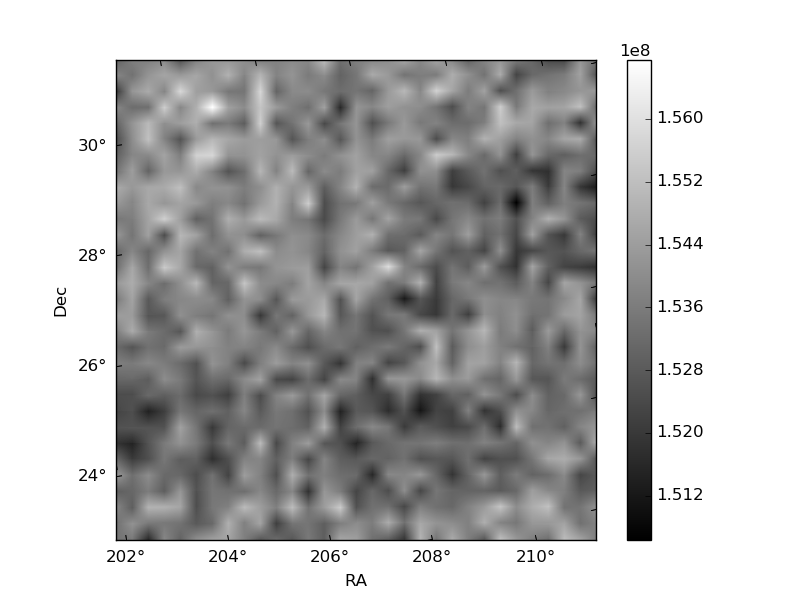
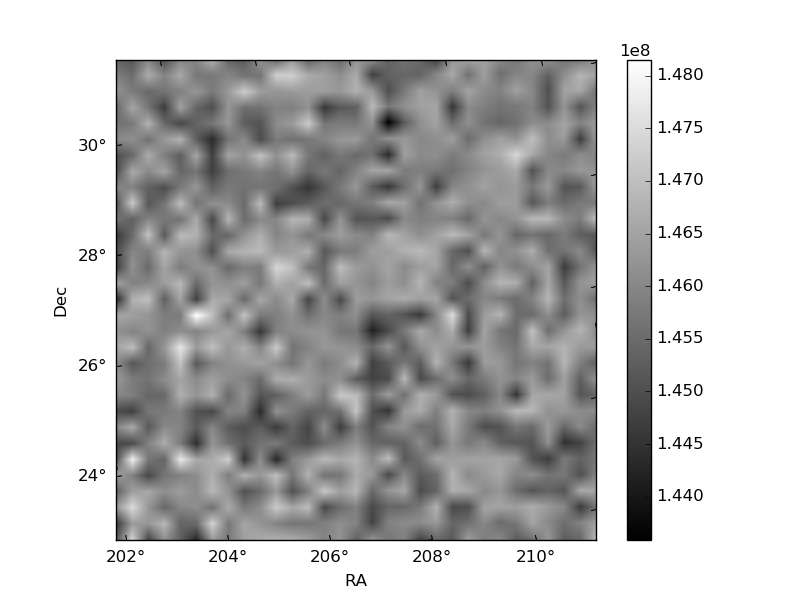
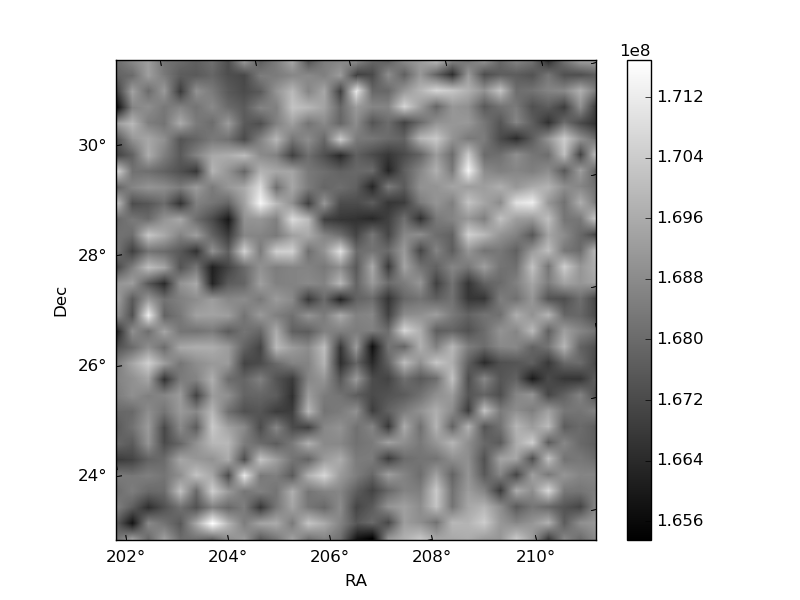
Histogram calculated using DETX and DETY for each event in the final _common_clean file
| Quadrant A | 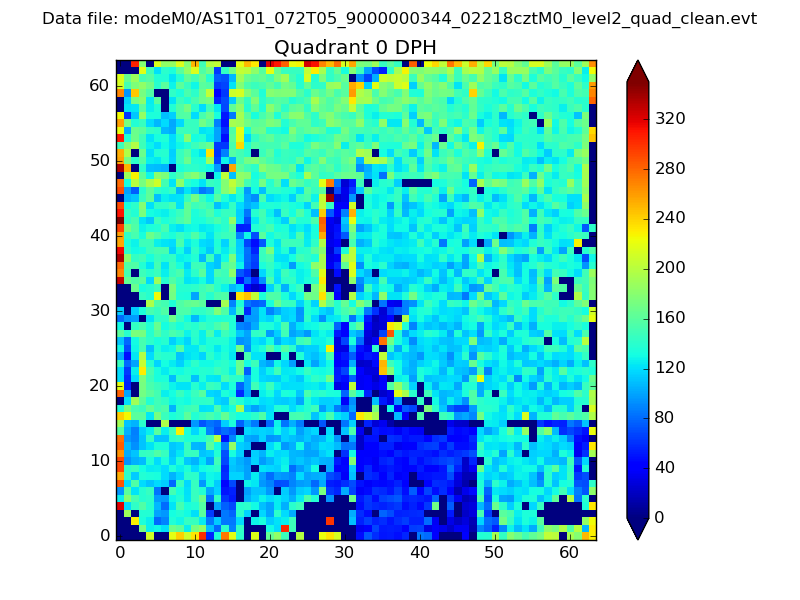 |
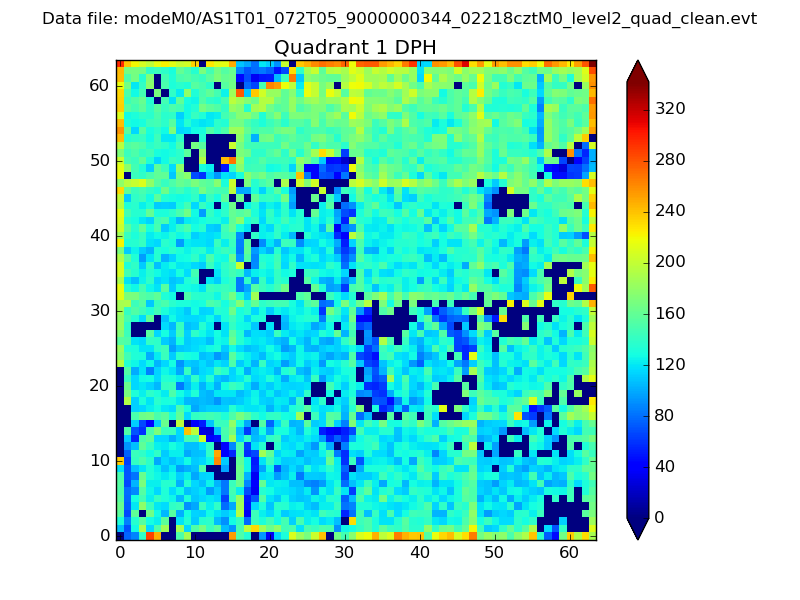 |
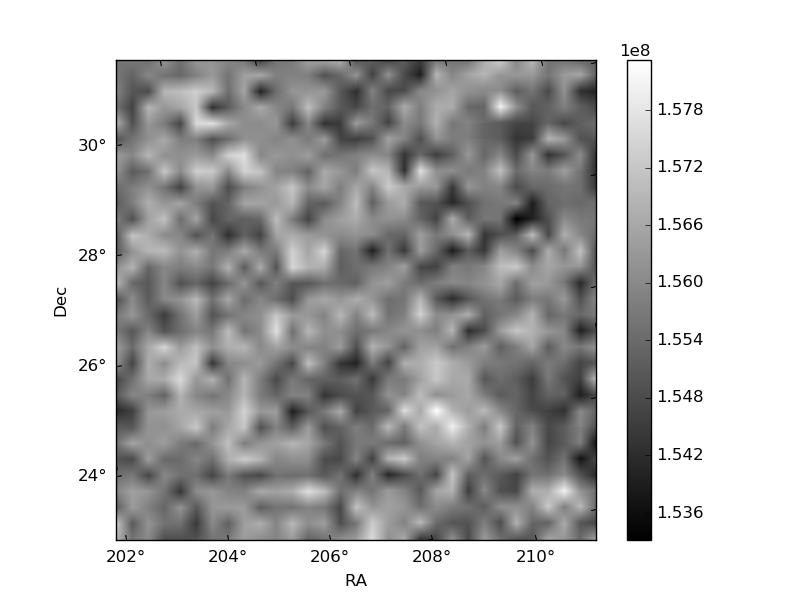
Quadrant B |
|---|---|---|---|
| Quadrant D | 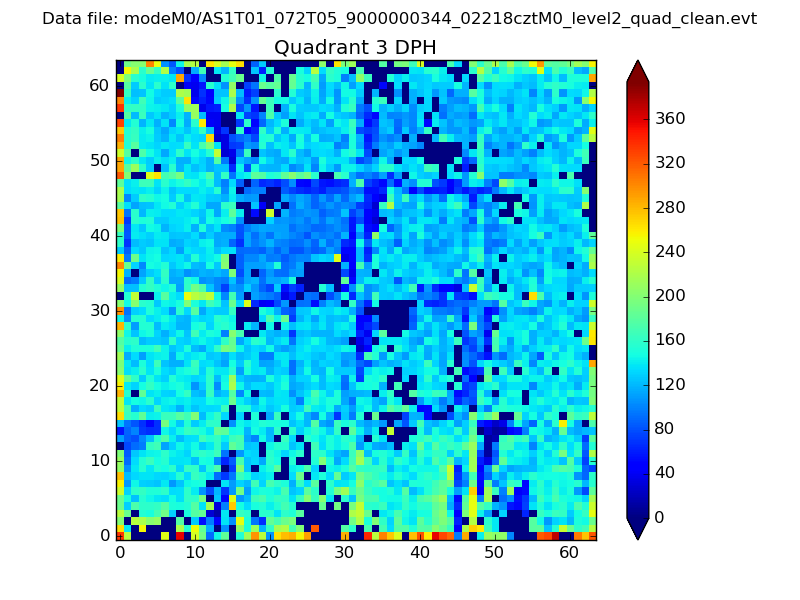 |
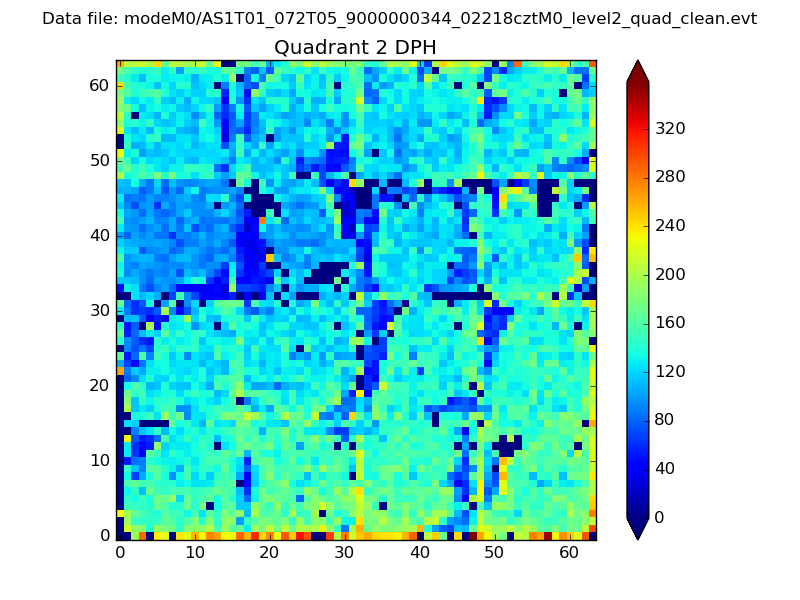 |
Quadrant C |
| Plot type | Count rate plots | Images |
|---|---|---|
| Comparison with Poisson distribution Blue bars denote a histogram of data divided into 1 sec bins. Red curve is a Poisson curve with rate = median count rate of data. |
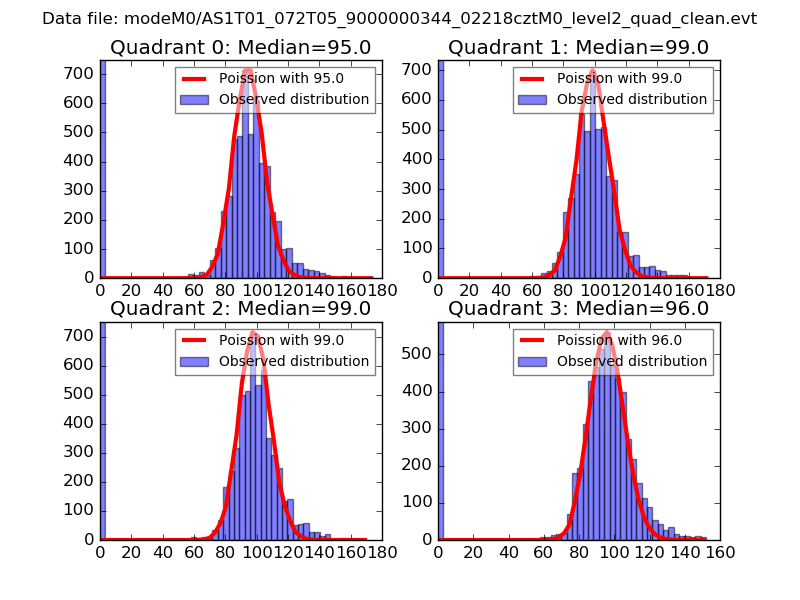 |
 |
| Quadrant-wise count rates Data is divided into 100 sec bins |
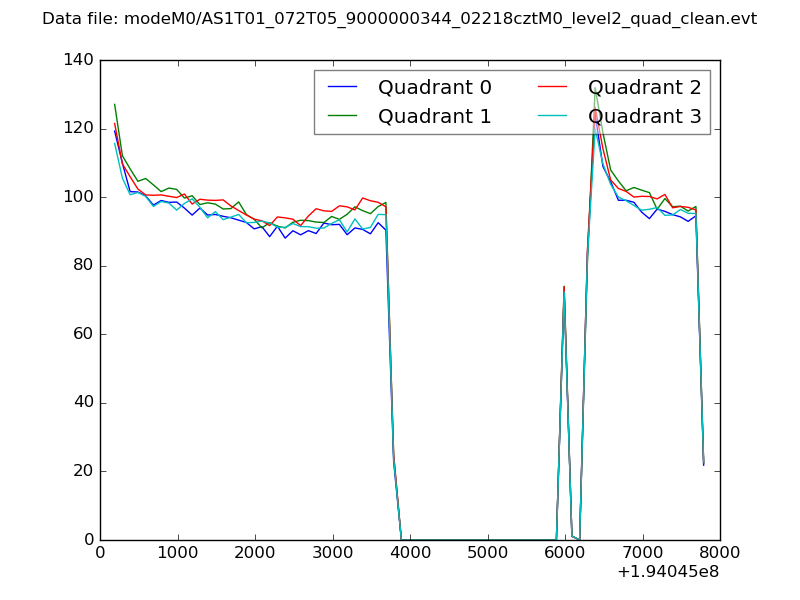 |
|
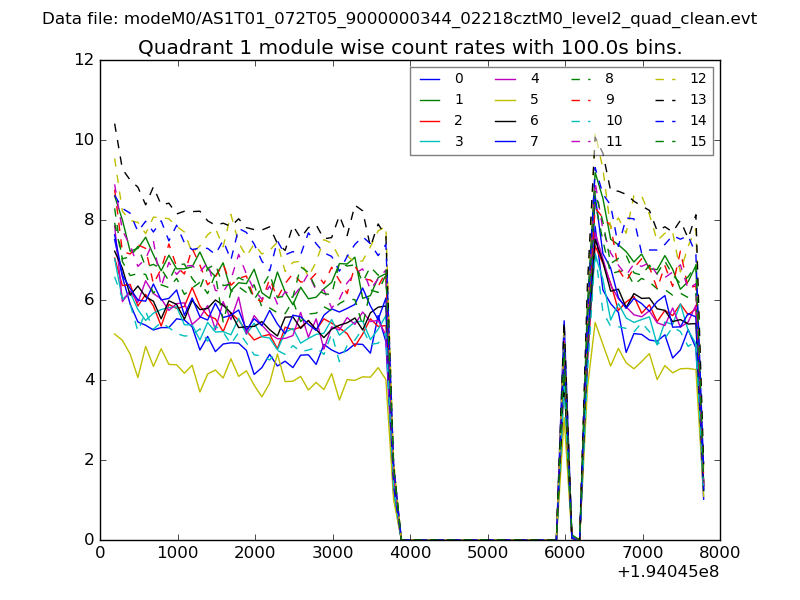
| Module-wise count rates for Quadrant A Data is divided into 100 sec bins |
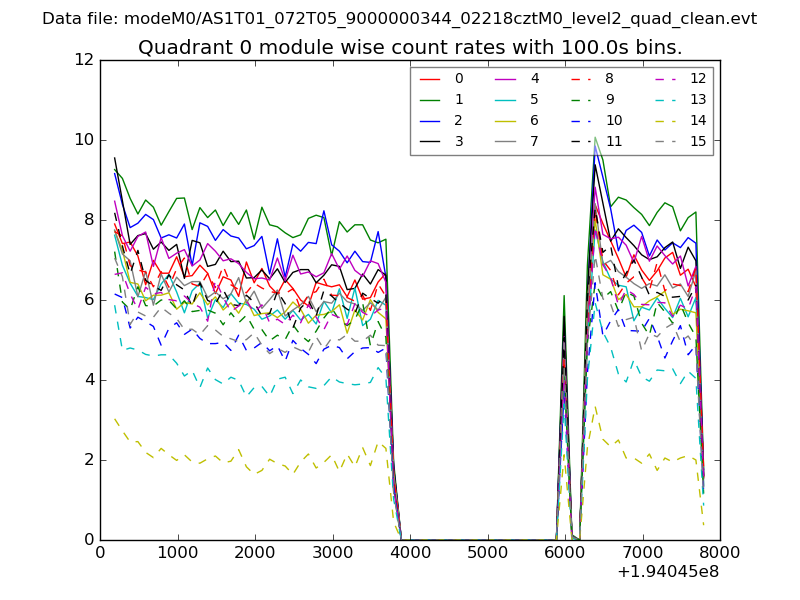 |
 |
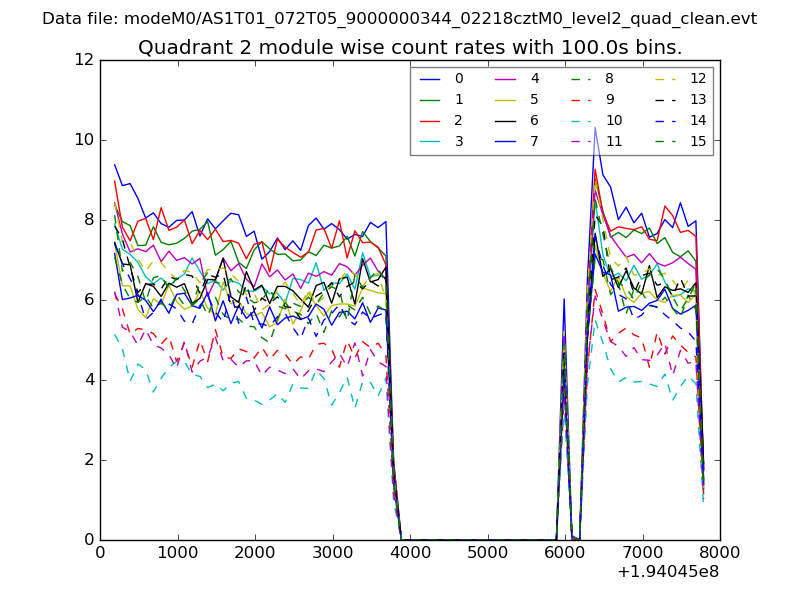
| Module-wise count rates for Quadrant B Data is divided into 100 sec bins |
 |
 |
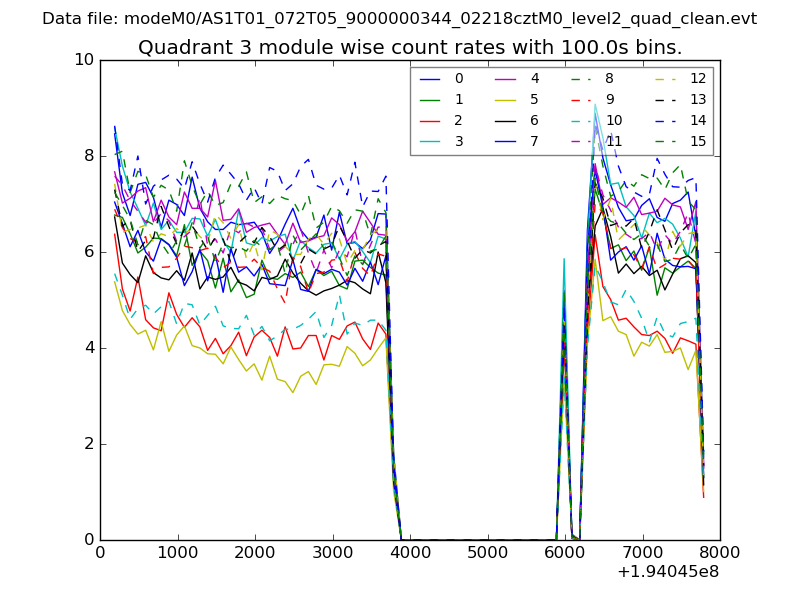
| Module-wise count rates for Quadrant C Data is divided into 100 sec bins |
 |
 |
| Module-wise count rates for Quadrant D Data is divided into 100 sec bins |
 |
 |
| Parameter | Plot |
|---|---|
| CZT HV Monitor | 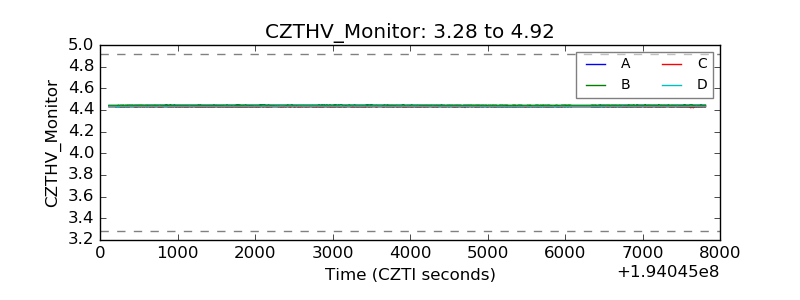 |
| D_VDD | 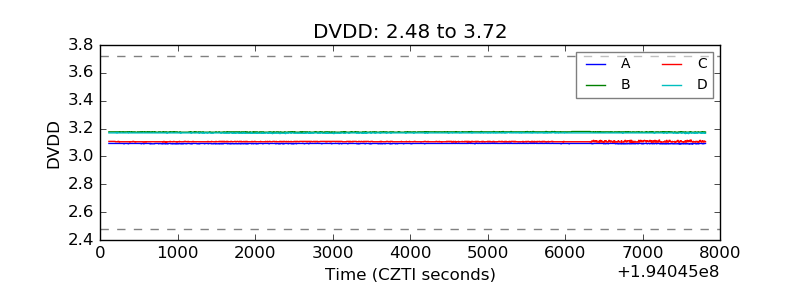 |
| Temperature 1 | 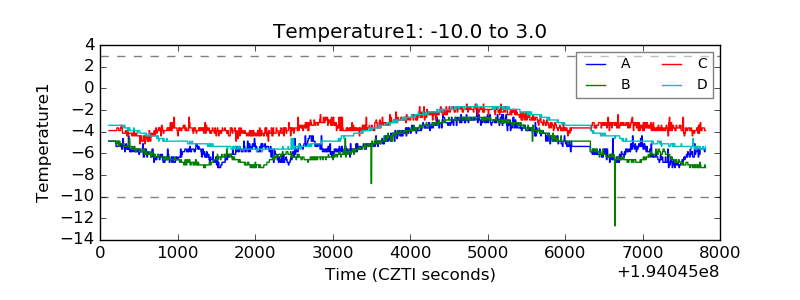 |
| Veto HV Monitor | 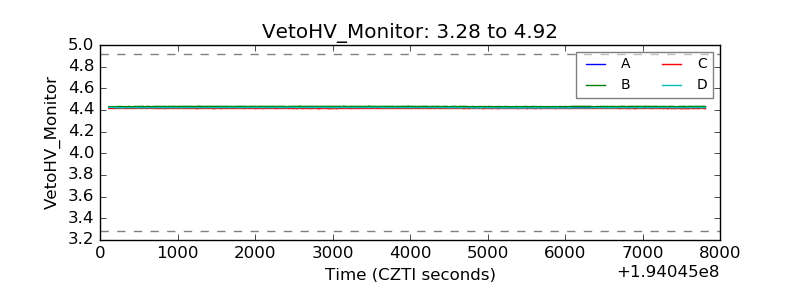 |
| Veto LLD | 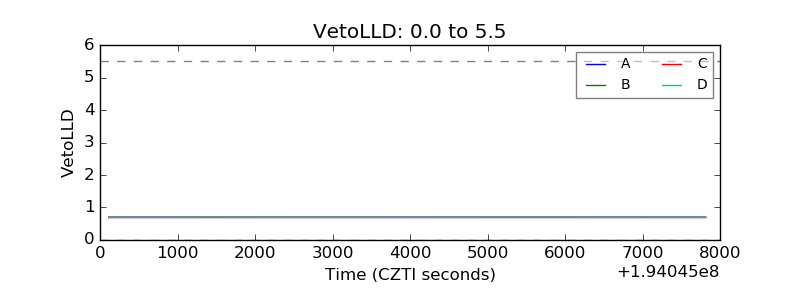 |
| Alpha Counter | 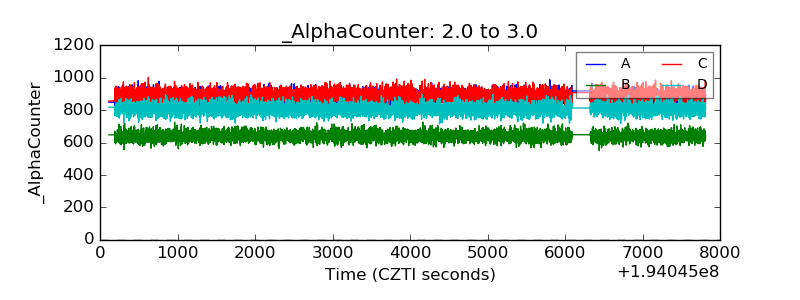 |
| _CPM_Rate | 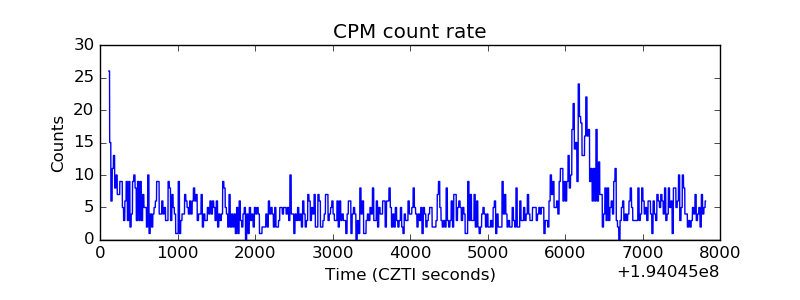 |
| CZT Counter | 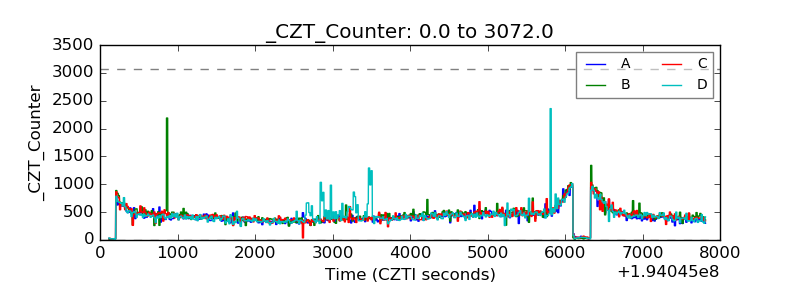 |
| +2.5 Volts monitor |  |
| +5 Volts monitor |  |
| _ROLL_ROT | 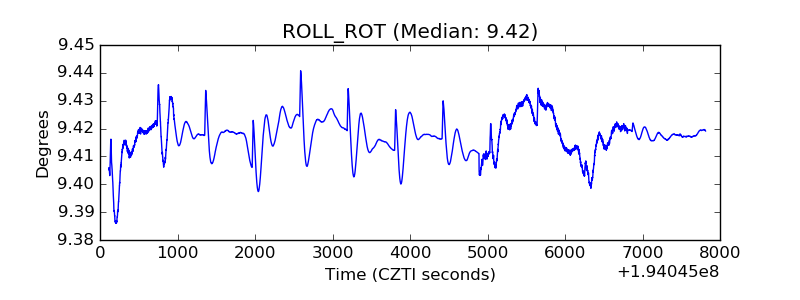 |
| _Roll_DEC | 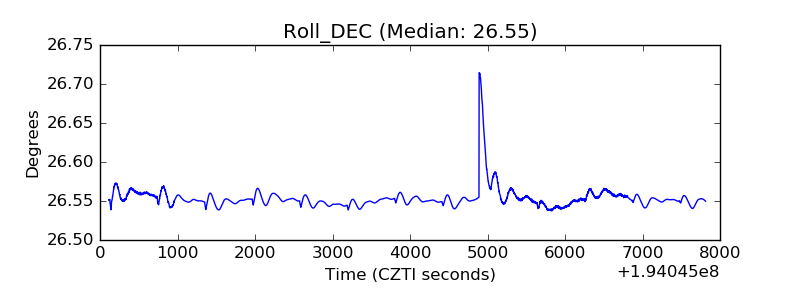 |
| _Roll_RA | 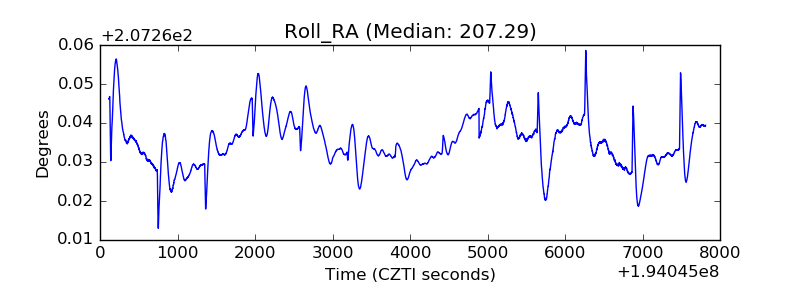 |
| Veto Counter | 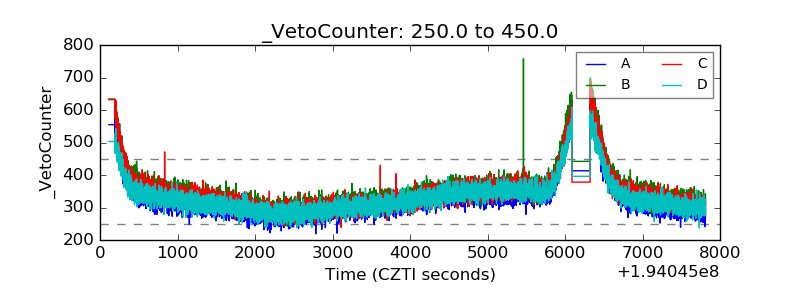 |