| Param | Original file | Final file |
|---|---|---|
| Filename | modeM0/AS1T01_072T05_9000000344_02228cztM0_level2.evt | modeM0/AS1T01_072T05_9000000344_02228cztM0_level2_quad_clean.evt |
| Size (bytes) | 417,337,920 | 59,518,080 |
| Size | 398.0 MB | 56.8 MB |
| Events in quadrant A | 3,053,005 | 341,267 |
| Events in quadrant B | 3,096,159 | 345,416 |
| Events in quadrant C | 3,043,896 | 343,498 |
| Events in quadrant D | 3,022,196 | 336,766 |
| Mode SS | |||
|---|---|---|---|
| Quadrant | BADHDUFLAG | Total packets | Discarded packets |
| A | 0 | 124 | 0 |
| B | 0 | 124 | 0 |
| C | 0 | 124 | 0 |
| D | 0 | 124 | 0 |
| Mode M0 | |||
|---|---|---|---|
| Quadrant | BADHDUFLAG | Total packets | Discarded packets |
| A | 0 | 13129 | 2 |
| B | 0 | 13213 | 2 |
| C | 0 | 13059 | 2 |
| D | 0 | 13276 | 2 |
| Mode M9 | |||
|---|---|---|---|
| Quadrant | BADHDUFLAG | Total packets | Discarded packets |
| A | 0 | 1 | 0 |
| B | 1 | 1 | 0 |
| C | 1 | -1 | -1 |
| D | 1 | -1 | -1 |
| Quadrant | Total seconds | Saturated seconds | Saturation percentage |
|---|---|---|---|
| A | 6235 | 83 | 1.331195% |
| B | 6235 | 80 | 1.283079% |
| C | 6235 | 78 | 1.251002% |
| D | 6235 | 80 | 1.283079% |
Noise dominated data is calculated using 1-second bins in cleaned event files. If a bin has >2000 counts, and if more than 50% of those come from <1% of pixels, then it is considered to be noise-dominated and hence unusable.
| Quadrant | # 1 sec bins | Bins with >0 counts | Bins with >2000 counts | High rate bins dominated by noise | Noise dominated (total time) | Noise dominated (detector-on time) | Marked lightcurve |
|---|---|---|---|---|---|---|---|
| A | 7475 | 6236 | 0 | 0 | 0.00% | 0.00% | 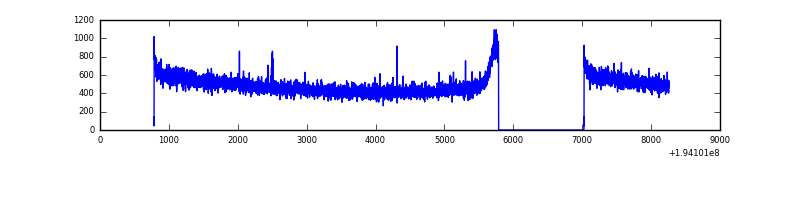 |
| B | 7475 | 6236 | 0 | 0 | 0.00% | 0.00% | 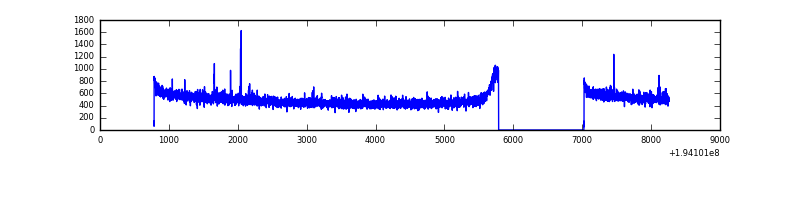 |
| C | 7475 | 6236 | 0 | 0 | 0.00% | 0.00% | 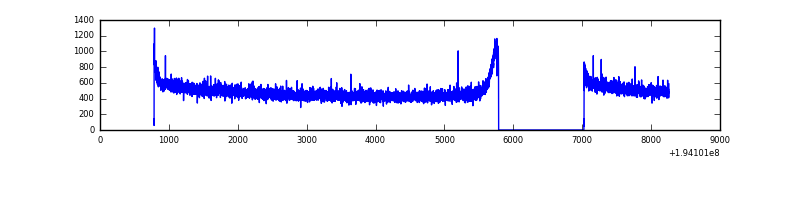 |
| D | 7475 | 6236 | 8 | 8 | 0.11% | 0.13% | 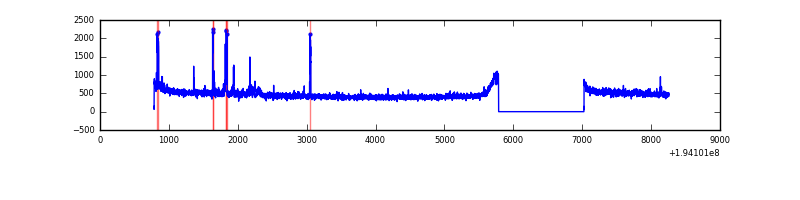 |
Top three noisy pixels from each quadrant. If the there are fewer than three noisy pixels in the level2.evt file, extra rows are filled as -1
| Pixel properties | Quadrant properties | ||||||
|---|---|---|---|---|---|---|---|
| Quadrant | DetID | PixID | Counts | Sigma | Mean | Median | Sigma |
| A | 3 | 1 | 22227 | 133.62 | 787 | 769 | 160.6 |
| A | 12 | 194 | 8746 | 49.67 | 787 | 769 | 160.6 |
| A | 0 | 226 | 8708 | 49.44 | 787 | 769 | 160.6 |
| B | 15 | 85 | 11810 | 72.42 | 797 | 779 | 152.3 |
| B | 12 | 111 | 10521 | 63.96 | 797 | 779 | 152.3 |
| B | 4 | 200 | 9196 | 55.26 | 797 | 779 | 152.3 |
| C | 5 | 234 | 17424 | 92.1 | 771 | 778 | 180.7 |
| C | 13 | 61 | 7093 | 34.94 | 771 | 778 | 180.7 |
| C | 0 | 64 | 3851 | 17.0 | 771 | 778 | 180.7 |
| D | 12 | 79 | 63255 | 343.47 | 763 | 743 | 182.0 |
| D | 2 | 63 | 48009 | 259.7 | 763 | 743 | 182.0 |
| D | 15 | 194 | 14099 | 73.38 | 763 | 743 | 182.0 |
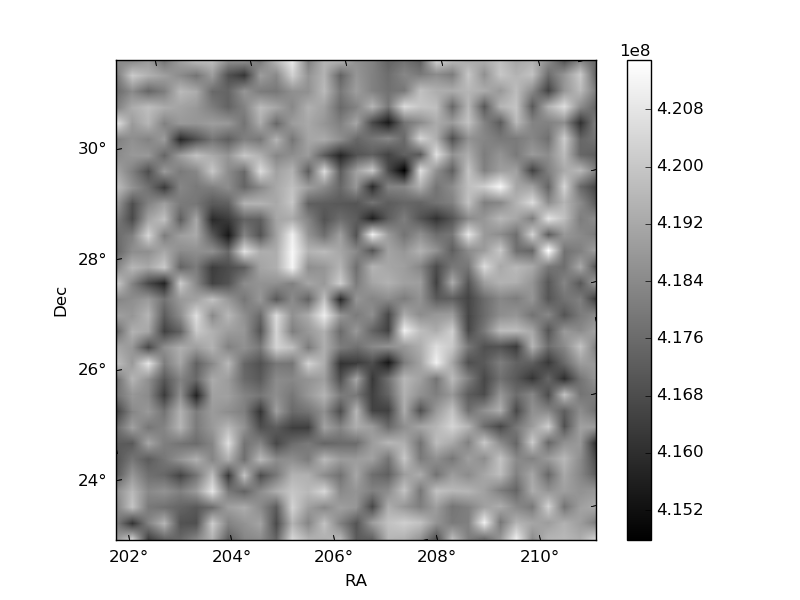
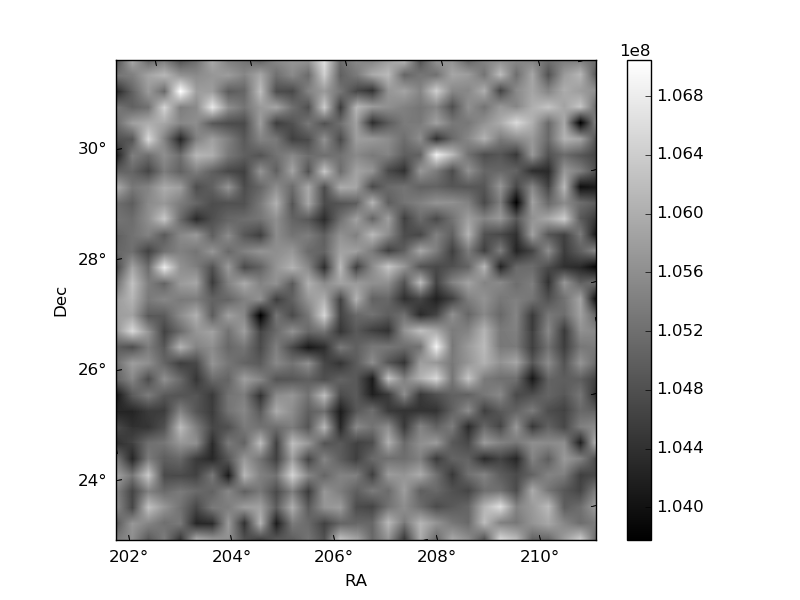
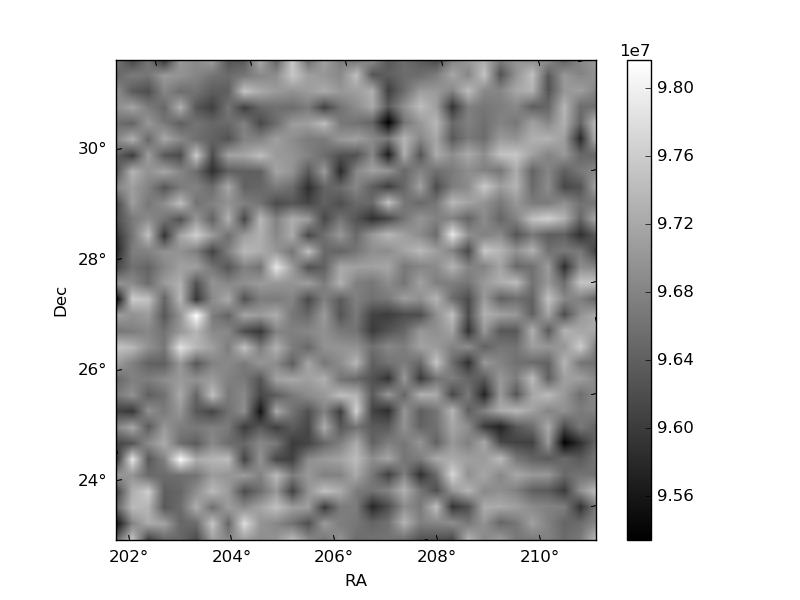
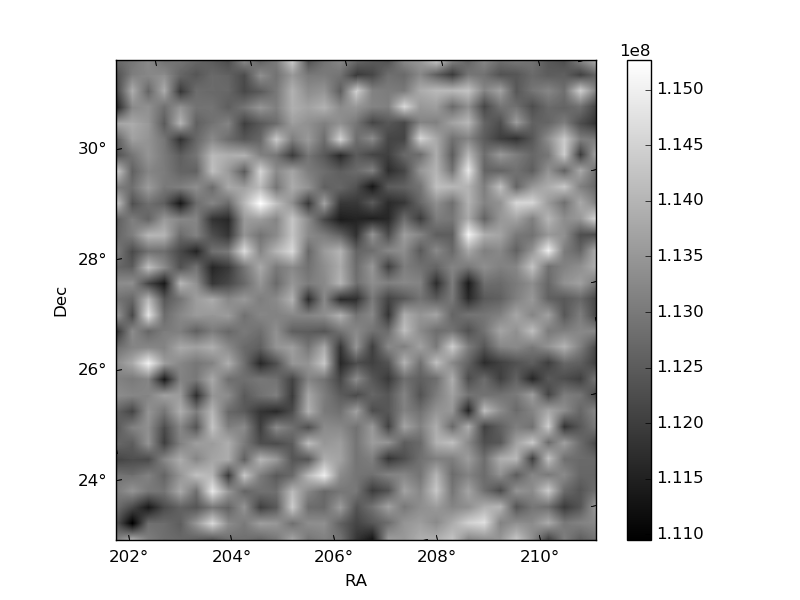
Histogram calculated using DETX and DETY for each event in the final _common_clean file
| Quadrant A | 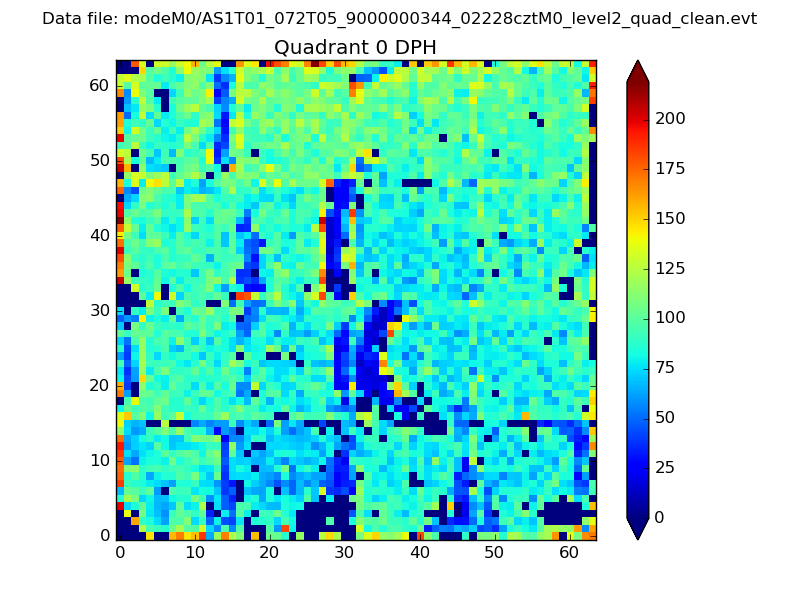 |
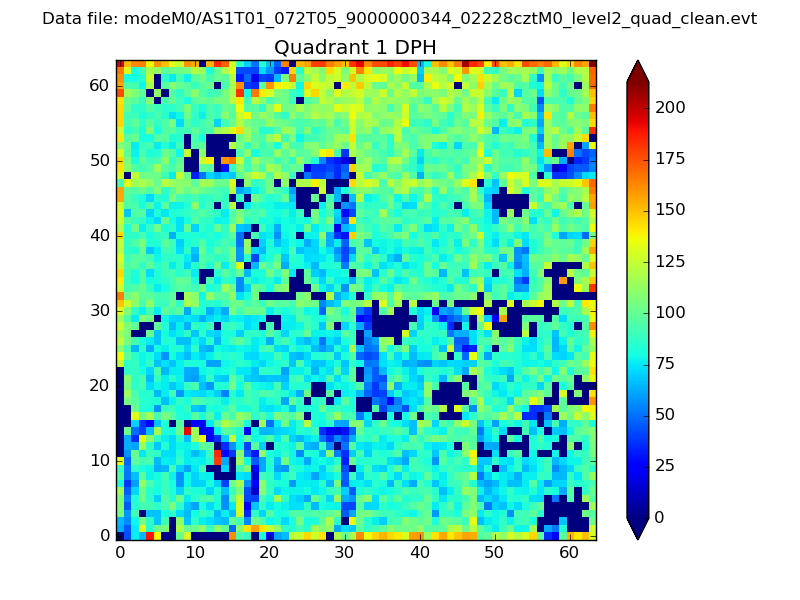 |
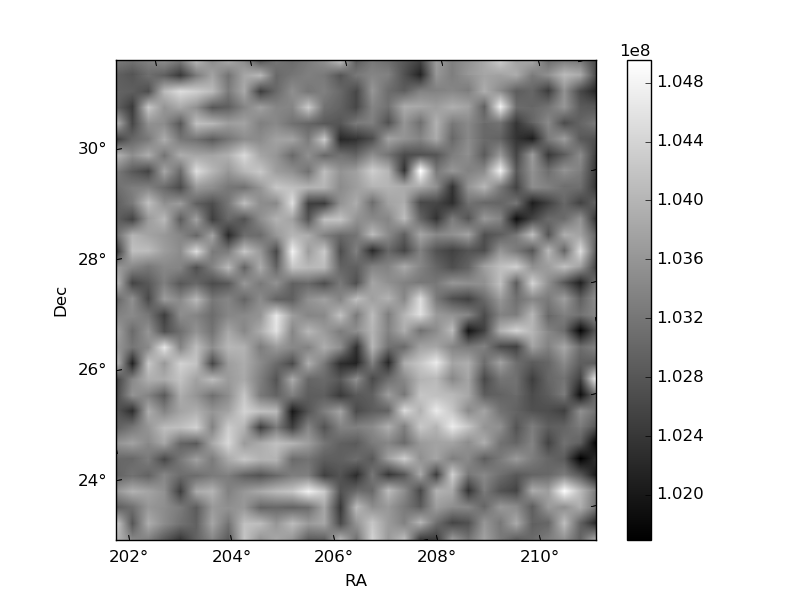
Quadrant B |
|---|---|---|---|
| Quadrant D | 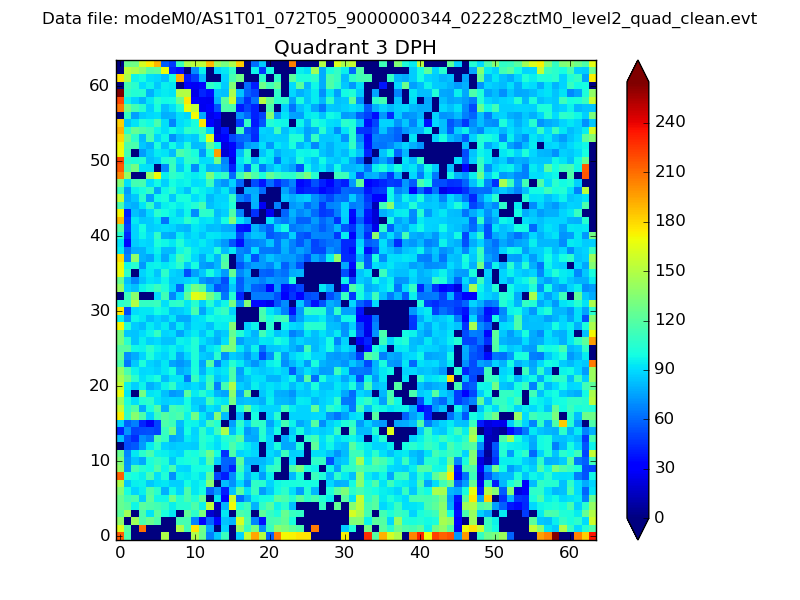 |
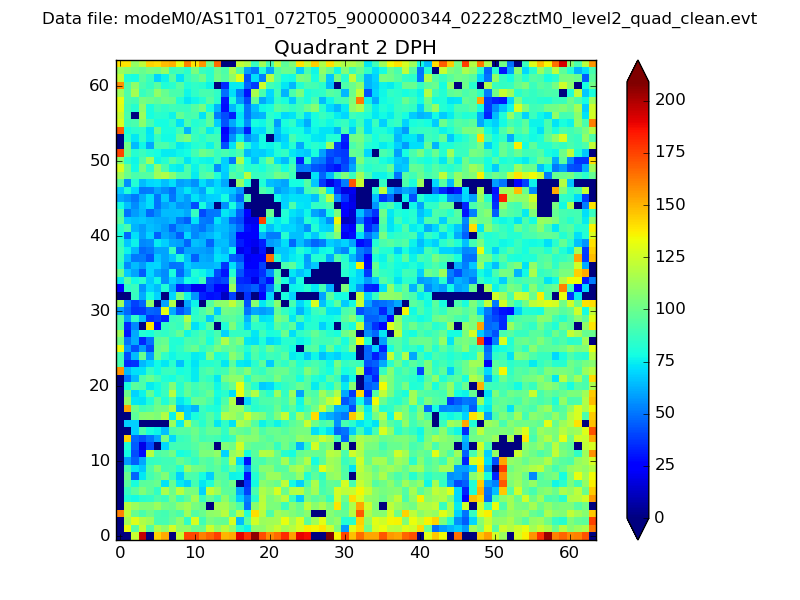 |
Quadrant C |
| Plot type | Count rate plots | Images |
|---|---|---|
| Comparison with Poisson distribution Blue bars denote a histogram of data divided into 1 sec bins. Red curve is a Poisson curve with rate = median count rate of data. |
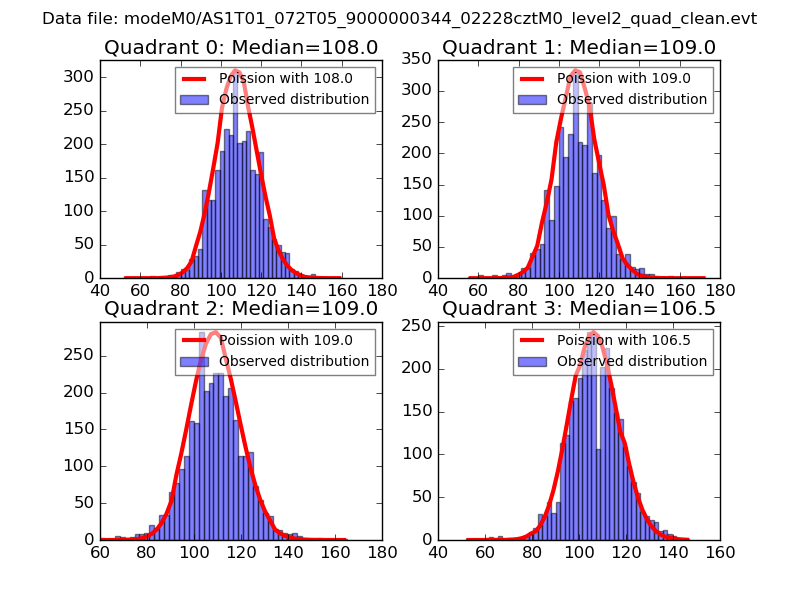 |
 |
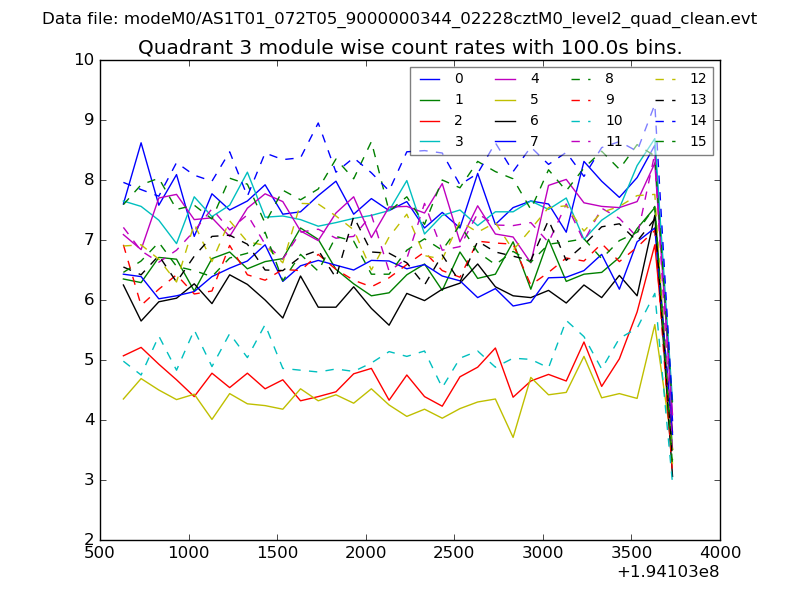
| Quadrant-wise count rates Data is divided into 100 sec bins |
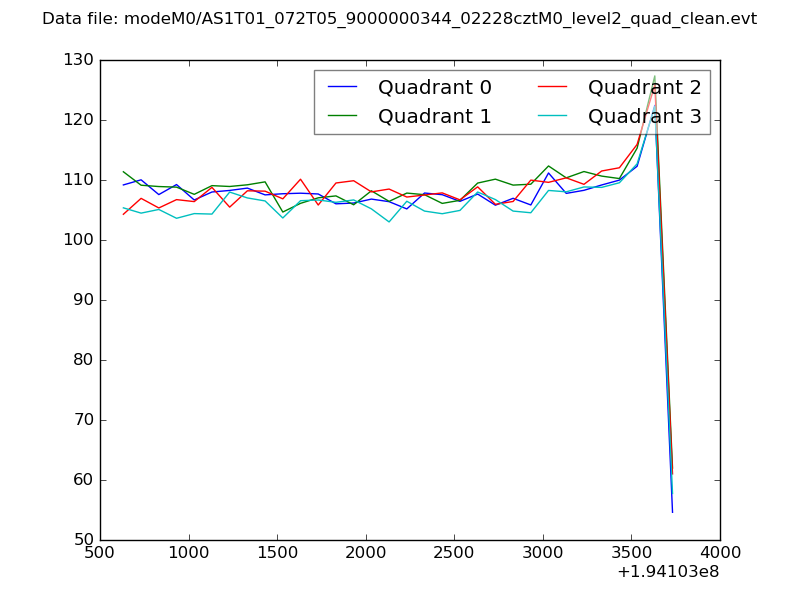 |
|
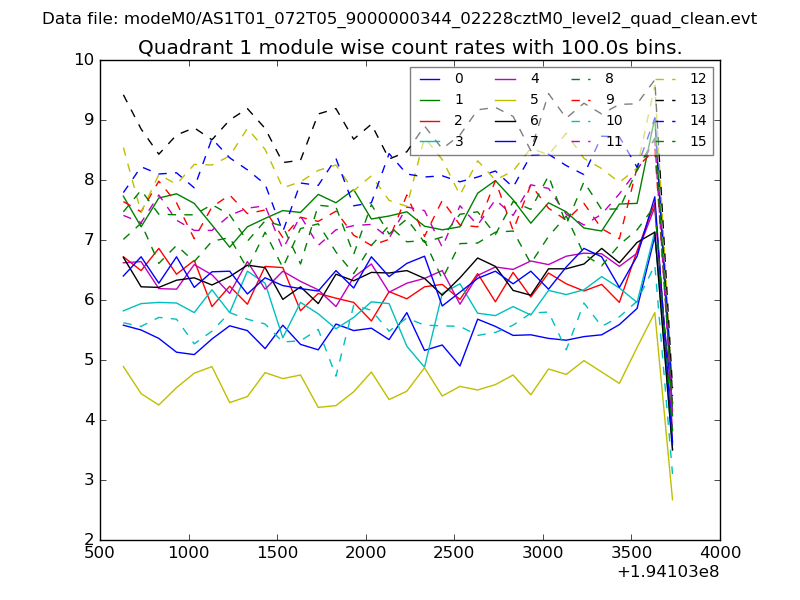
| Module-wise count rates for Quadrant A Data is divided into 100 sec bins |
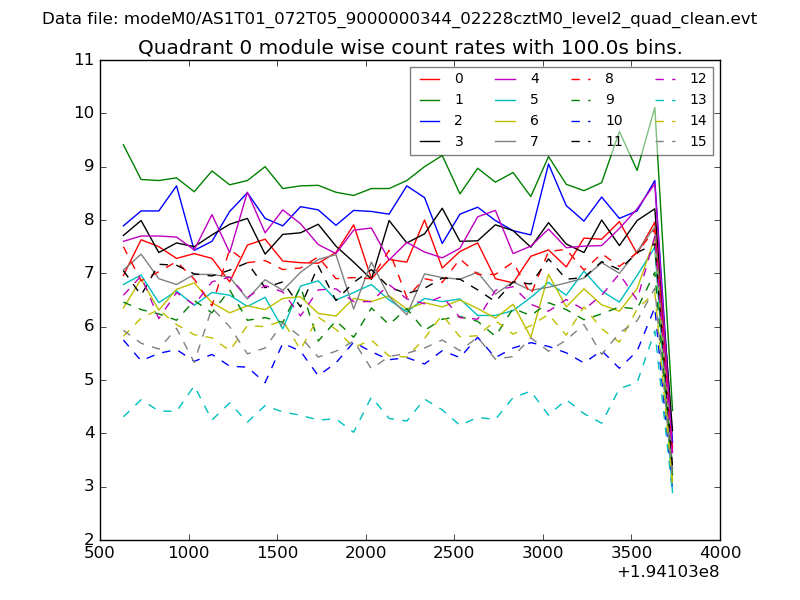 |
 |
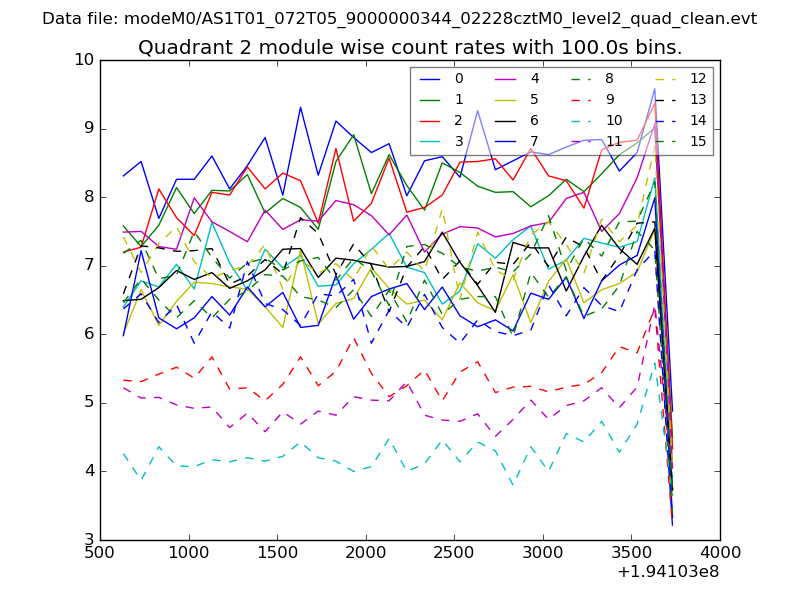
| Module-wise count rates for Quadrant B Data is divided into 100 sec bins |
 |
 |
| Module-wise count rates for Quadrant C Data is divided into 100 sec bins |
 |
 |
| Module-wise count rates for Quadrant D Data is divided into 100 sec bins |
 |
 |
| Parameter | Plot |
|---|---|
| CZT HV Monitor | 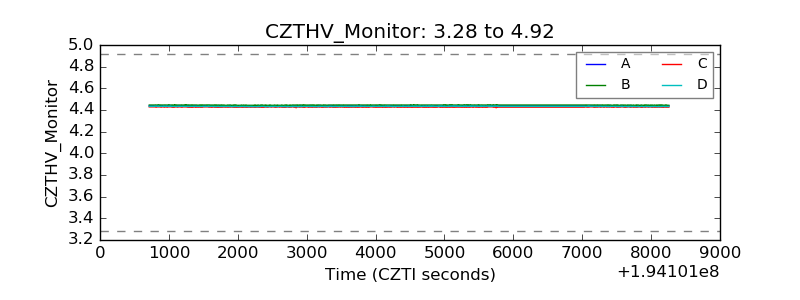 |
| D_VDD | 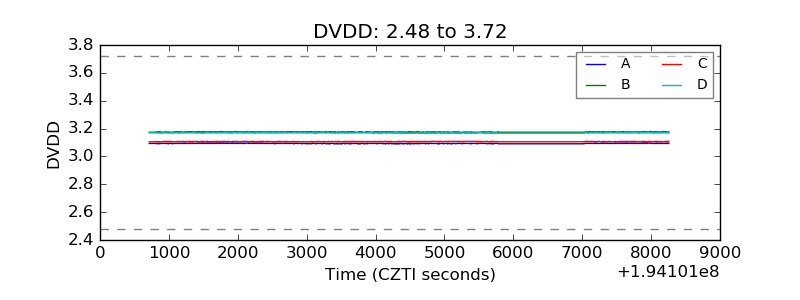 |
| Temperature 1 | 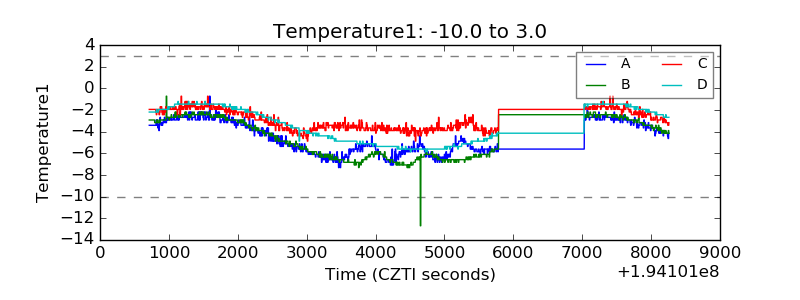 |
| Veto HV Monitor | 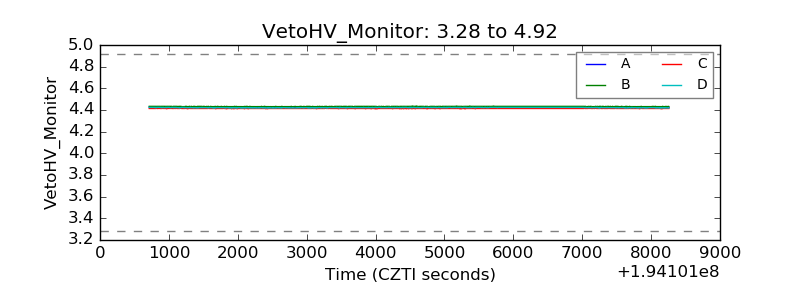 |
| Veto LLD | 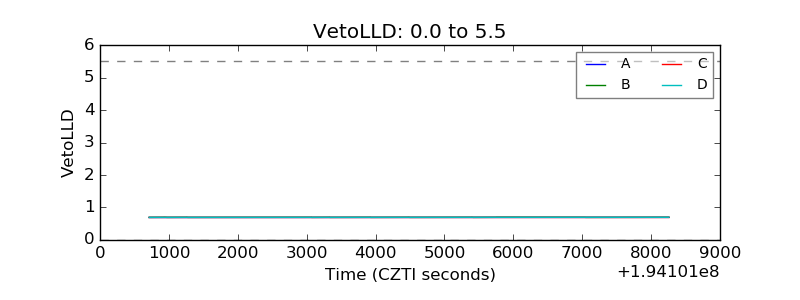 |
| Alpha Counter | 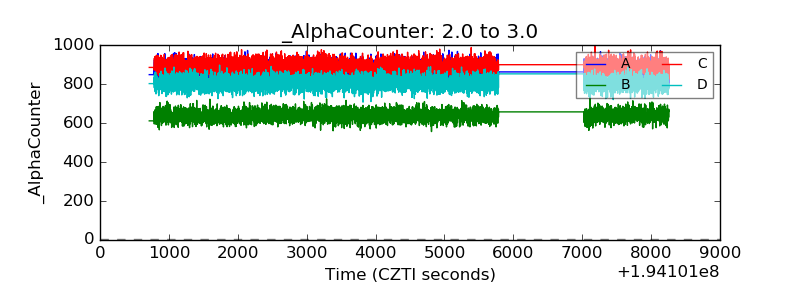 |
| _CPM_Rate | 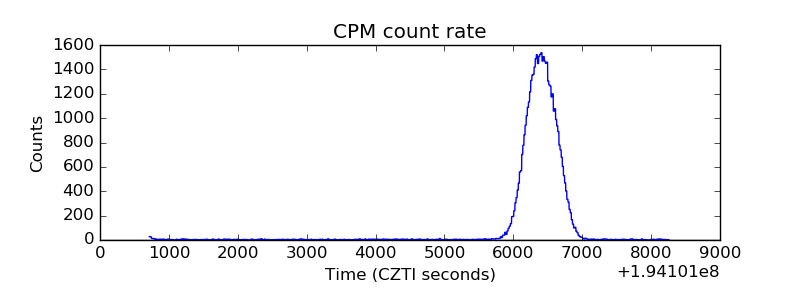 |
| CZT Counter | 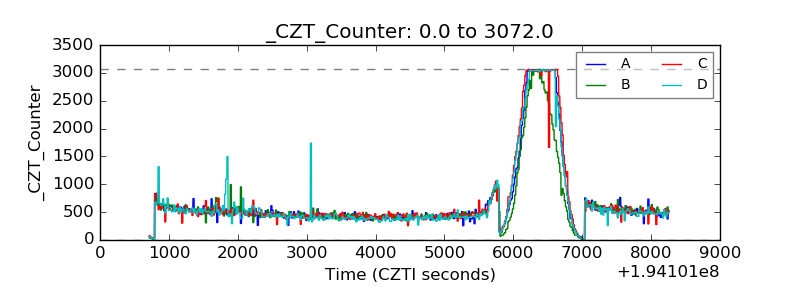 |
| +2.5 Volts monitor | 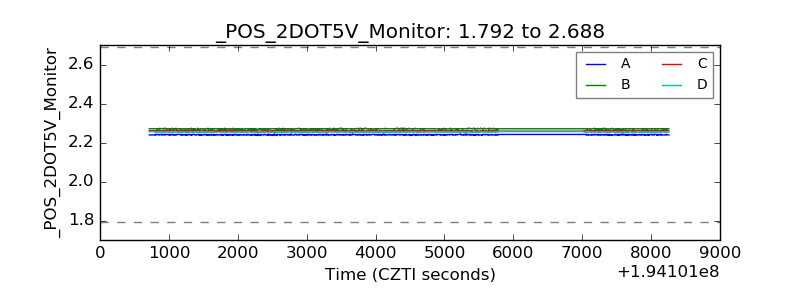 |
| +5 Volts monitor | 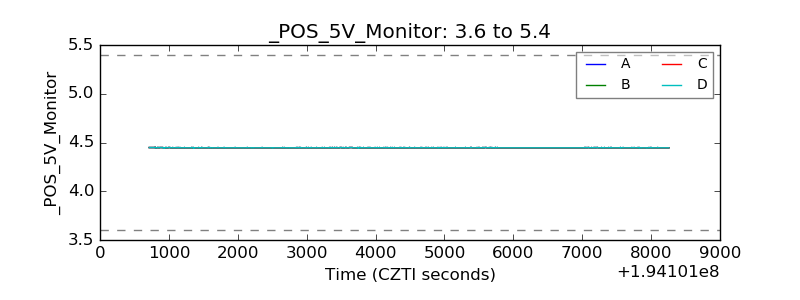 |
| _ROLL_ROT | 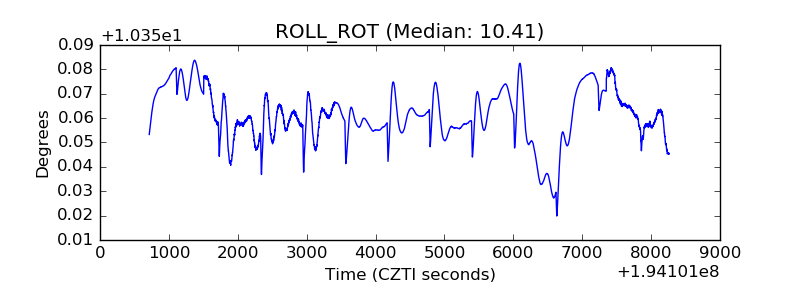 |
| _Roll_DEC | 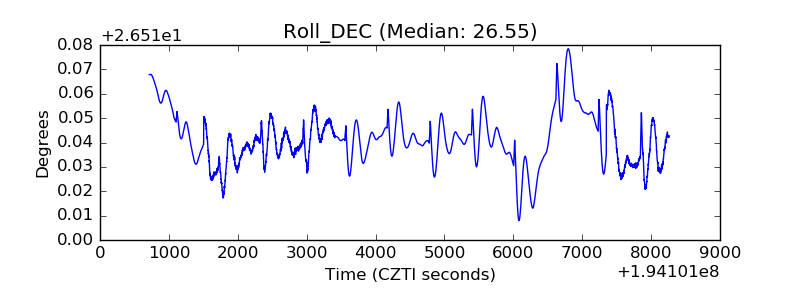 |
| _Roll_RA | 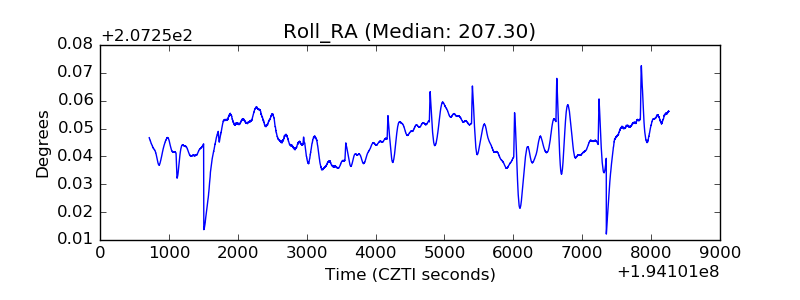 |
| Veto Counter | 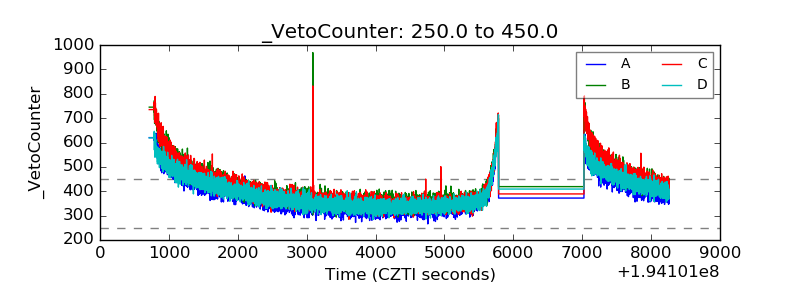 |