| Param | Original file | Final file |
|---|---|---|
| Filename | modeM0/AS1T01_072T05_9000000344_02231cztM0_level2.evt | modeM0/AS1T01_072T05_9000000344_02231cztM0_level2_quad_clean.evt |
| Size (bytes) | 400,256,640 | 76,521,600 |
| Size | 381.7 MB | 73.0 MB |
| Events in quadrant A | 2,915,622 | 464,311 |
| Events in quadrant B | 2,974,156 | 469,826 |
| Events in quadrant C | 2,962,034 | 467,899 |
| Events in quadrant D | 2,825,754 | 459,850 |
| Mode SS | |||
|---|---|---|---|
| Quadrant | BADHDUFLAG | Total packets | Discarded packets |
| A | 0 | 130 | 0 |
| B | 0 | 130 | 0 |
| C | 0 | 130 | 0 |
| D | 0 | 130 | 0 |
| Mode M0 | |||
|---|---|---|---|
| Quadrant | BADHDUFLAG | Total packets | Discarded packets |
| A | 0 | 13362 | 2 |
| B | 0 | 13405 | 2 |
| C | 0 | 13441 | 2 |
| D | 0 | 13429 | 2 |
| Mode M9 | |||
|---|---|---|---|
| Quadrant | BADHDUFLAG | Total packets | Discarded packets |
| A | 0 | 1 | 0 |
| B | 1 | 1 | 0 |
| C | 1 | -1 | -1 |
| D | 1 | -1 | -1 |
| Quadrant | Total seconds | Saturated seconds | Saturation percentage |
|---|---|---|---|
| A | 6527 | 36 | 0.551555% |
| B | 6527 | 38 | 0.582197% |
| C | 6527 | 35 | 0.536234% |
| D | 6527 | 19 | 0.291099% |
Noise dominated data is calculated using 1-second bins in cleaned event files. If a bin has >2000 counts, and if more than 50% of those come from <1% of pixels, then it is considered to be noise-dominated and hence unusable.
| Quadrant | # 1 sec bins | Bins with >0 counts | Bins with >2000 counts | High rate bins dominated by noise | Noise dominated (total time) | Noise dominated (detector-on time) | Marked lightcurve |
|---|---|---|---|---|---|---|---|
| A | 7462 | 6528 | 0 | 0 | 0.00% | 0.00% | 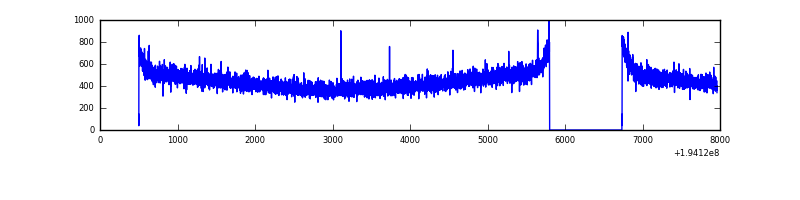 |
| B | 7462 | 6528 | 0 | 0 | 0.00% | 0.00% | 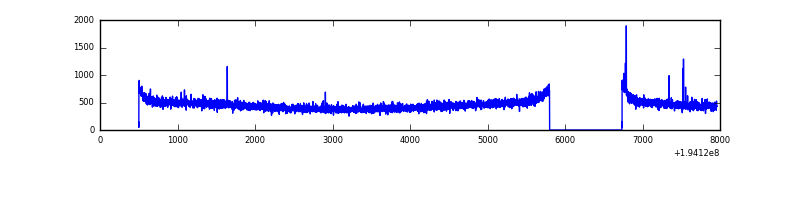 |
| C | 7462 | 6528 | 5 | 5 | 0.07% | 0.08% | 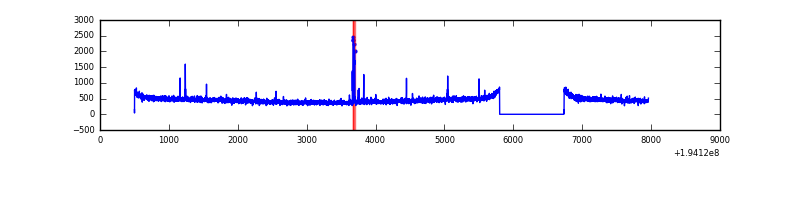 |
| D | 7462 | 6528 | 0 | 0 | 0.00% | 0.00% | 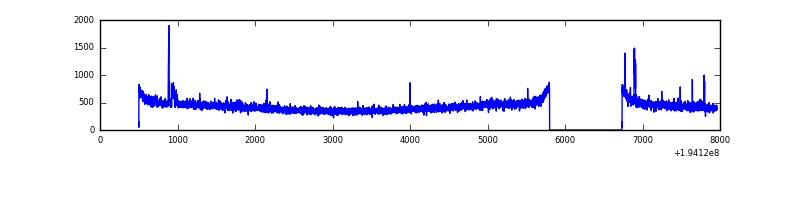 |
Top three noisy pixels from each quadrant. If the there are fewer than three noisy pixels in the level2.evt file, extra rows are filled as -1
| Pixel properties | Quadrant properties | ||||||
|---|---|---|---|---|---|---|---|
| Quadrant | DetID | PixID | Counts | Sigma | Mean | Median | Sigma |
| A | 12 | 194 | 8389 | 49.08 | 756 | 739 | 155.9 |
| A | 0 | 226 | 8184 | 47.77 | 756 | 739 | 155.9 |
| A | 3 | 1 | 4898 | 26.69 | 756 | 739 | 155.9 |
| B | 12 | 111 | 10902 | 68.48 | 769 | 749 | 148.3 |
| B | 11 | 111 | 9310 | 57.74 | 769 | 749 | 148.3 |
| B | 8 | 61 | 7780 | 47.42 | 769 | 749 | 148.3 |
| C | 10 | 34 | 29095 | 160.87 | 743 | 745 | 176.2 |
| C | 1 | 192 | 14056 | 75.53 | 743 | 745 | 176.2 |
| C | 13 | 61 | 6731 | 33.97 | 743 | 745 | 176.2 |
| D | 2 | 63 | 20658 | 113.71 | 732 | 714 | 175.4 |
| D | 2 | 31 | 13539 | 73.12 | 732 | 714 | 175.4 |
| D | 15 | 194 | 13513 | 72.97 | 732 | 714 | 175.4 |
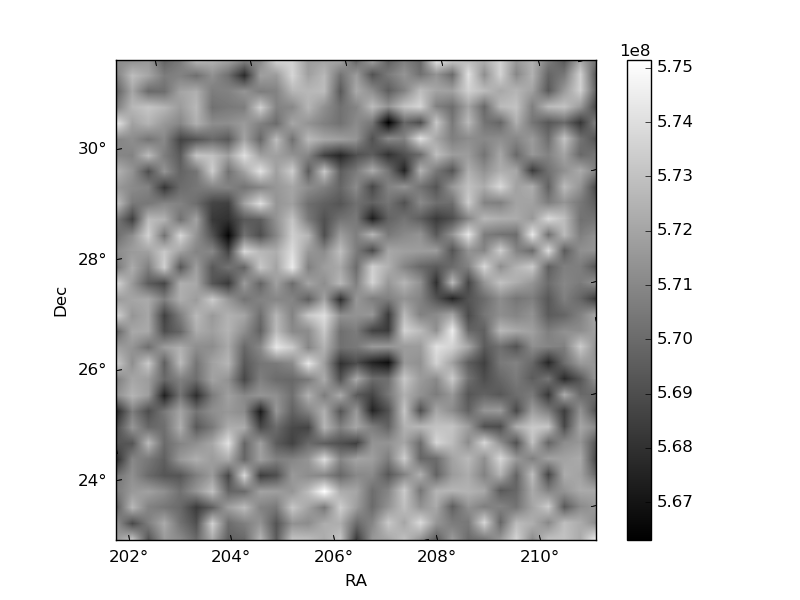
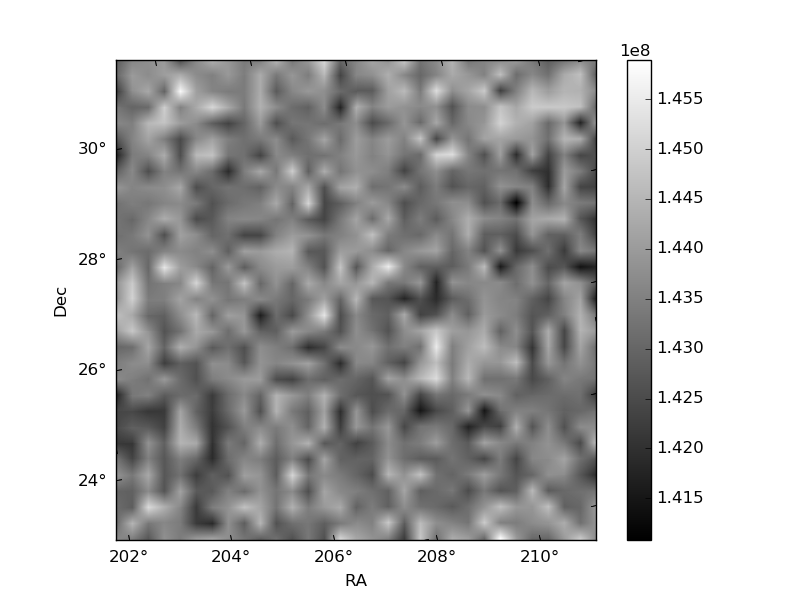
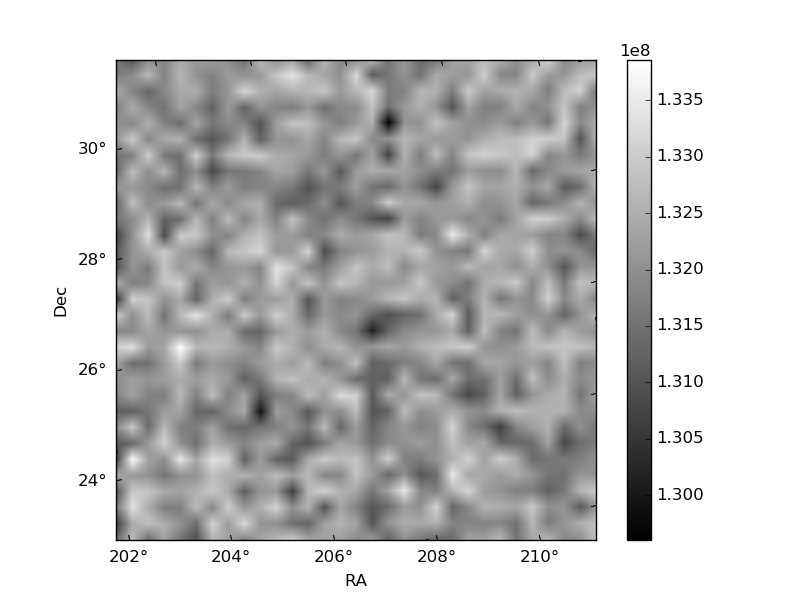
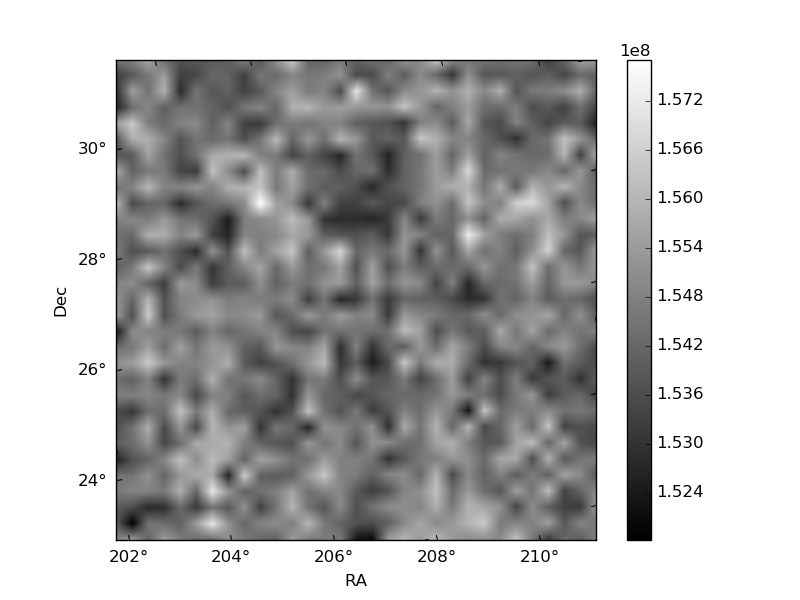
Histogram calculated using DETX and DETY for each event in the final _common_clean file
| Quadrant A | 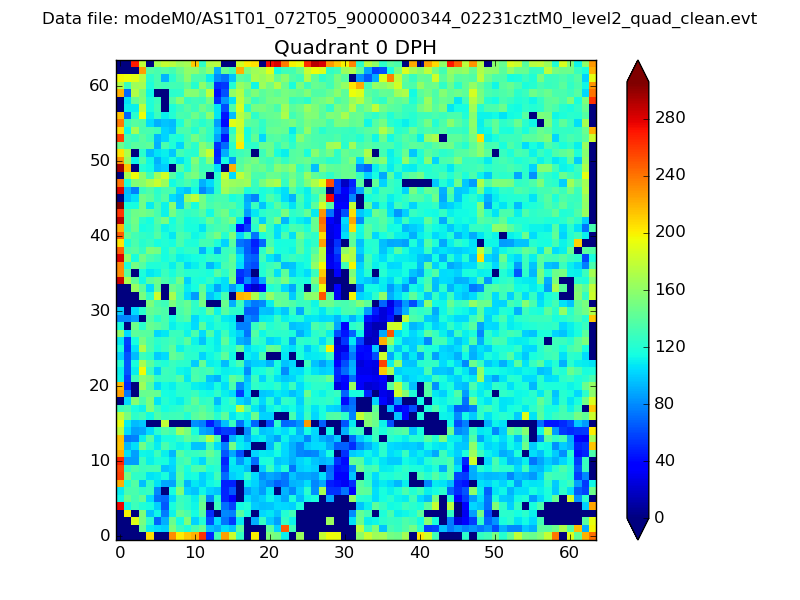 |
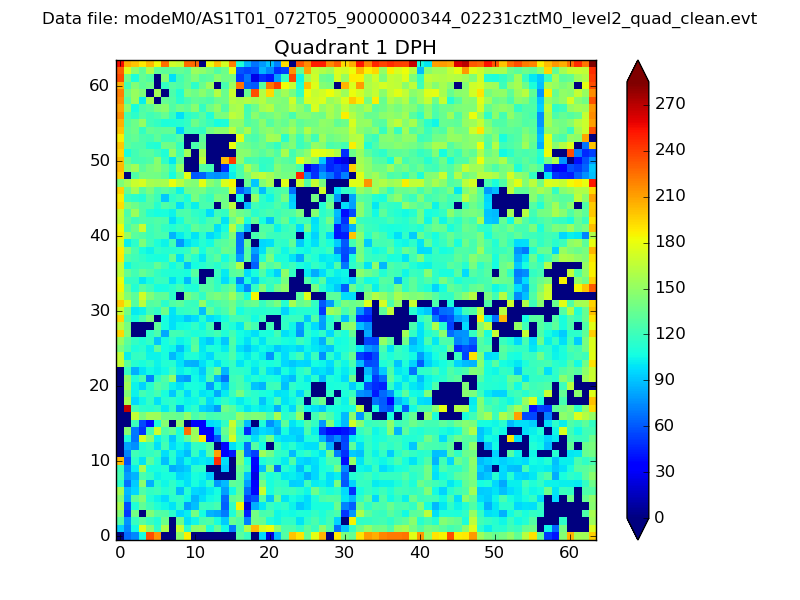 |
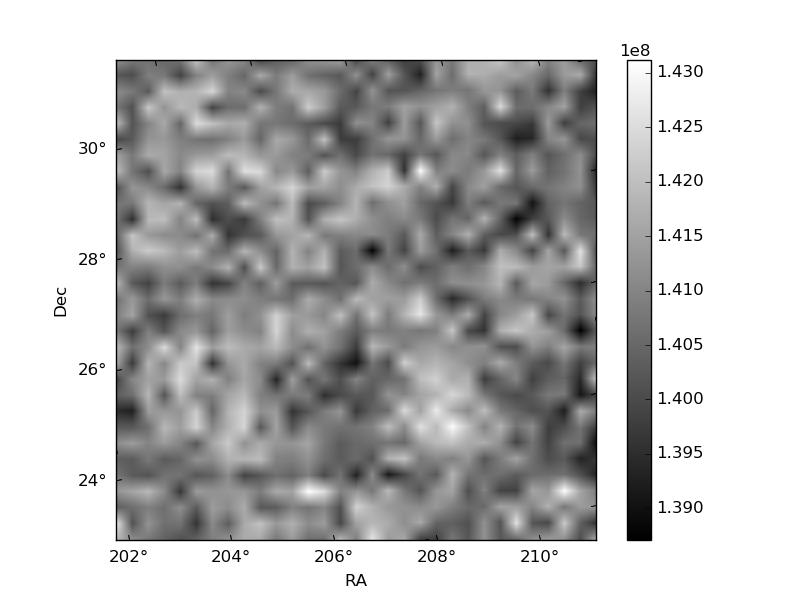
Quadrant B |
|---|---|---|---|
| Quadrant D | 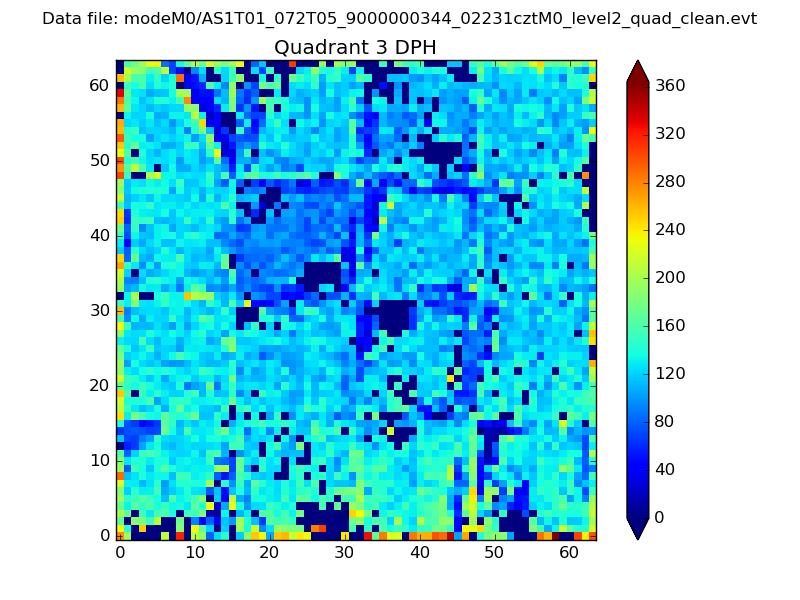 |
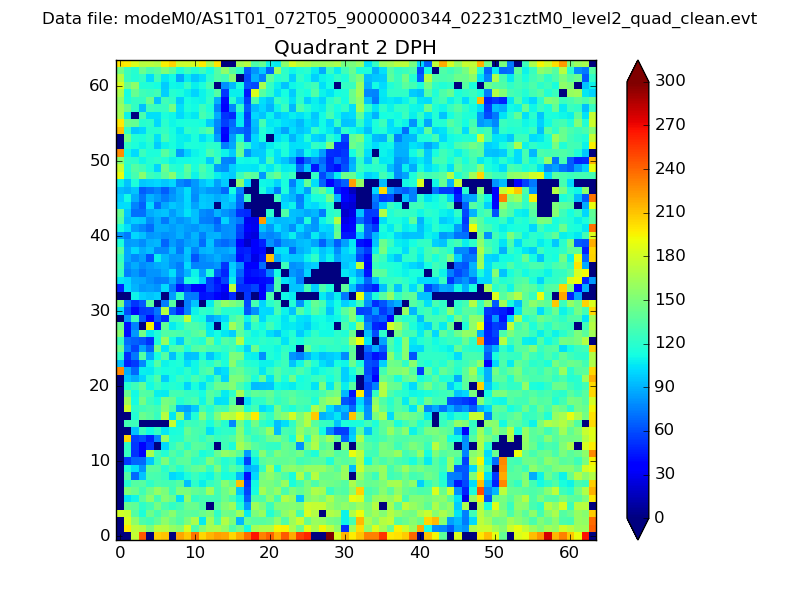 |
Quadrant C |
| Plot type | Count rate plots | Images |
|---|---|---|
| Comparison with Poisson distribution Blue bars denote a histogram of data divided into 1 sec bins. Red curve is a Poisson curve with rate = median count rate of data. |
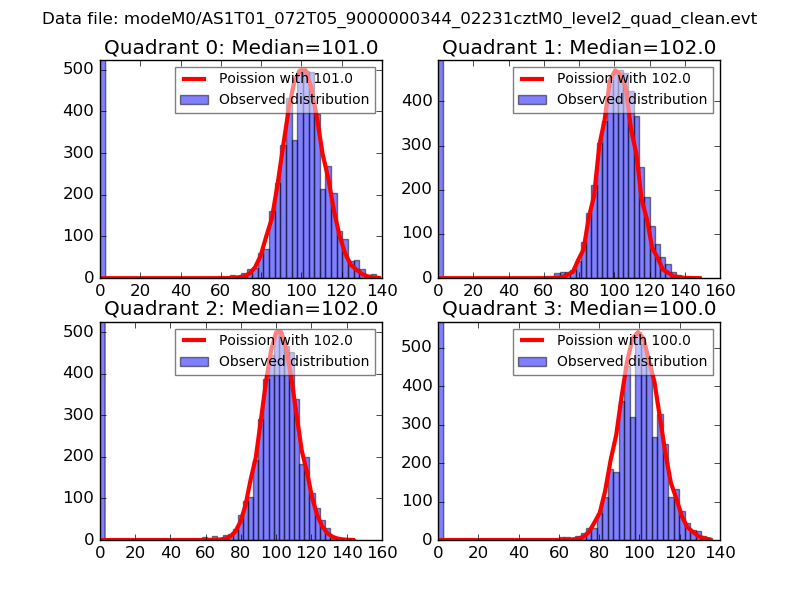 |
 |
| Quadrant-wise count rates Data is divided into 100 sec bins |
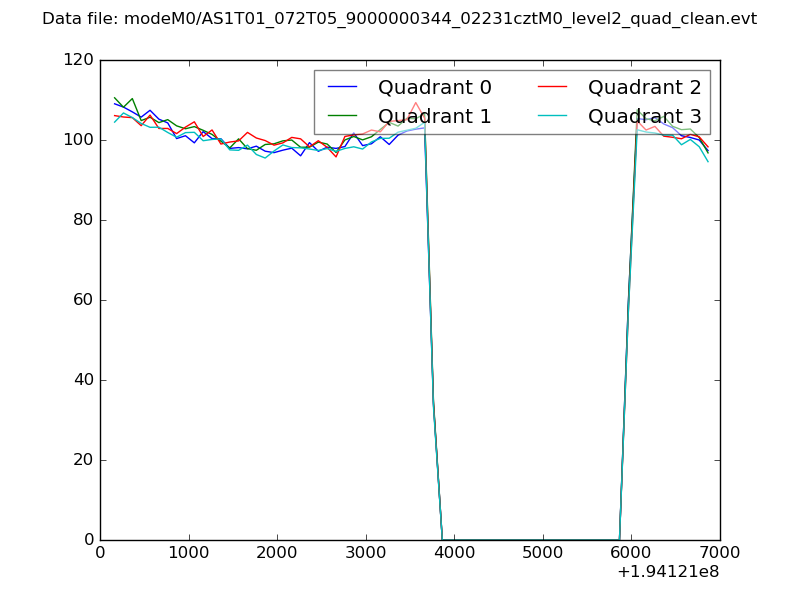 |
|
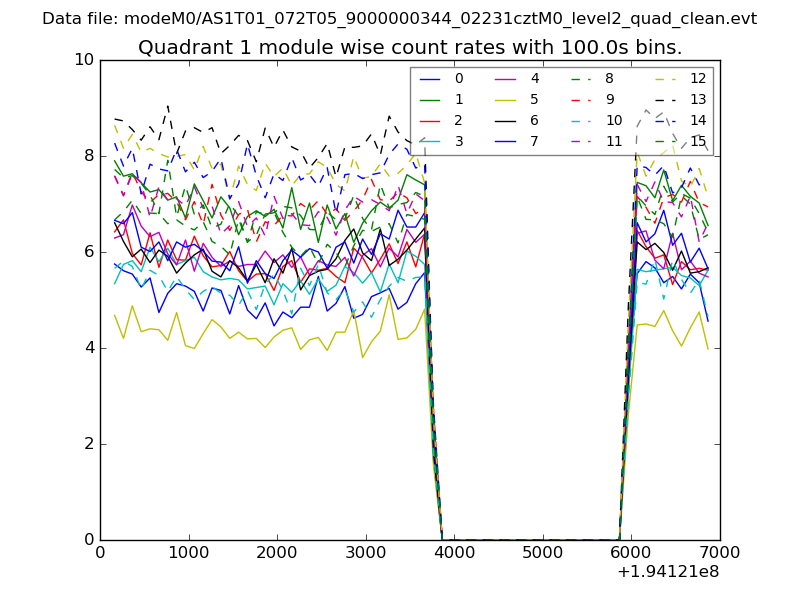
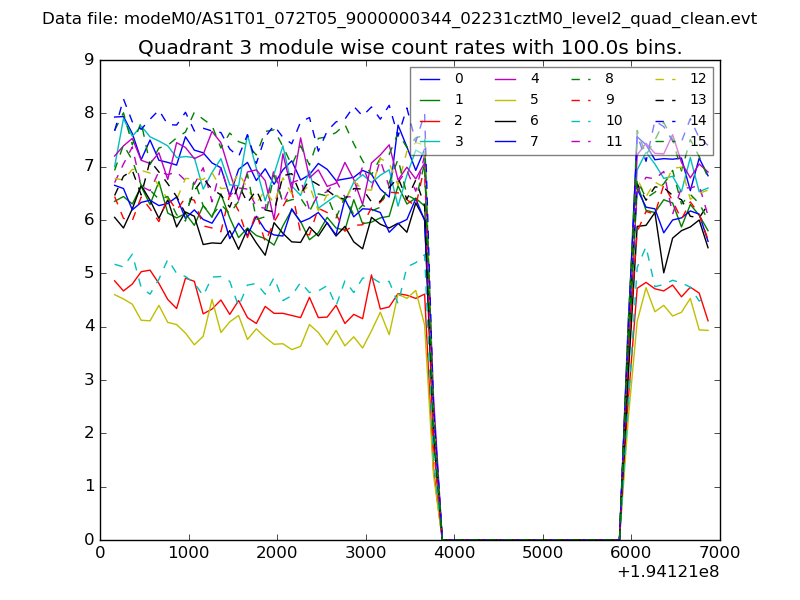
| Module-wise count rates for Quadrant A Data is divided into 100 sec bins |
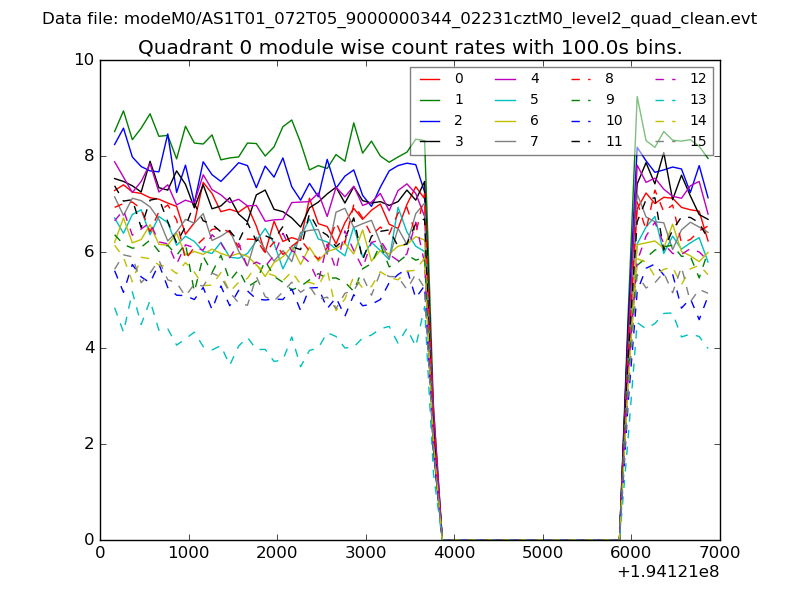 |
 |
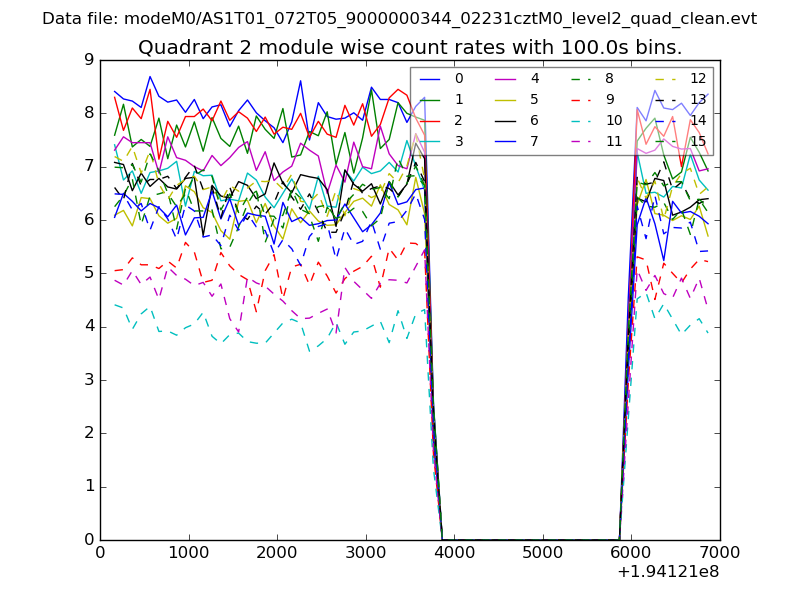
| Module-wise count rates for Quadrant B Data is divided into 100 sec bins |
 |
 |
| Module-wise count rates for Quadrant C Data is divided into 100 sec bins |
 |
 |
| Module-wise count rates for Quadrant D Data is divided into 100 sec bins |
 |
 |
| Parameter | Plot |
|---|---|
| CZT HV Monitor | 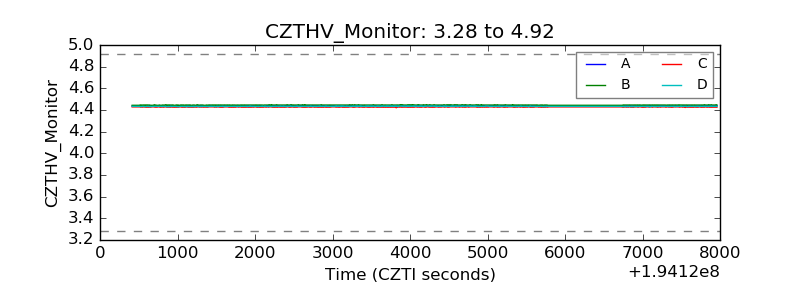 |
| D_VDD | 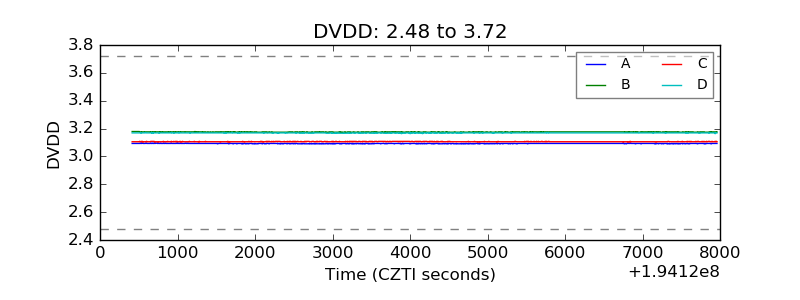 |
| Temperature 1 | 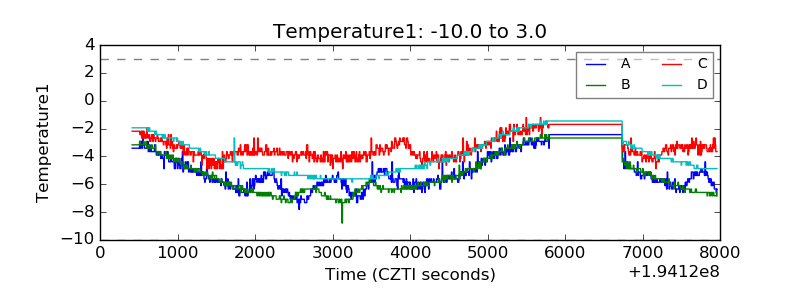 |
| Veto HV Monitor | 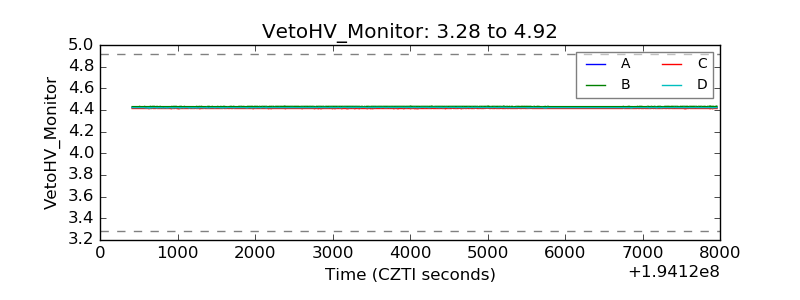 |
| Veto LLD | 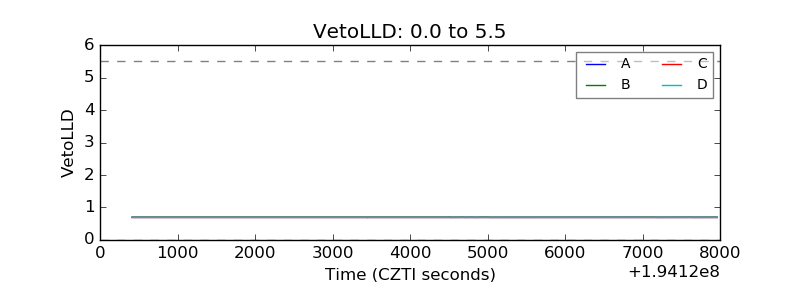 |
| Alpha Counter | 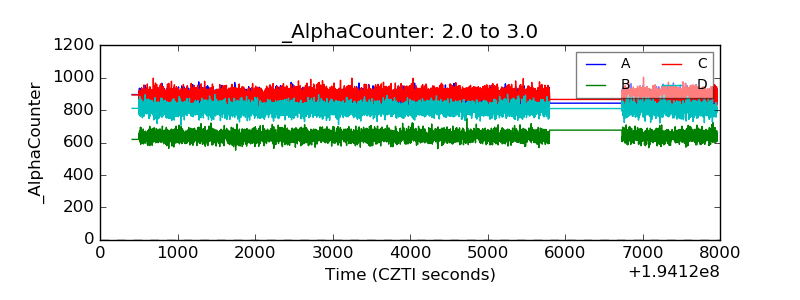 |
| _CPM_Rate | 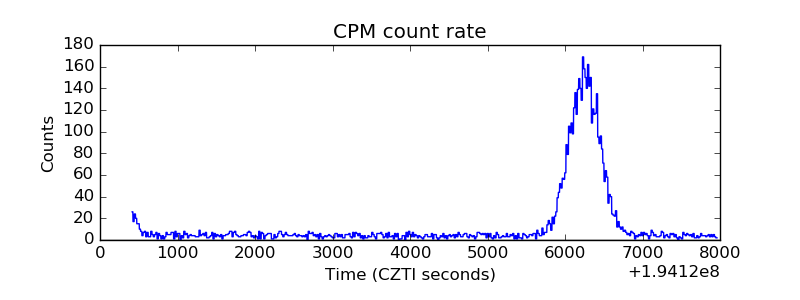 |
| CZT Counter | 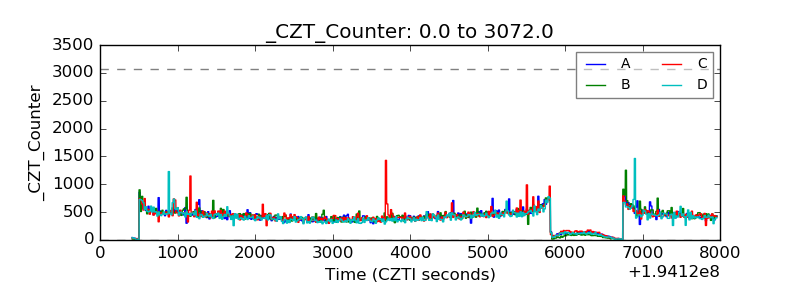 |
| +2.5 Volts monitor | 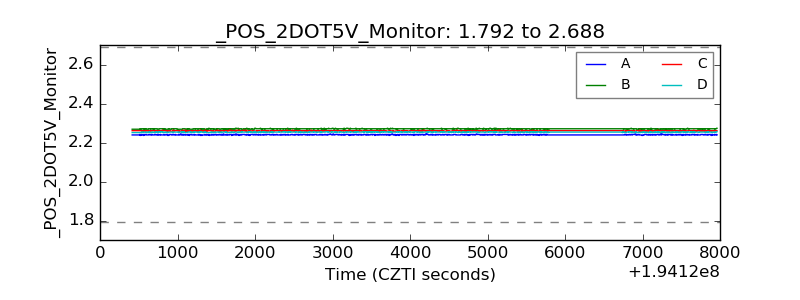 |
| +5 Volts monitor | 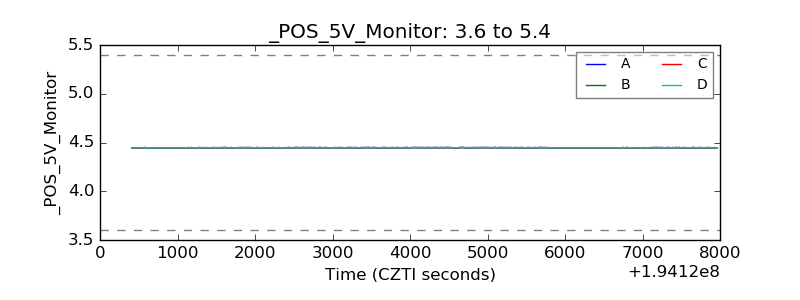 |
| _ROLL_ROT | 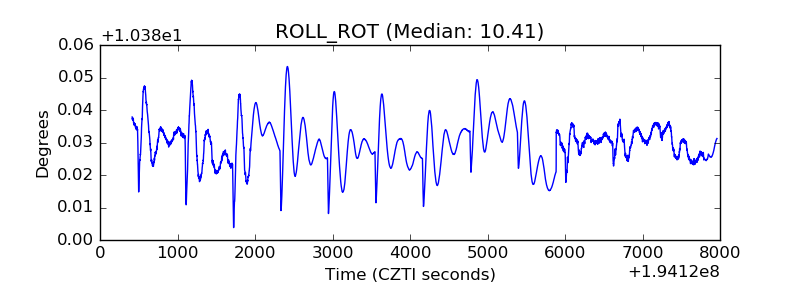 |
| _Roll_DEC | 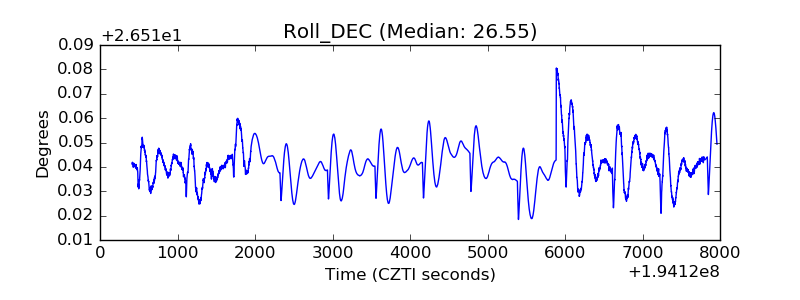 |
| _Roll_RA | 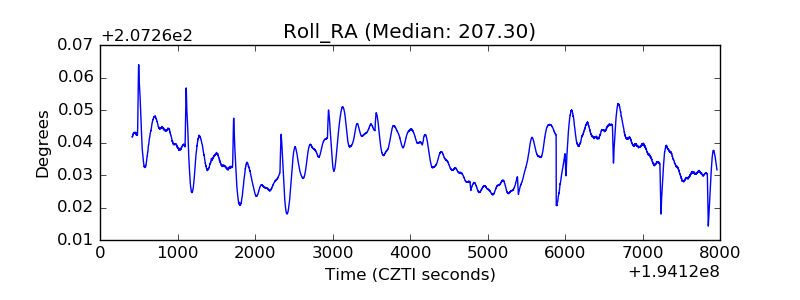 |
| Veto Counter | 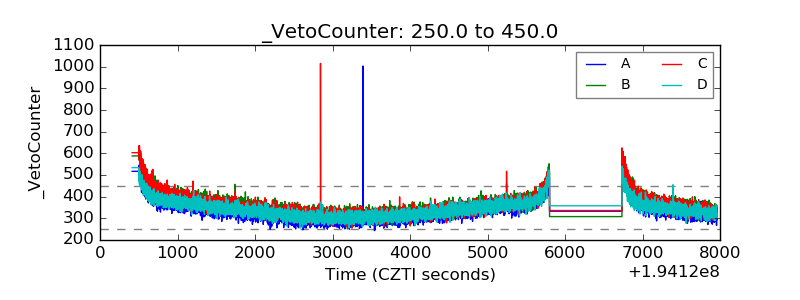 |