| Param | Original file | Final file |
|---|---|---|
| Filename | modeM0/AS1G02_018T08_9000000346cztM0_level2.fits | modeM0/AS1G02_018T08_9000000346cztM0_level2_quad_clean.evt |
| Size (bytes) | 1,236,479,040 | 1,322,919,360 |
| Size | 1.2 GB | 1.2 GB |
| Events in quadrant A | 7,751,538 | 8,348,116 |
| Events in quadrant B | 7,560,692 | 8,408,801 |
| Events in quadrant C | 7,663,972 | 8,117,705 |
| Events in quadrant D | 5,152,412 | 5,877,331 |
| Mode SS | |||
|---|---|---|---|
| Quadrant | BADHDUFLAG | Total packets | Discarded packets |
| A | 0 | 2850 | 0 |
| B | 0 | 2865 | 0 |
| C | 0 | 2866 | 0 |
| D | 0 | 2860 | 0 |
| Mode M0 | |||
|---|---|---|---|
| Quadrant | BADHDUFLAG | Total packets | Discarded packets |
| A | 0 | 294700 | 0 |
| B | 0 | 298398 | 0 |
| C | 0 | 298860 | 0 |
| D | 0 | 269801 | 0 |
| Mode M9 | |||
|---|---|---|---|
| Quadrant | BADHDUFLAG | Total packets | Discarded packets |
| A | 1 | 139846569322536 | 139844135157806 |
| B | 1 | 139846569322536 | 139844135157806 |
| C | 1 | 139846569322536 | 139844135157806 |
| D | 1 | 139846569322536 | 139844135157806 |
| Quadrant | Total seconds | Saturated seconds | Saturation percentage |
|---|---|---|---|
| A | 142909 | 1520 | 1.063614% |
| B | 142902 | 1818 | 1.272201% |
| C | 142851 | 1258 | 0.880638% |
| D | 113249 | 3328 | 2.938657% |
Noise dominated data is calculated using 1-second bins in cleaned event files. If a bin has >2000 counts, and if more than 50% of those come from <1% of pixels, then it is considered to be noise-dominated and hence unusable.
| Quadrant | # 1 sec bins | Bins with >0 counts | Bins with >2000 counts | High rate bins dominated by noise | Noise dominated (total time) | Noise dominated (detector-on time) | Marked lightcurve |
|---|---|---|---|---|---|---|---|
| A | 177879 | 143161 | 0 | 0 | 0.00% | 0.00% |  |
| B | 177879 | 143140 | 0 | 0 | 0.00% | 0.00% |  |
| C | 177879 | 143086 | 0 | 0 | 0.00% | 0.00% |  |
| D | 177878 | 113466 | 0 | 0 | 0.00% | 0.00% |  |
Top three noisy pixels from each quadrant. If the there are fewer than three noisy pixels in the level2.evt file, extra rows are filled as -1
| Pixel properties | Quadrant properties | ||||||
|---|---|---|---|---|---|---|---|
| Quadrant | DetID | PixID | Counts | Sigma | Mean | Median | Sigma |
| A | 0 | 29 | 7236 | 10.13 | 2016 | 1870 | 529.7 |
| A | 7 | 110 | 6671 | 9.06 | 2016 | 1870 | 529.7 |
| A | 14 | 79 | 5714 | 7.26 | 2016 | 1870 | 529.7 |
| B | 2 | 9 | 6760 | 12.54 | 1987 | 1883 | 388.8 |
| B | 12 | 226 | 5845 | 10.19 | 1987 | 1883 | 388.8 |
| B | 14 | 254 | 5360 | 8.94 | 1987 | 1883 | 388.8 |
| C | 3 | 158 | 5130 | 5.99 | 2030 | 1870 | 544.6 |
| C | 9 | 188 | 5099 | 5.93 | 2030 | 1870 | 544.6 |
| C | 9 | 242 | 5057 | 5.85 | 2030 | 1870 | 544.6 |
| D | 3 | 14 | 3904 | 6.25 | 1469 | 1327 | 412.2 |
| D | 6 | 231 | 3751 | 5.88 | 1469 | 1327 | 412.2 |
| D | 11 | 82 | 3727 | 5.82 | 1469 | 1327 | 412.2 |
Histogram calculated using DETX and DETY for each event in the final _common_clean file
| Quadrant A | 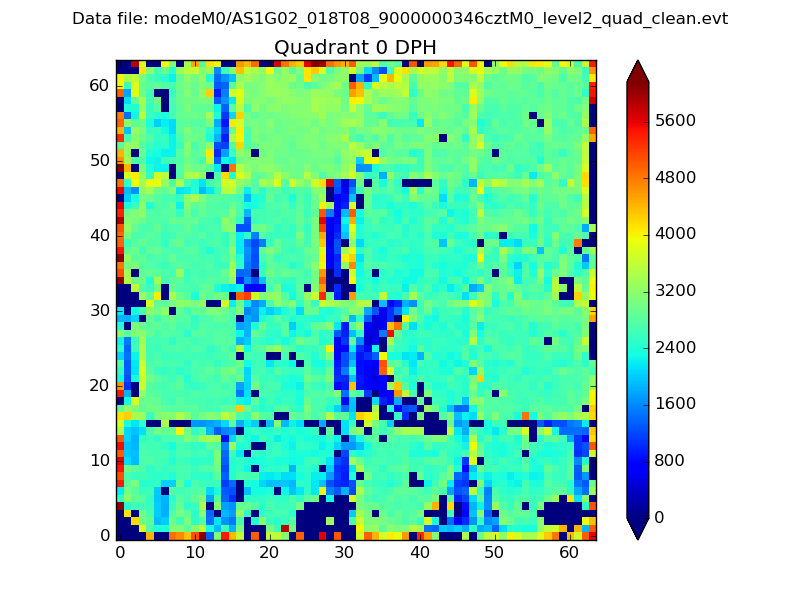 |
 |
Quadrant B |
|---|---|---|---|
| Quadrant D |  |
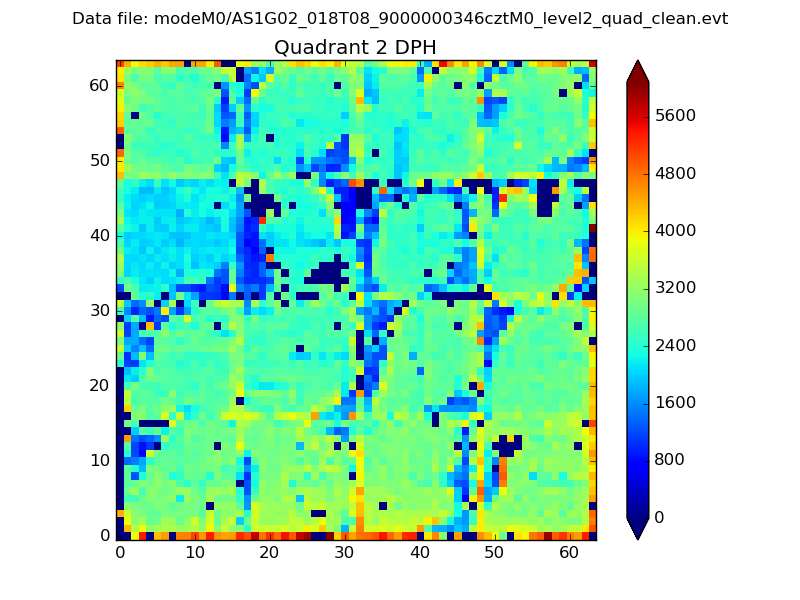 |
Quadrant C |
| Plot type | Count rate plots | Images |
|---|---|---|
| Comparison with Poisson distribution Blue bars denote a histogram of data divided into 1 sec bins. Red curve is a Poisson curve with rate = median count rate of data. |
 |
 |
| Quadrant-wise count rates Data is divided into 100 sec bins |
 |
|
| Module-wise count rates for Quadrant A Data is divided into 100 sec bins |
 |
 |
| Module-wise count rates for Quadrant B Data is divided into 100 sec bins |
 |
 |
| Module-wise count rates for Quadrant C Data is divided into 100 sec bins |
 |
 |
| Module-wise count rates for Quadrant D Data is divided into 100 sec bins |
 |
 |
| Parameter | Plot |
|---|---|
| CZT HV Monitor |  |
| D_VDD |  |
| Temperature 1 |  |
| Veto HV Monitor |  |
| Veto LLD |  |
| Alpha Counter |  |
| _CPM_Rate |  |
| CZT Counter |  |
| +2.5 Volts monitor |  |
| +5 Volts monitor |  |
| _ROLL_ROT |  |
| _Roll_DEC |  |
| _Roll_RA |  |
| Veto Counter |  |