| Param | Original file | Final file |
|---|---|---|
| Filename | modeM0/AS1G02_018T08_9000000346_02261cztM0_level2.fits | modeM0/AS1G02_018T08_9000000346_02261cztM0_level2_quad_clean.evt |
| Size (bytes) | 398,260,800 | 127,388,160 |
| Size | 379.8 MB | 121.5 MB |
| Events in quadrant A | 3,590,633 | 843,704 |
| Events in quadrant B | 3,560,820 | 871,946 |
| Events in quadrant C | 3,643,667 | 831,152 |
| Events in quadrant D | 3,346,044 | 773,497 |
| Mode SS | |||
|---|---|---|---|
| Quadrant | BADHDUFLAG | Total packets | Discarded packets |
| A | 0 | 154 | 0 |
| B | 0 | 154 | 0 |
| C | 0 | 154 | 0 |
| D | 0 | 154 | 0 |
| Mode M0 | |||
|---|---|---|---|
| Quadrant | BADHDUFLAG | Total packets | Discarded packets |
| A | 0 | 16101 | 2 |
| B | 0 | 16012 | 2 |
| C | 0 | 16128 | 2 |
| D | 0 | 15819 | 2 |
| Mode M9 | |||
|---|---|---|---|
| Quadrant | BADHDUFLAG | Total packets | Discarded packets |
| A | 0 | 1 | 0 |
| B | 1 | 1 | 0 |
| C | 1 | -1 | -1 |
| D | 1 | -1 | -1 |
| Quadrant | Total seconds | Saturated seconds | Saturation percentage |
|---|---|---|---|
| A | 7721 | 40 | 0.518068% |
| B | 7721 | 46 | 0.595778% |
| C | 7721 | 36 | 0.466261% |
| D | 7721 | 19 | 0.246082% |
Noise dominated data is calculated using 1-second bins in cleaned event files. If a bin has >2000 counts, and if more than 50% of those come from <1% of pixels, then it is considered to be noise-dominated and hence unusable.
| Quadrant | # 1 sec bins | Bins with >0 counts | Bins with >2000 counts | High rate bins dominated by noise | Noise dominated (total time) | Noise dominated (detector-on time) | Marked lightcurve |
|---|---|---|---|---|---|---|---|
| A | 9161 | 7723 | 0 | 0 | 0.00% | 0.00% | 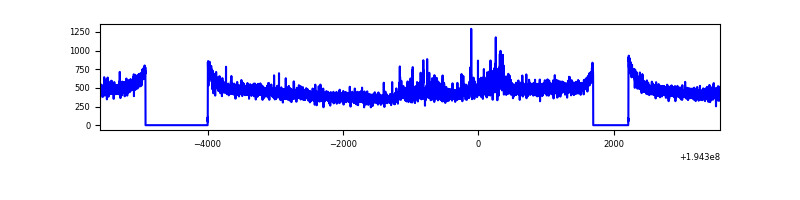 |
| B | 9161 | 7723 | 1 | 1 | 0.01% | 0.01% | 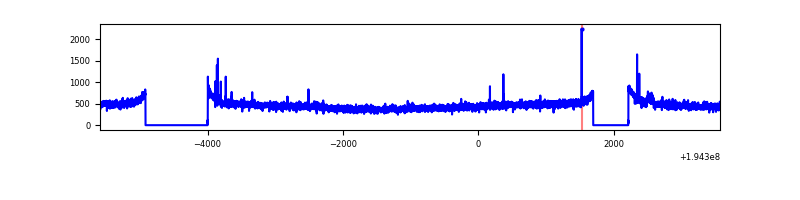 |
| C | 9161 | 7723 | 1 | 1 | 0.01% | 0.01% | 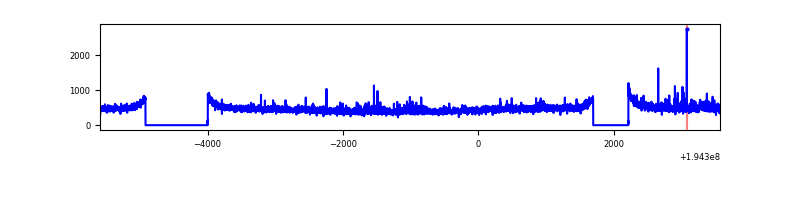 |
| D | 9161 | 7723 | 0 | 0 | 0.00% | 0.00% | 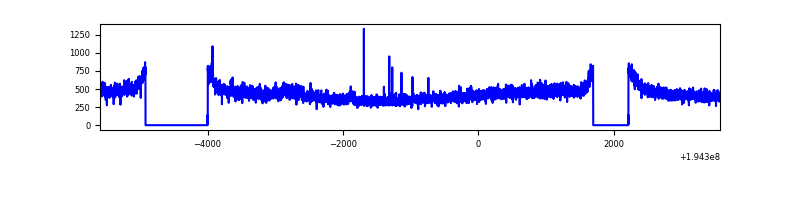 |
Top three noisy pixels from each quadrant. If the there are fewer than three noisy pixels in the level2.evt file, extra rows are filled as -1
| Pixel properties | Quadrant properties | ||||||
|---|---|---|---|---|---|---|---|
| Quadrant | DetID | PixID | Counts | Sigma | Mean | Median | Sigma |
| A | 0 | 8 | 113976 | 603.15 | 902 | 880 | 187.5 |
| A | 12 | 194 | 10256 | 50.0 | 902 | 880 | 187.5 |
| A | 0 | 226 | 9590 | 46.45 | 902 | 880 | 187.5 |
| B | 3 | 220 | 14127 | 74.69 | 918 | 892 | 177.2 |
| B | 12 | 111 | 13438 | 70.8 | 918 | 892 | 177.2 |
| B | 11 | 111 | 11410 | 59.35 | 918 | 892 | 177.2 |
| C | 5 | 234 | 123568 | 592.37 | 883 | 883 | 207.1 |
| C | 0 | 64 | 45280 | 214.36 | 883 | 883 | 207.1 |
| C | 2 | 53 | 10211 | 45.04 | 883 | 883 | 207.1 |
| D | 9 | 66 | 29992 | 139.77 | 871 | 848 | 208.5 |
| D | 15 | 194 | 15818 | 71.79 | 871 | 848 | 208.5 |
| D | 14 | 226 | 9795 | 42.91 | 871 | 848 | 208.5 |
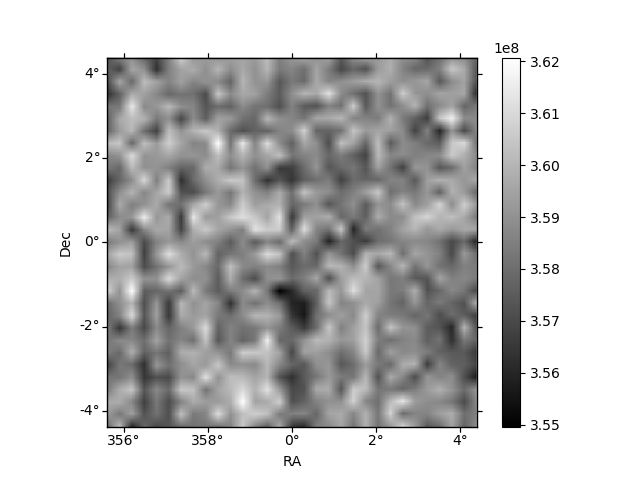
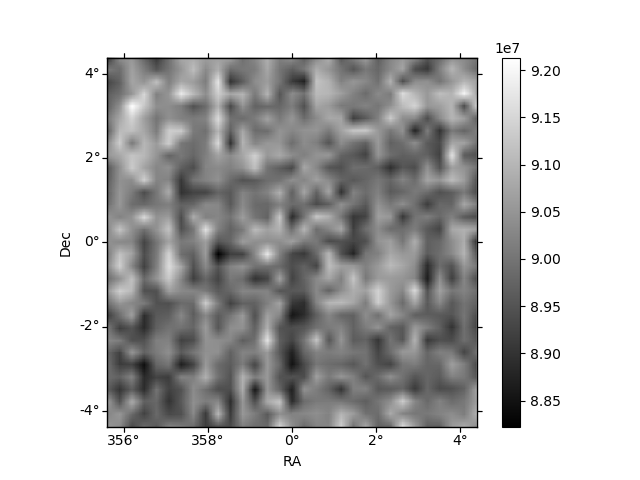
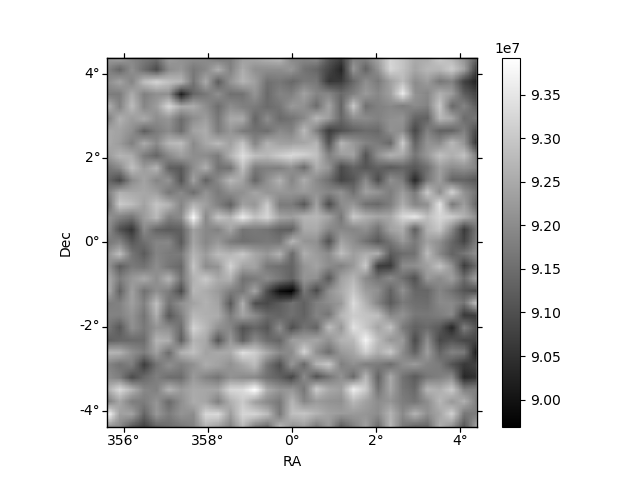
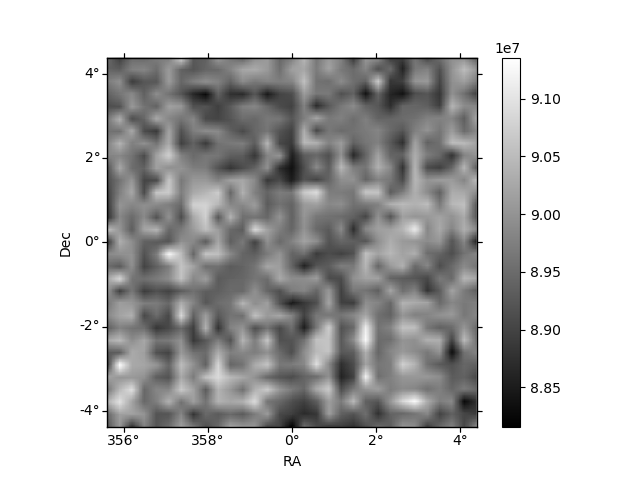
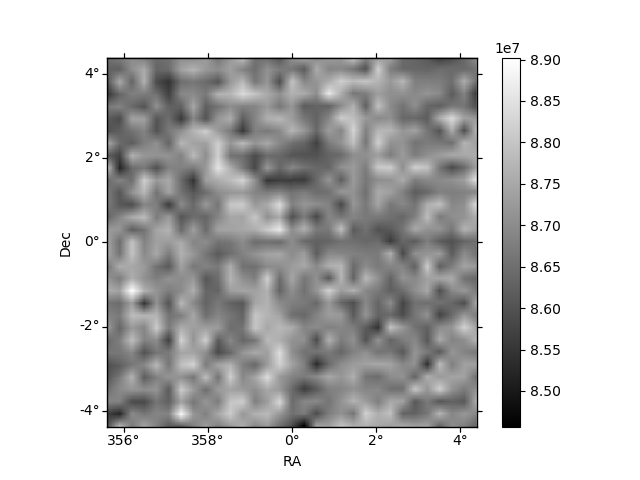
Histogram calculated using DETX and DETY for each event in the final _common_clean file
| Quadrant A | 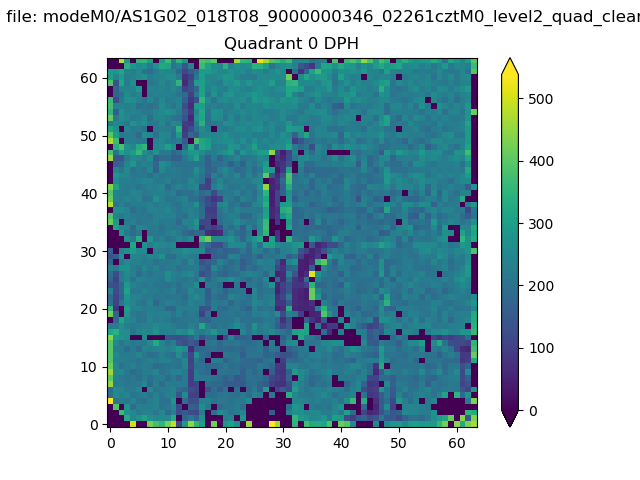 |
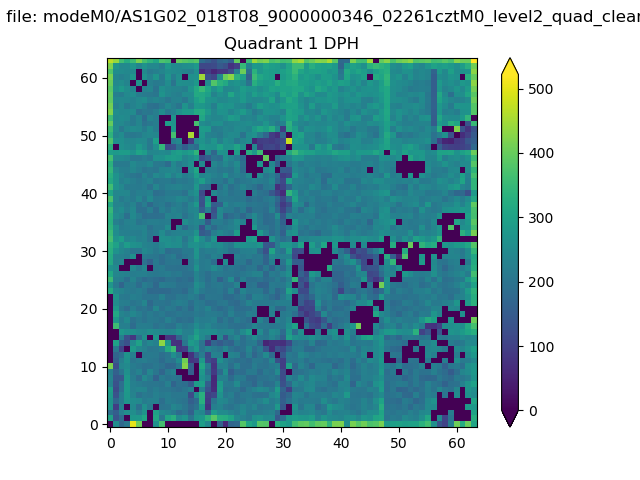 |
Quadrant B |
|---|---|---|---|
| Quadrant D | 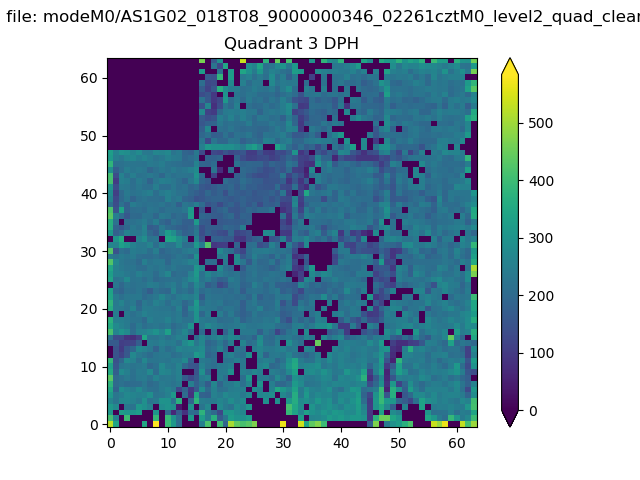 |
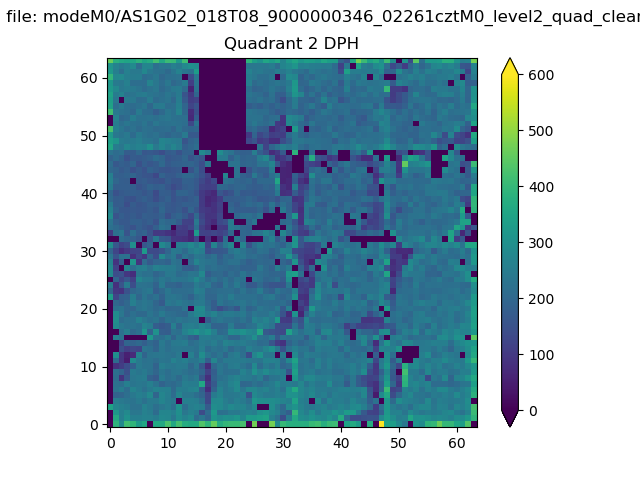 |
Quadrant C |
| Plot type | Count rate plots | Images |
|---|---|---|
| Comparison with Poisson distribution Blue bars denote a histogram of data divided into 1 sec bins. Red curve is a Poisson curve with rate = median count rate of data. |
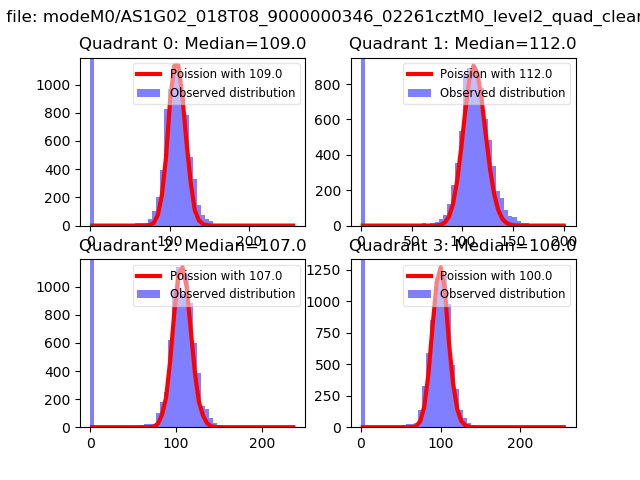 |
 |
| Quadrant-wise count rates Data is divided into 100 sec bins |
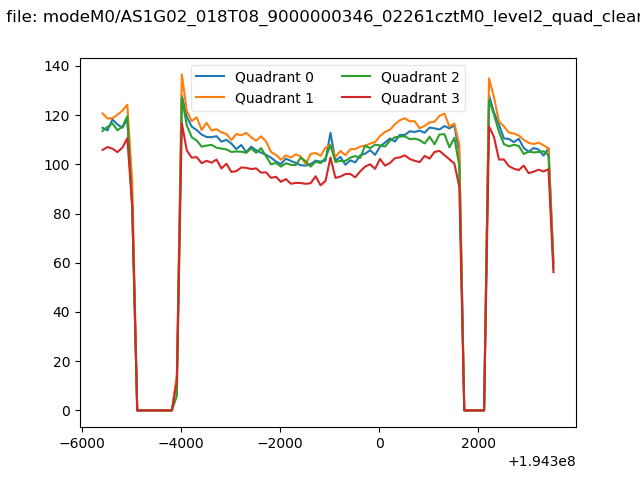 |
|
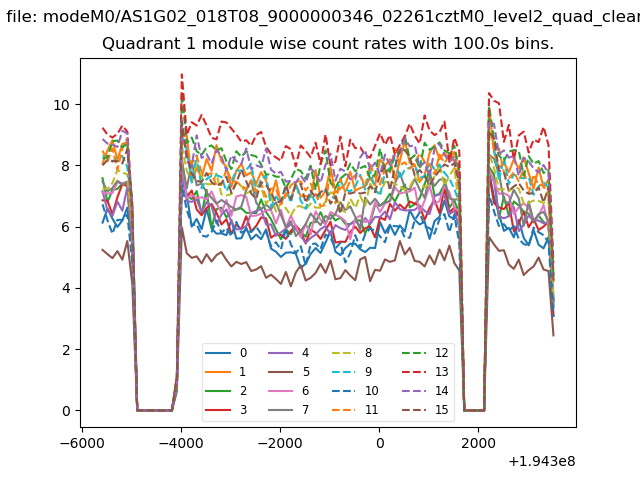
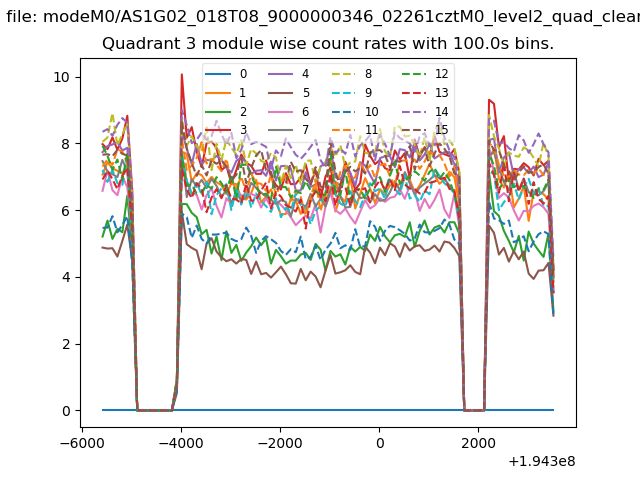
| Module-wise count rates for Quadrant A Data is divided into 100 sec bins |
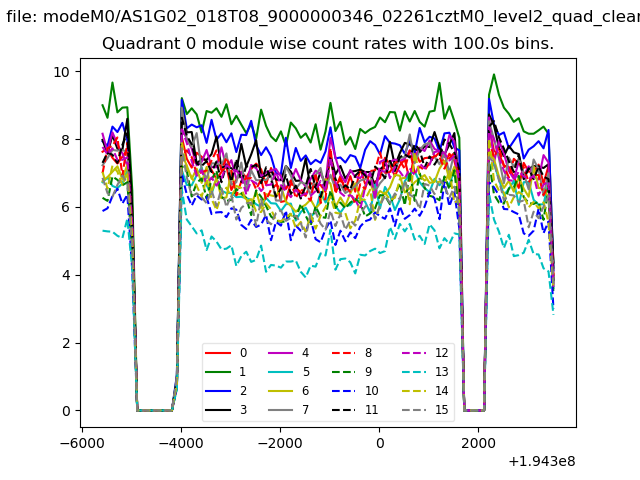 |
 |
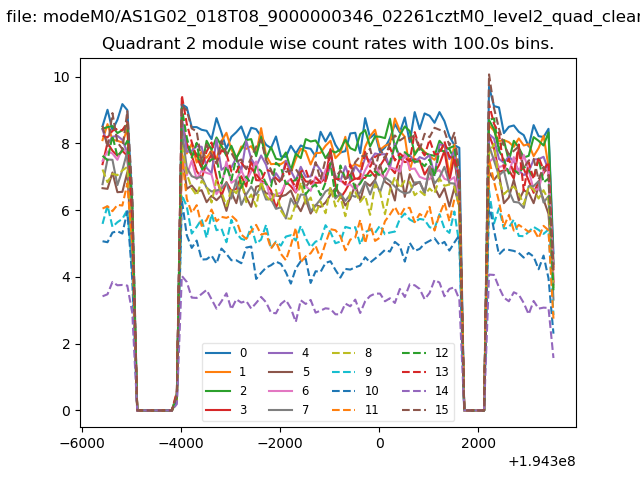
| Module-wise count rates for Quadrant B Data is divided into 100 sec bins |
 |
 |
| Module-wise count rates for Quadrant C Data is divided into 100 sec bins |
 |
 |
| Module-wise count rates for Quadrant D Data is divided into 100 sec bins |
 |
 |
| Parameter | Plot |
|---|---|
| CZT HV Monitor | 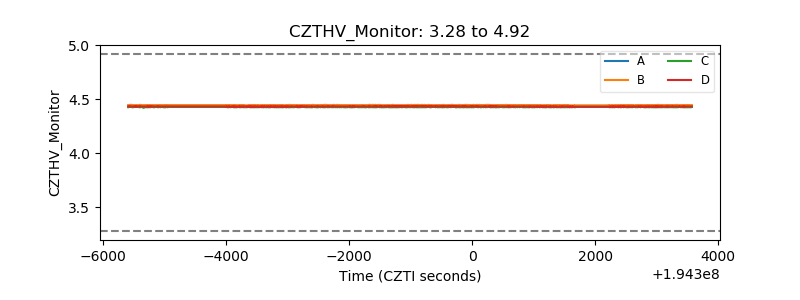 |
| D_VDD | 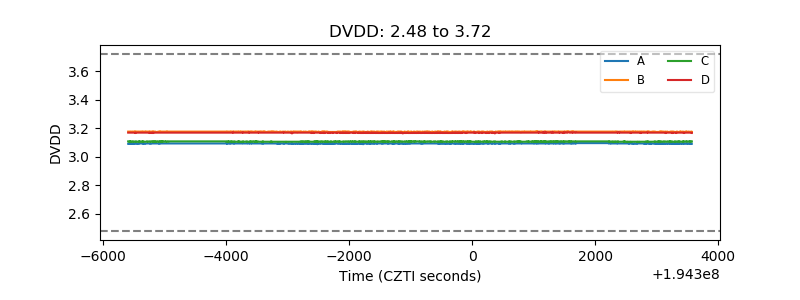 |
| Temperature 1 | 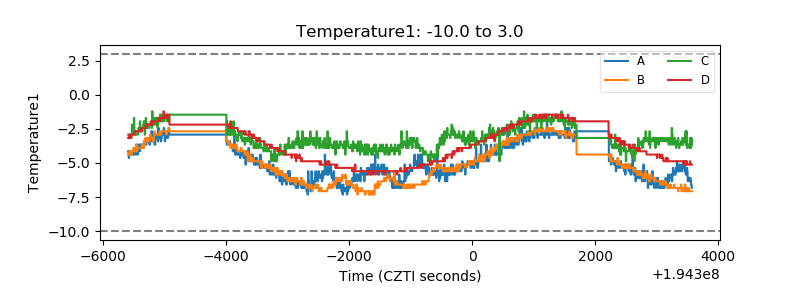 |
| Veto HV Monitor | 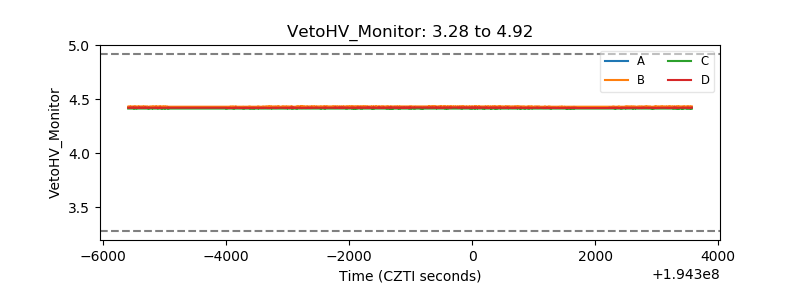 |
| Veto LLD | 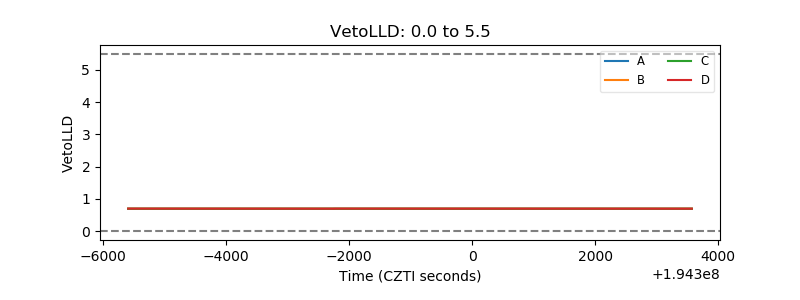 |
| Alpha Counter | 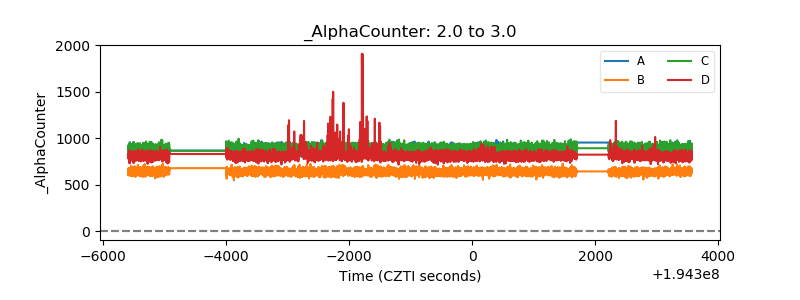 |
| _CPM_Rate | 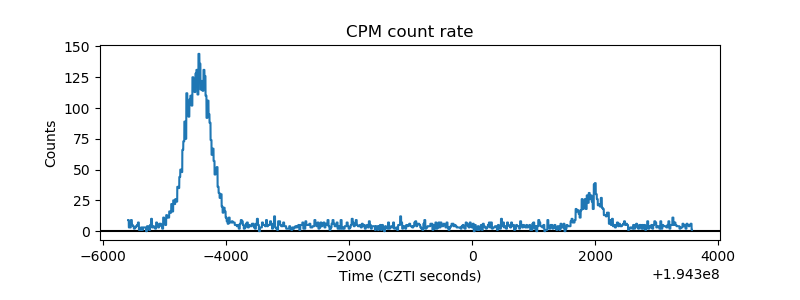 |
| CZT Counter | 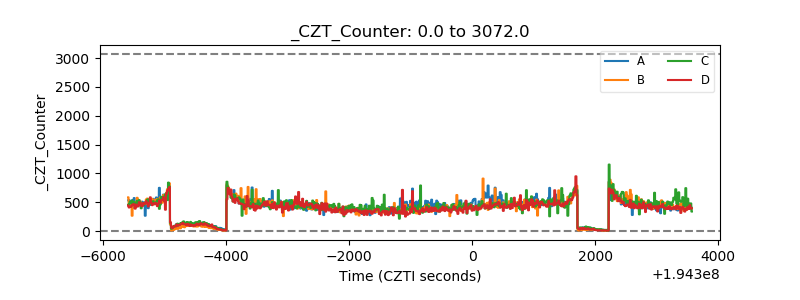 |
| +2.5 Volts monitor |  |
| +5 Volts monitor |  |
| _ROLL_ROT | 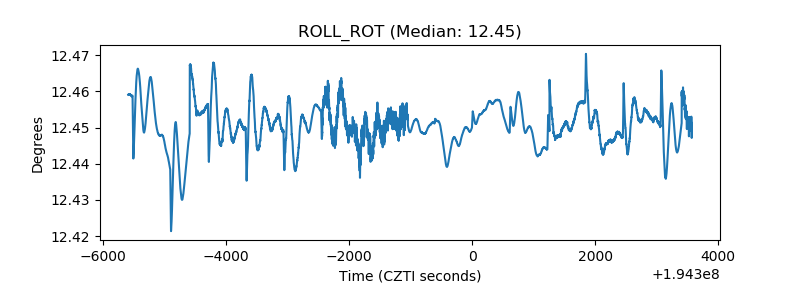 |
| _Roll_DEC | 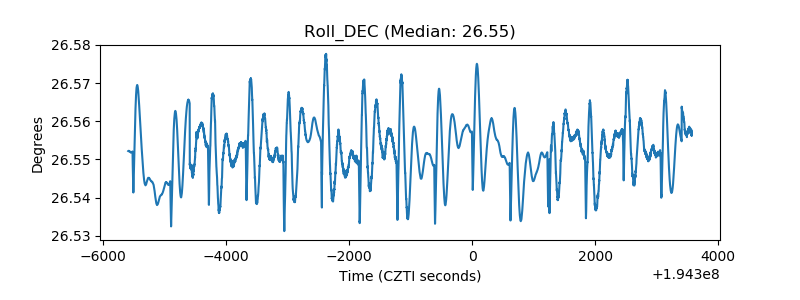 |
| _Roll_RA | 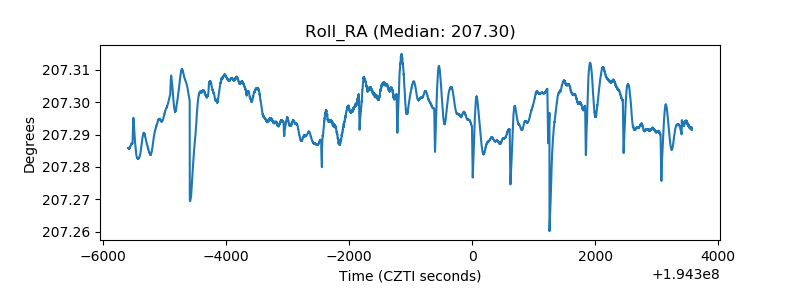 |
| Veto Counter | 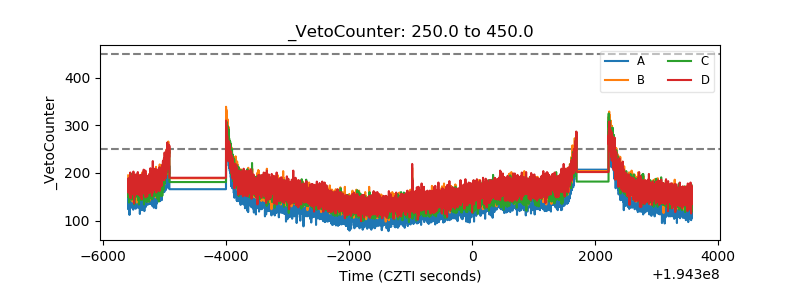 |