| Param | Original file | Final file |
|---|---|---|
| Filename | modeM0/AS1T01_058T01_9000000348cztM0_level2.fits | modeM0/AS1T01_058T01_9000000348cztM0_level2_quad_clean.evt |
| Size (bytes) | 1,053,460,800 | 915,209,280 |
| Size | 1004.7 MB | 872.8 MB |
| Events in quadrant A | 7,100,414 | 5,487,004 |
| Events in quadrant B | 6,515,625 | 5,530,826 |
| Events in quadrant C | 6,345,730 | 5,346,915 |
| Events in quadrant D | 5,734,416 | 5,149,479 |
| Mode M9 | |||
|---|---|---|---|
| Quadrant | BADHDUFLAG | Total packets | Discarded packets |
| A | 1 | 140481886631976 | 140479790317614 |
| B | 1 | 140481886631976 | 140479790317614 |
| C | 1 | 140481886631976 | 140479790317614 |
| D | 1 | 140481886631976 | 140479790317614 |
| Mode SS | |||
|---|---|---|---|
| Quadrant | BADHDUFLAG | Total packets | Discarded packets |
| A | 0 | 1824 | 0 |
| B | 0 | 1823 | 0 |
| C | 0 | 1821 | 0 |
| D | 0 | 1848 | 0 |
| Mode M0 | |||
|---|---|---|---|
| Quadrant | BADHDUFLAG | Total packets | Discarded packets |
| A | 0 | 184996 | 0 |
| B | 0 | 193113 | 0 |
| C | 0 | 256707 | 0 |
| D | 0 | 210678 | 0 |
| Quadrant | Total seconds | Saturated seconds | Saturation percentage |
|---|---|---|---|
| A | 90537 | 675 | 0.745552% |
| B | 90506 | 1619 | 1.788832% |
| C | 91344 | 8425 | 9.223375% |
| D | 89835 | 2238 | 2.491234% |
Noise dominated data is calculated using 1-second bins in cleaned event files. If a bin has >2000 counts, and if more than 50% of those come from <1% of pixels, then it is considered to be noise-dominated and hence unusable.
| Quadrant | # 1 sec bins | Bins with >0 counts | Bins with >2000 counts | High rate bins dominated by noise | Noise dominated (total time) | Noise dominated (detector-on time) | Marked lightcurve |
|---|---|---|---|---|---|---|---|
| A | 149845 | 91147 | 0 | 0 | 0.00% | 0.00% |  |
| B | 149844 | 90907 | 0 | 0 | 0.00% | 0.00% |  |
| C | 149844 | 91694 | 0 | 0 | 0.00% | 0.00% |  |
| D | 149844 | 90145 | 0 | 0 | 0.00% | 0.00% |  |
Top three noisy pixels from each quadrant. If the there are fewer than three noisy pixels in the level2.evt file, extra rows are filled as -1
| Pixel properties | Quadrant properties | ||||||
|---|---|---|---|---|---|---|---|
| Quadrant | DetID | PixID | Counts | Sigma | Mean | Median | Sigma |
| A | 0 | 29 | 4557 | 6.94 | 1859 | 1769 | 401.8 |
| A | 7 | 110 | 4361 | 6.45 | 1859 | 1769 | 401.8 |
| A | 12 | 254 | 4355 | 6.44 | 1859 | 1769 | 401.8 |
| B | 2 | 9 | 4453 | 8.61 | 1734 | 1659 | 324.5 |
| B | 5 | 128 | 3643 | 6.11 | 1734 | 1659 | 324.5 |
| B | 5 | 225 | 3539 | 5.79 | 1734 | 1659 | 324.5 |
| C | 7 | 111 | 3818 | 5.72 | 1693 | 1639 | 381.1 |
| C | 12 | 250 | 3735 | 5.5 | 1693 | 1639 | 381.1 |
| C | 2 | 127 | 3635 | 5.24 | 1693 | 1639 | 381.1 |
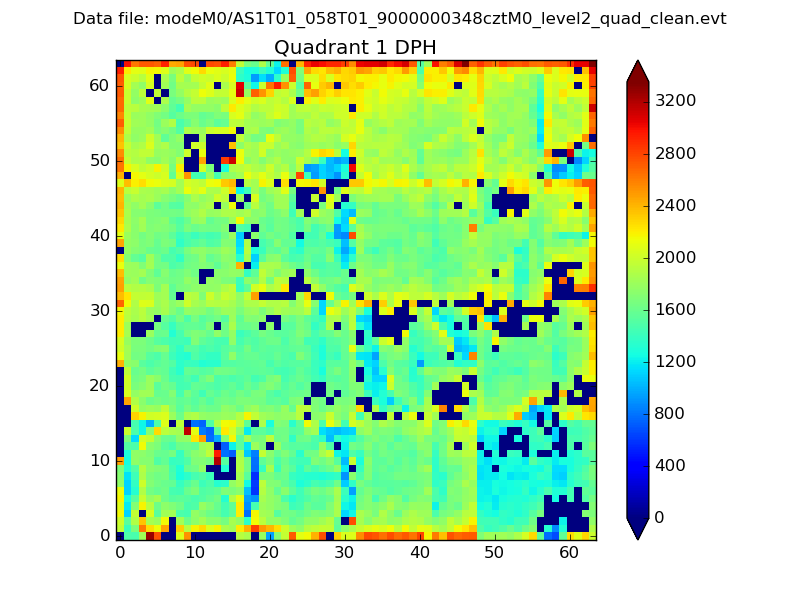
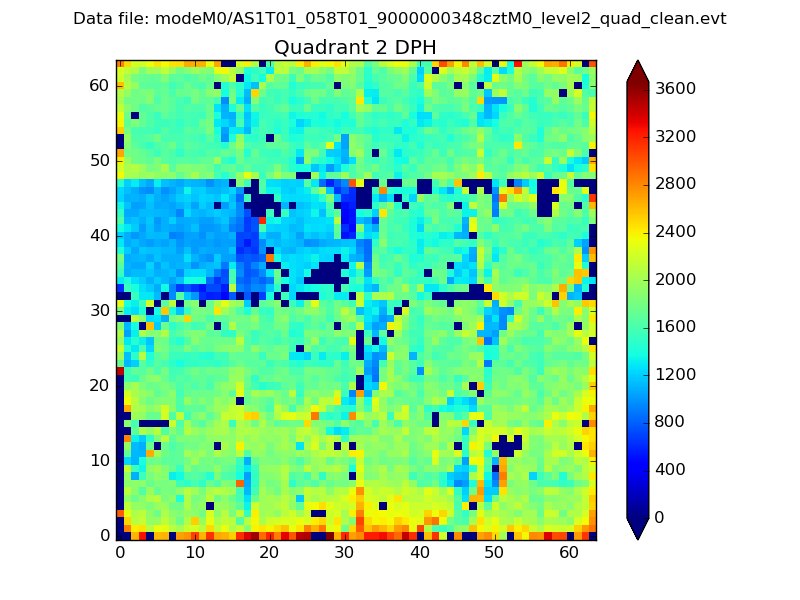
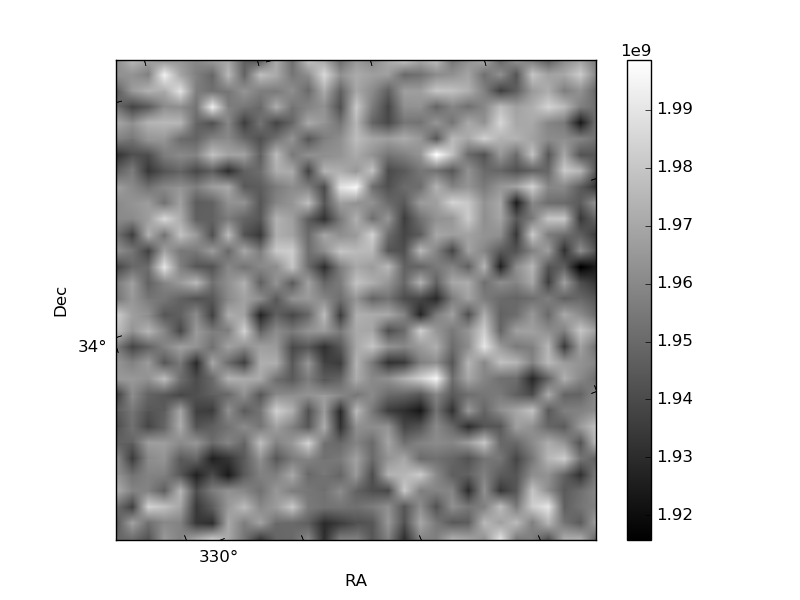
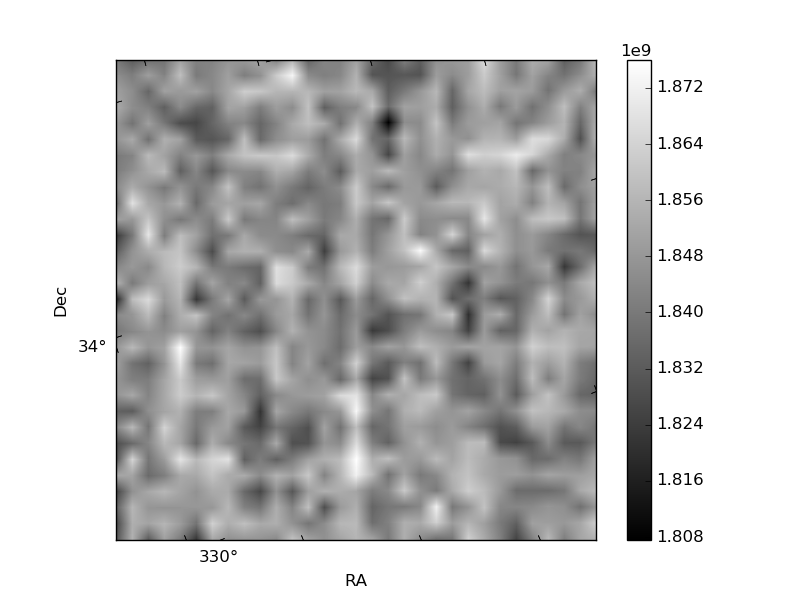
Histogram calculated using DETX and DETY for each event in the final _common_clean file
| Quadrant A |  |
 |
Quadrant B |
|---|---|---|---|
| Quadrant D |  |
 |
Quadrant C |
| Plot type | Count rate plots | Images |
|---|---|---|
| Comparison with Poisson distribution Blue bars denote a histogram of data divided into 1 sec bins. Red curve is a Poisson curve with rate = median count rate of data. |
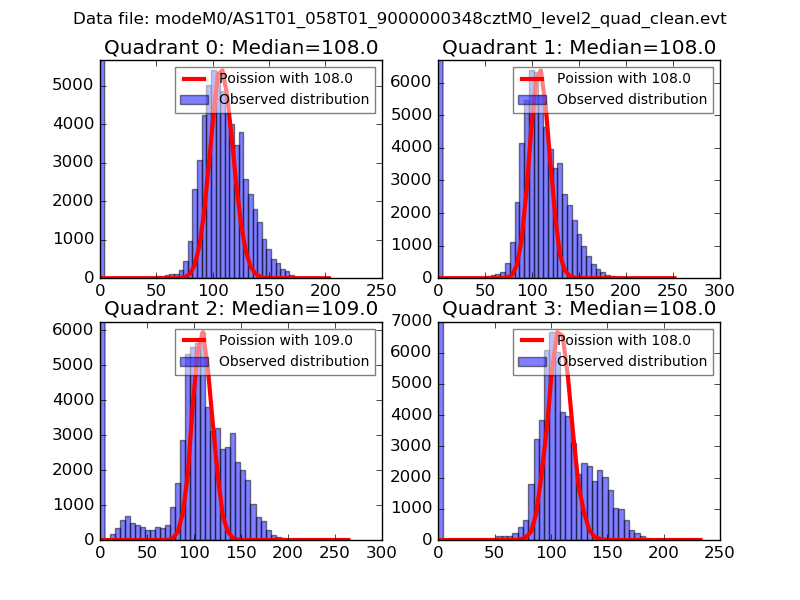 |
 |
| Quadrant-wise count rates Data is divided into 100 sec bins |
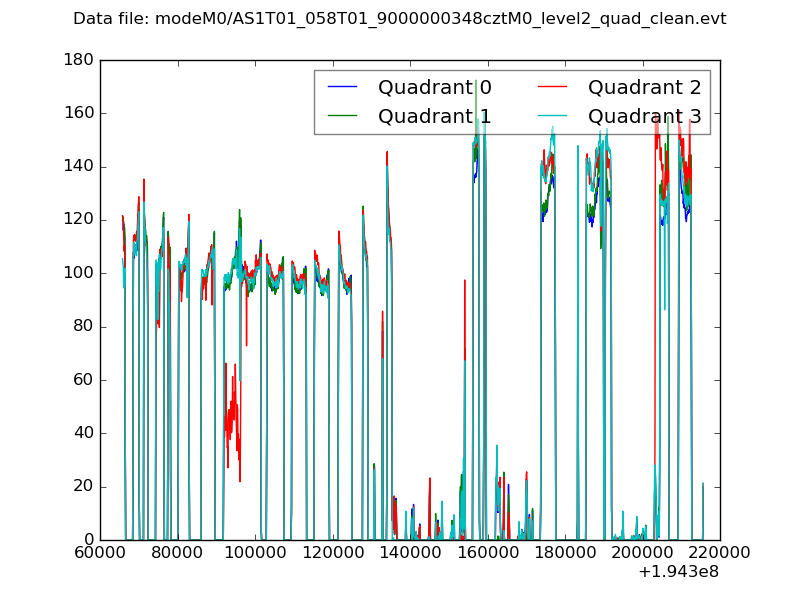 |
|
| Module-wise count rates for Quadrant A Data is divided into 100 sec bins |
 |
 |
| Module-wise count rates for Quadrant B Data is divided into 100 sec bins |
 |
 |
| Module-wise count rates for Quadrant C Data is divided into 100 sec bins |
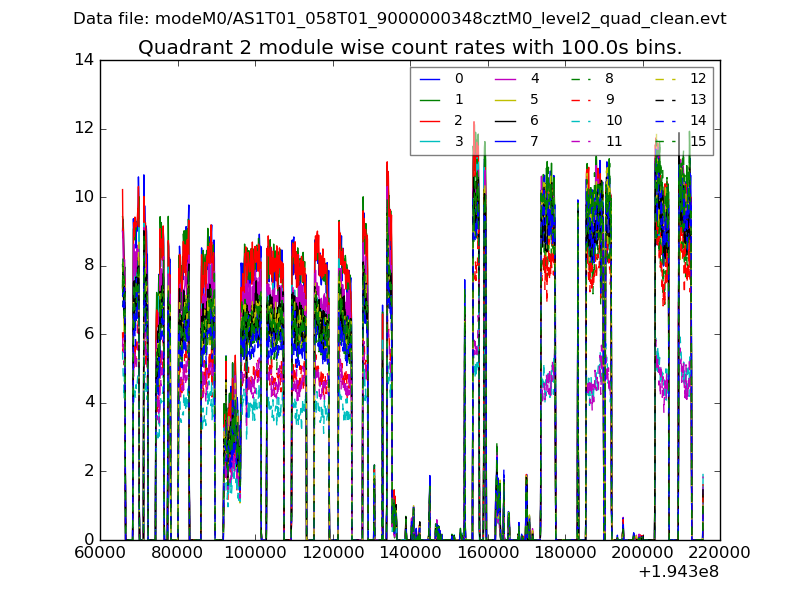 |
 |
| Module-wise count rates for Quadrant D Data is divided into 100 sec bins |
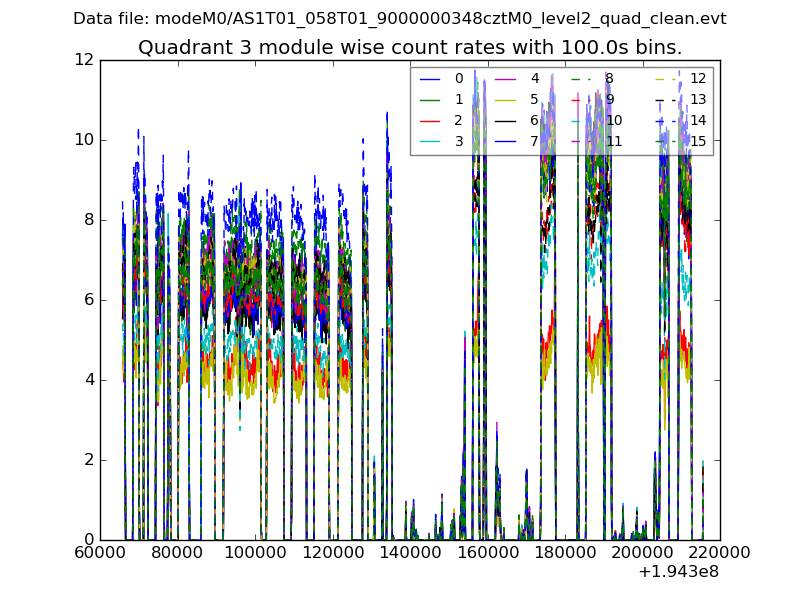 |
 |
| Parameter | Plot |
|---|---|
| CZT HV Monitor |  |
| D_VDD | 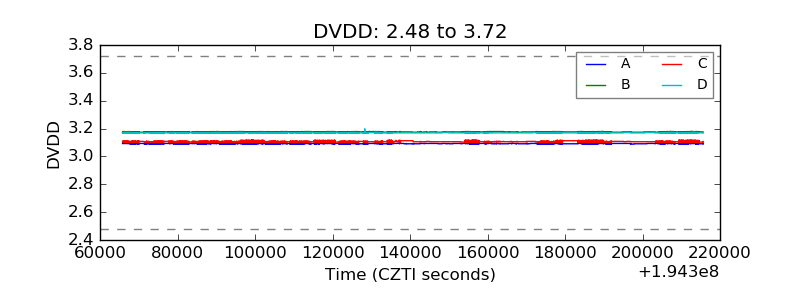 |
| Temperature 1 |  |
| Veto HV Monitor |  |
| Veto LLD |  |
| Alpha Counter |  |
| _CPM_Rate |  |
| CZT Counter |  |
| +2.5 Volts monitor | 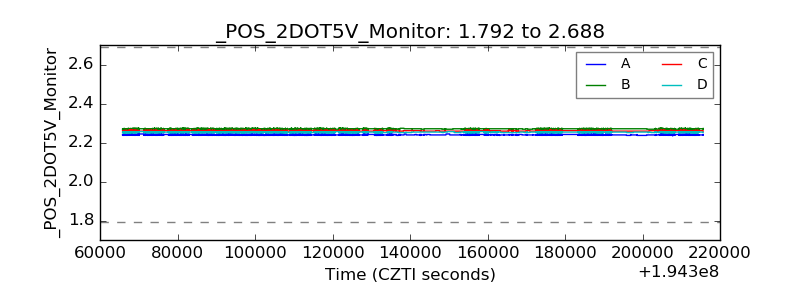 |
| +5 Volts monitor |  |
| _ROLL_ROT | 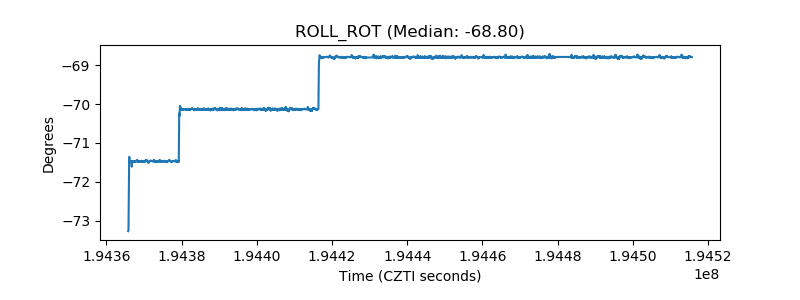 |
| _Roll_DEC | 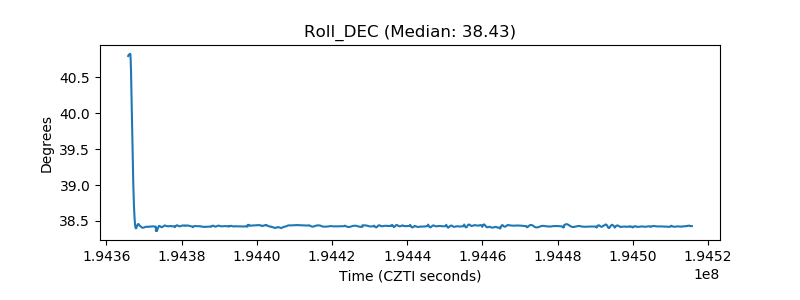 |
| _Roll_RA | 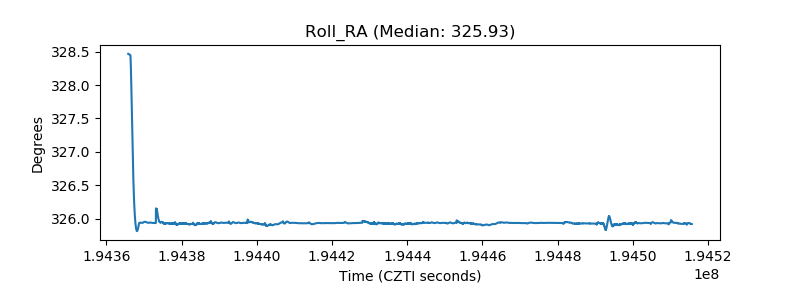 |
| Veto Counter |  |