| Param | Original file | Final file |
|---|---|---|
| Filename | modeM0/AS1T01_058T01_9000000348_02275cztM0_level2.evt | modeM0/AS1T01_058T01_9000000348_02275cztM0_level2_quad_clean.evt |
| Size (bytes) | 620,386,560 | 74,678,400 |
| Size | 591.6 MB | 71.2 MB |
| Events in quadrant A | 3,058,116 | 449,652 |
| Events in quadrant B | 3,193,477 | 458,273 |
| Events in quadrant C | 6,858,501 | 441,285 |
| Events in quadrant D | 5,210,380 | 429,967 |
| Mode M9 | |||
|---|---|---|---|
| Quadrant | BADHDUFLAG | Total packets | Discarded packets |
| A | 0 | 1 | 0 |
| B | 1 | 1 | 0 |
| C | 1 | -1 | -1 |
| D | 1 | -1 | -1 |
| Mode SS | |||
|---|---|---|---|
| Quadrant | BADHDUFLAG | Total packets | Discarded packets |
| A | 0 | 138 | 0 |
| B | 0 | 138 | 0 |
| C | 0 | 138 | 0 |
| D | 0 | 138 | 0 |
| Mode M0 | |||
|---|---|---|---|
| Quadrant | BADHDUFLAG | Total packets | Discarded packets |
| A | 0 | 14141 | 2 |
| B | 0 | 14434 | 2 |
| C | 0 | 25202 | 2 |
| D | 0 | 20663 | 2 |
| Quadrant | Total seconds | Saturated seconds | Saturation percentage |
|---|---|---|---|
| A | 6913 | 39 | 0.564154% |
| B | 6913 | 41 | 0.593085% |
| C | 6913 | 554 | 8.013887% |
| D | 6913 | 692 | 10.010126% |
Noise dominated data is calculated using 1-second bins in cleaned event files. If a bin has >2000 counts, and if more than 50% of those come from <1% of pixels, then it is considered to be noise-dominated and hence unusable.
| Quadrant | # 1 sec bins | Bins with >0 counts | Bins with >2000 counts | High rate bins dominated by noise | Noise dominated (total time) | Noise dominated (detector-on time) | Marked lightcurve |
|---|---|---|---|---|---|---|---|
| A | 7618 | 6913 | 0 | 0 | 0.00% | 0.00% | 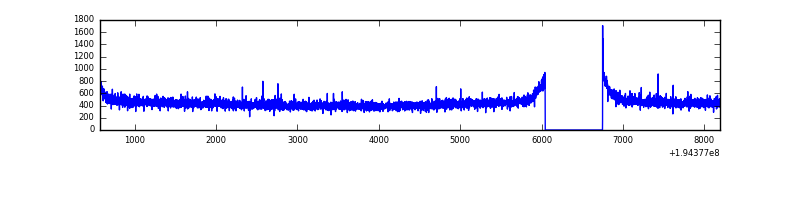 |
| B | 7618 | 6913 | 1 | 1 | 0.01% | 0.01% | 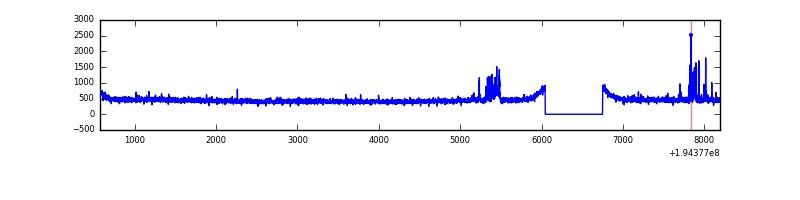 |
| C | 7618 | 6914 | 580 | 580 | 7.61% | 8.39% | 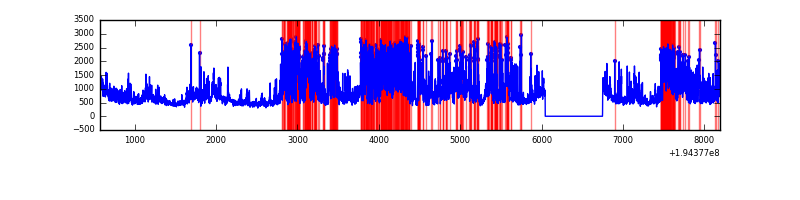 |
| D | 7618 | 6913 | 669 | 669 | 8.78% | 9.68% | 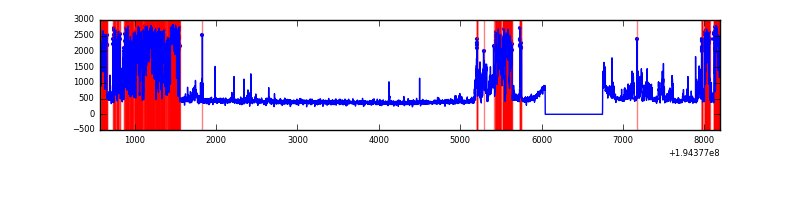 |
Top three noisy pixels from each quadrant. If the there are fewer than three noisy pixels in the level2.evt file, extra rows are filled as -1
| Pixel properties | Quadrant properties | ||||||
|---|---|---|---|---|---|---|---|
| Quadrant | DetID | PixID | Counts | Sigma | Mean | Median | Sigma |
| A | 15 | 33 | 16931 | 99.78 | 790 | 772 | 161.9 |
| A | 12 | 194 | 9027 | 50.98 | 790 | 772 | 161.9 |
| A | 0 | 226 | 8597 | 48.32 | 790 | 772 | 161.9 |
| B | 4 | 185 | 66984 | 426.53 | 799 | 776 | 155.2 |
| B | 10 | 244 | 46272 | 293.1 | 799 | 776 | 155.2 |
| B | 12 | 111 | 11490 | 69.02 | 799 | 776 | 155.2 |
| C | 2 | 53 | 2265734 | 12734.97 | 761 | 764 | 177.9 |
| C | 5 | 234 | 1211846 | 6809.4 | 761 | 764 | 177.9 |
| C | 14 | 223 | 383881 | 2154.11 | 761 | 764 | 177.9 |
| D | 12 | 126 | 2311380 | 12911.95 | 750 | 729 | 179.0 |
| D | 13 | 169 | 22672 | 122.62 | 750 | 729 | 179.0 |
| D | 15 | 194 | 14489 | 76.89 | 750 | 729 | 179.0 |
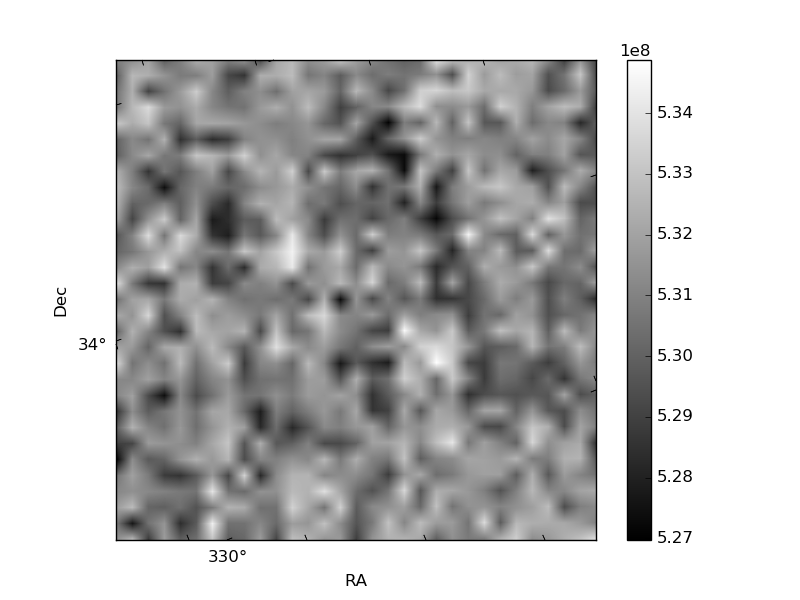
Histogram calculated using DETX and DETY for each event in the final _common_clean file
| Quadrant A | 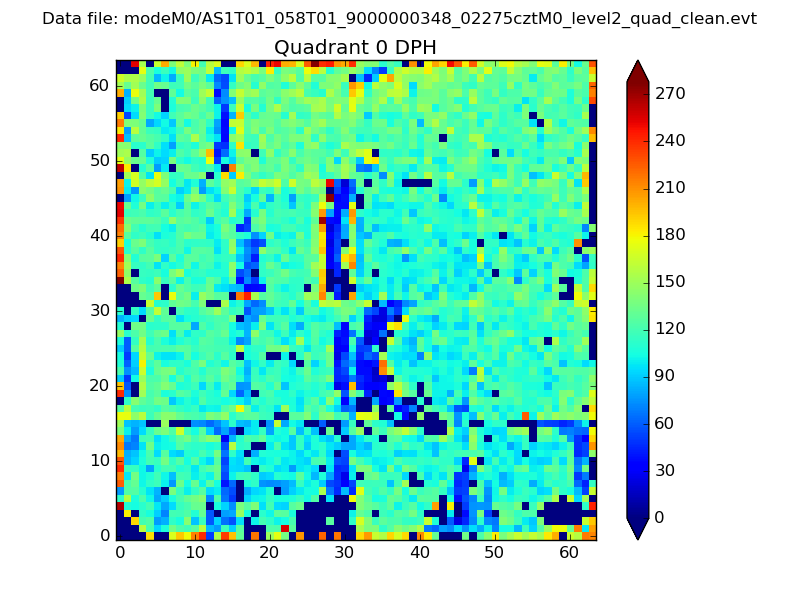 |
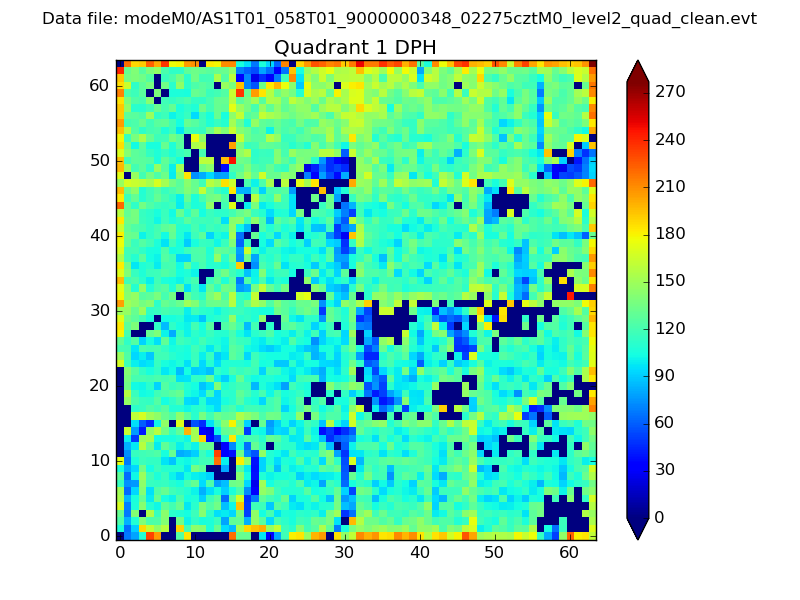 |
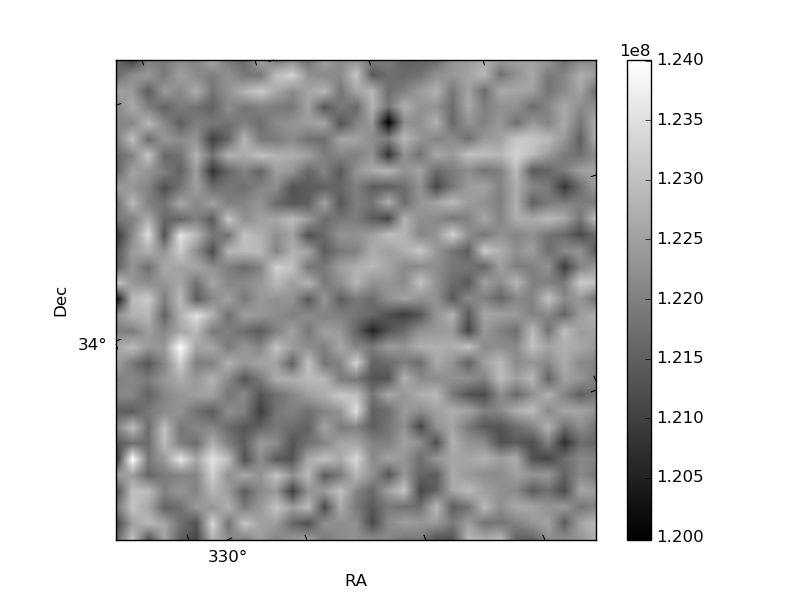
Quadrant B |
|---|---|---|---|
| Quadrant D |  |
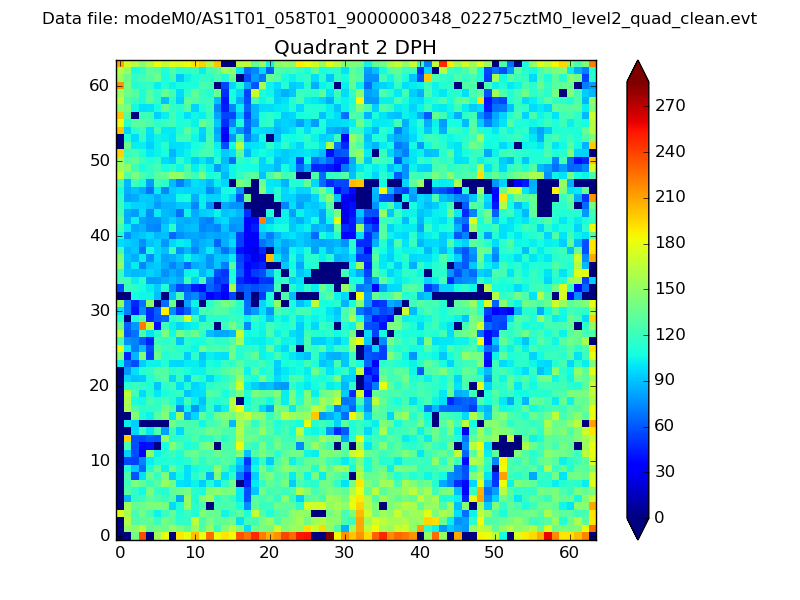 |
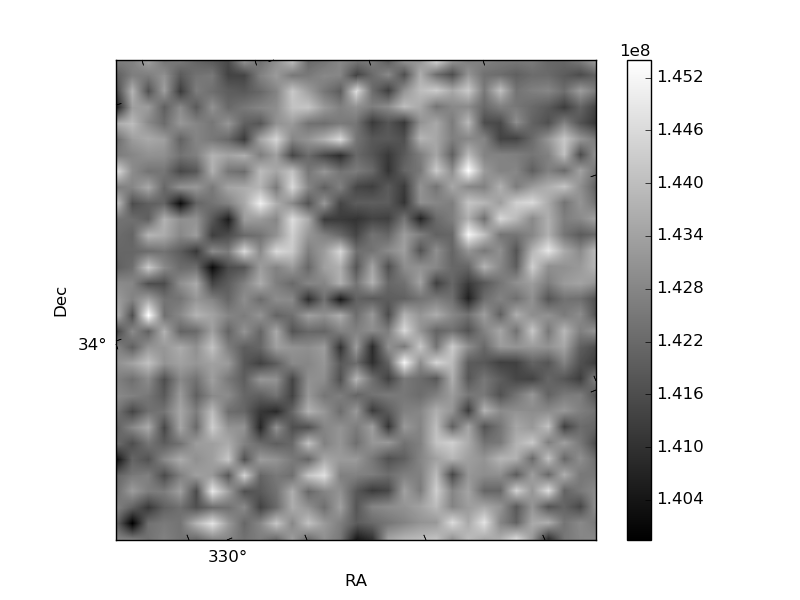
Quadrant C |
| Plot type | Count rate plots | Images |
|---|---|---|
| Comparison with Poisson distribution Blue bars denote a histogram of data divided into 1 sec bins. Red curve is a Poisson curve with rate = median count rate of data. |
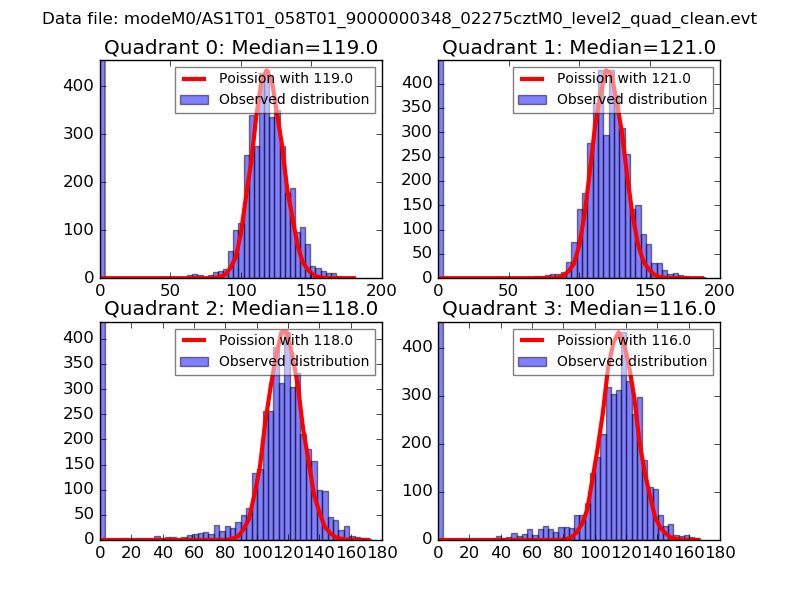 |
 |
| Quadrant-wise count rates Data is divided into 100 sec bins |
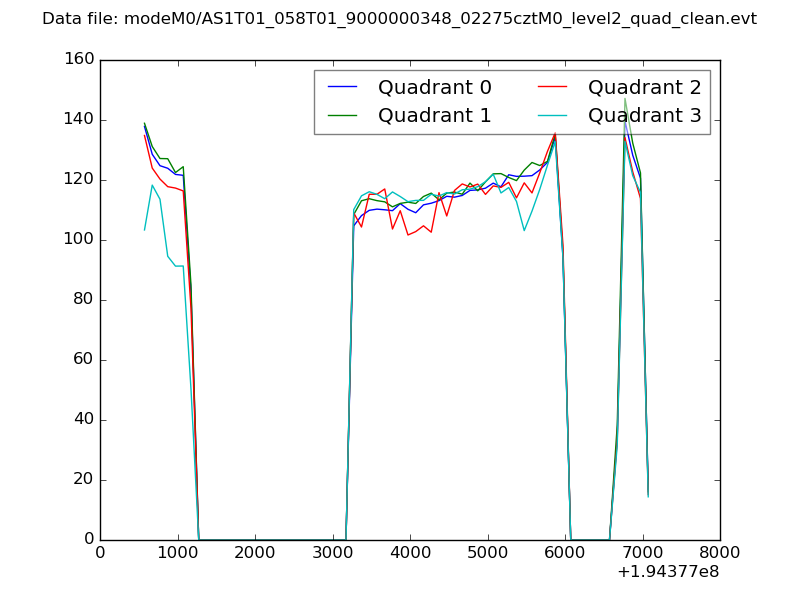 |
|
| Module-wise count rates for Quadrant A Data is divided into 100 sec bins |
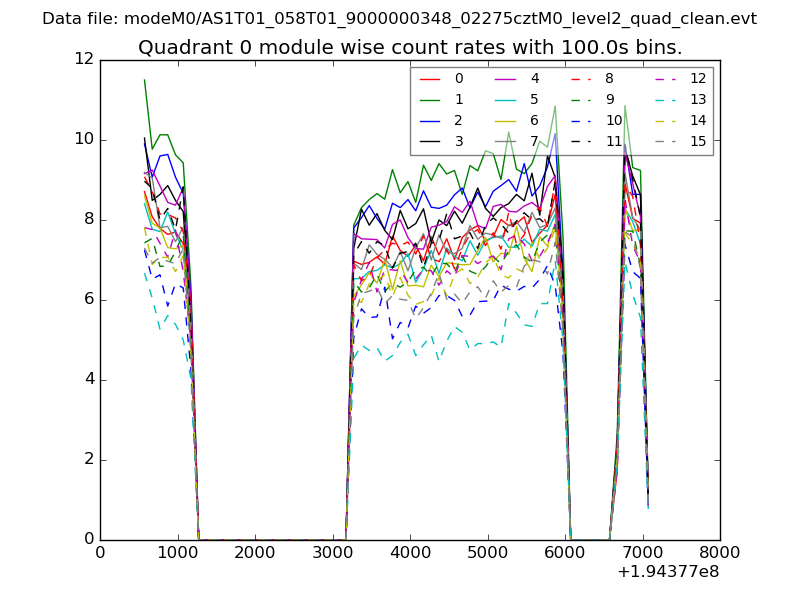 |
 |
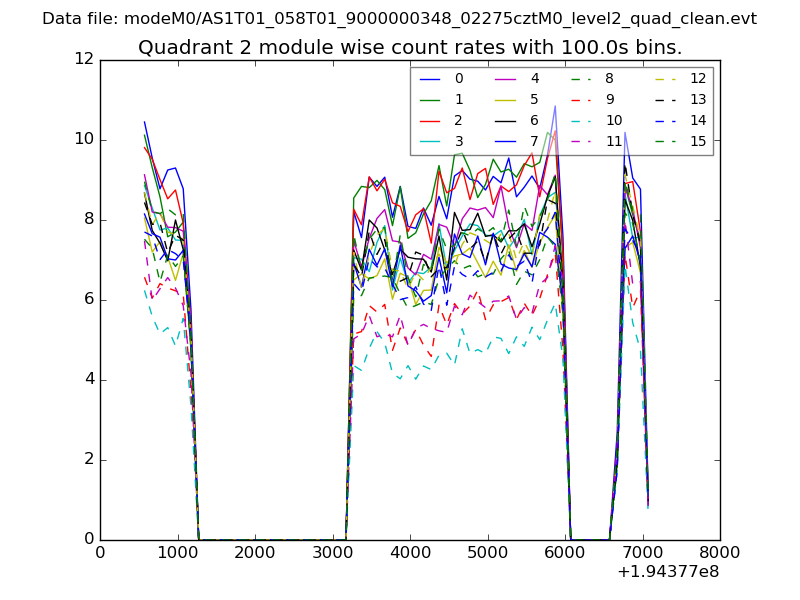
| Module-wise count rates for Quadrant B Data is divided into 100 sec bins |
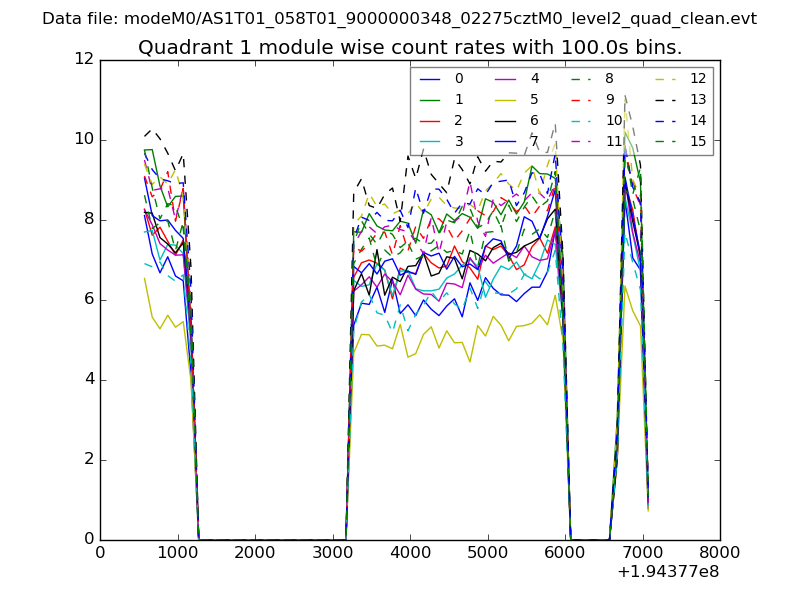 |
 |
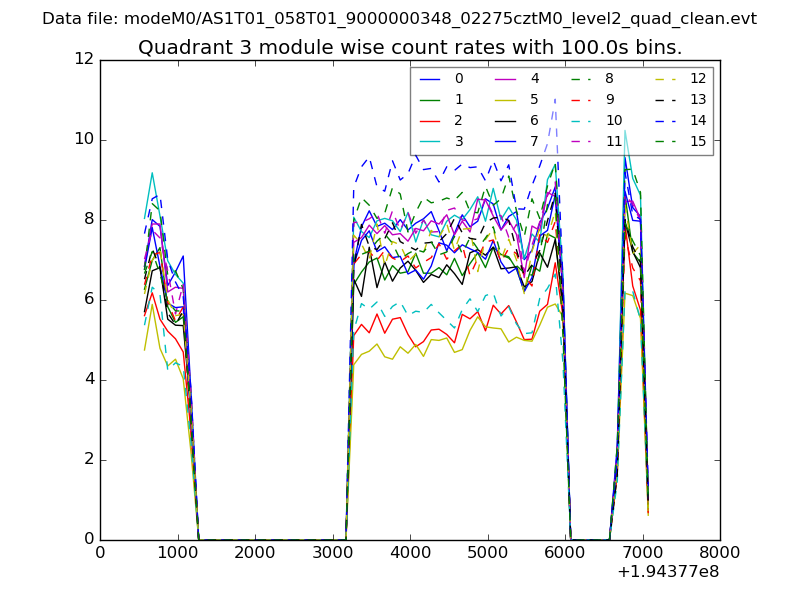
| Module-wise count rates for Quadrant C Data is divided into 100 sec bins |
 |
 |
| Module-wise count rates for Quadrant D Data is divided into 100 sec bins |
 |
 |
| Parameter | Plot |
|---|---|
| CZT HV Monitor | 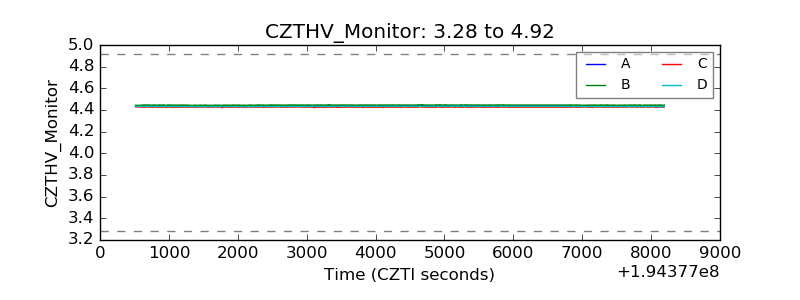 |
| D_VDD | 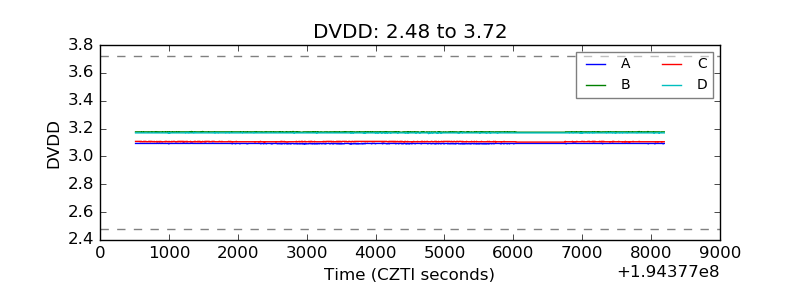 |
| Temperature 1 | 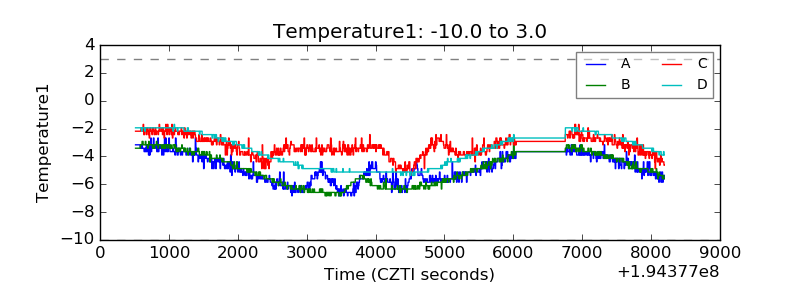 |
| Veto HV Monitor | 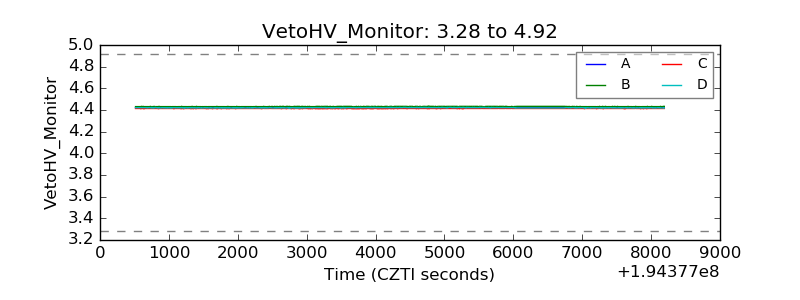 |
| Veto LLD | 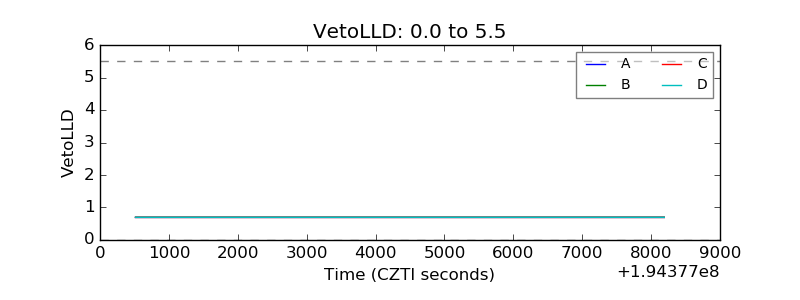 |
| Alpha Counter | 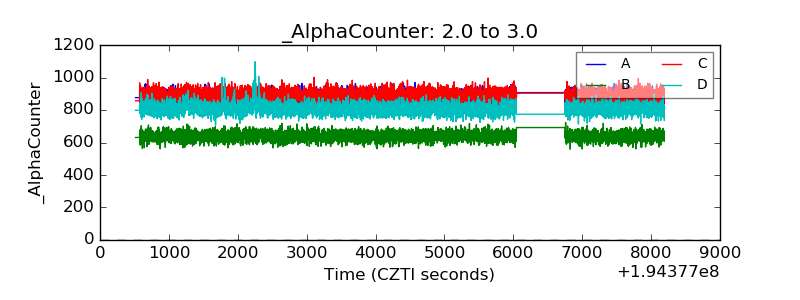 |
| _CPM_Rate | 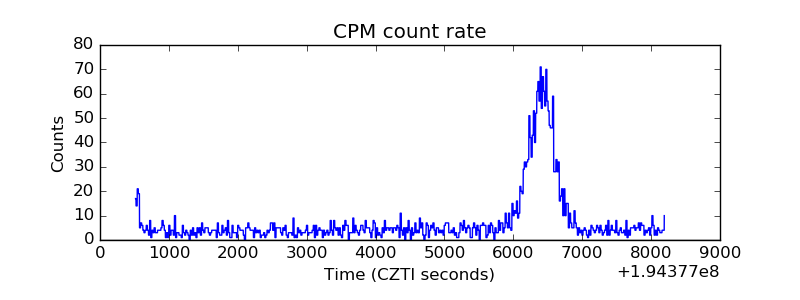 |
| CZT Counter | 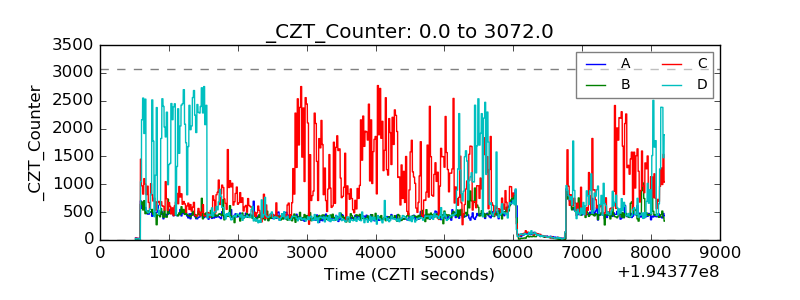 |
| +2.5 Volts monitor |  |
| +5 Volts monitor |  |
| _ROLL_ROT | 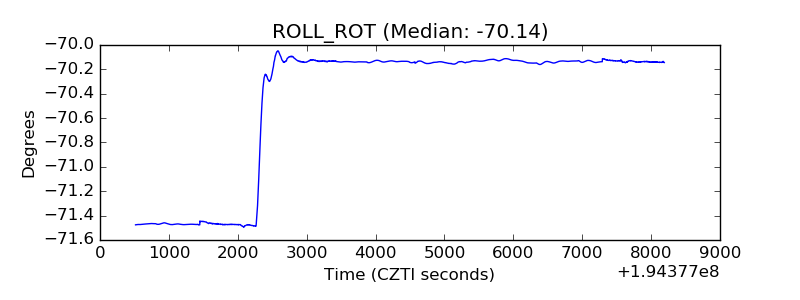 |
| _Roll_DEC | 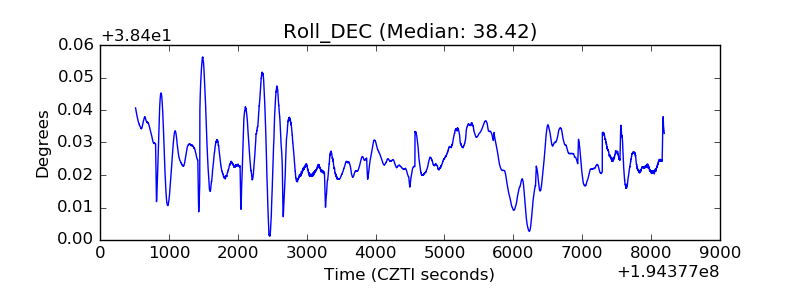 |
| _Roll_RA | 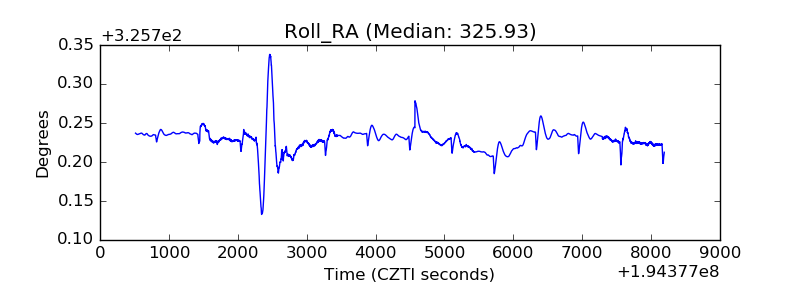 |
| Veto Counter | 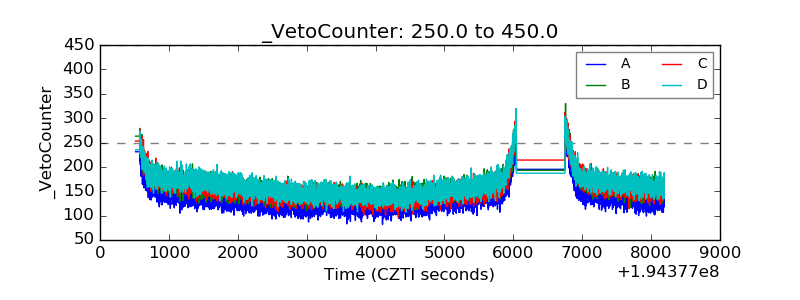 |