| Param | Original file | Final file |
|---|---|---|
| Filename | modeM0/AS1T01_058T01_9000000348_02279cztM0_level2.evt | modeM0/AS1T01_058T01_9000000348_02279cztM0_level2_quad_clean.evt |
| Size (bytes) | 411,474,240 | 86,754,240 |
| Size | 392.4 MB | 82.7 MB |
| Events in quadrant A | 2,939,941 | 528,212 |
| Events in quadrant B | 3,013,541 | 536,058 |
| Events in quadrant C | 3,159,079 | 546,874 |
| Events in quadrant D | 2,878,634 | 534,565 |
| Mode M9 | |||
|---|---|---|---|
| Quadrant | BADHDUFLAG | Total packets | Discarded packets |
| A | 0 | 1 | 0 |
| B | 1 | 1 | 0 |
| C | 1 | -1 | -1 |
| D | 1 | -1 | -1 |
| Mode SS | |||
|---|---|---|---|
| Quadrant | BADHDUFLAG | Total packets | Discarded packets |
| A | 0 | 138 | 0 |
| B | 0 | 138 | 0 |
| C | 0 | 138 | 0 |
| D | 0 | 138 | 0 |
| Mode M0 | |||
|---|---|---|---|
| Quadrant | BADHDUFLAG | Total packets | Discarded packets |
| A | 0 | 13926 | 1 |
| B | 0 | 14054 | 1 |
| C | 0 | 14202 | 1 |
| D | 0 | 14024 | 1 |
| Quadrant | Total seconds | Saturated seconds | Saturation percentage |
|---|---|---|---|
| A | 6909 | 16 | 0.231582% |
| B | 6909 | 10 | 0.144739% |
| C | 6909 | 7 | 0.101317% |
| D | 6909 | 5 | 0.072369% |
Noise dominated data is calculated using 1-second bins in cleaned event files. If a bin has >2000 counts, and if more than 50% of those come from <1% of pixels, then it is considered to be noise-dominated and hence unusable.
| Quadrant | # 1 sec bins | Bins with >0 counts | Bins with >2000 counts | High rate bins dominated by noise | Noise dominated (total time) | Noise dominated (detector-on time) | Marked lightcurve |
|---|---|---|---|---|---|---|---|
| A | 7449 | 6909 | 0 | 0 | 0.00% | 0.00% | 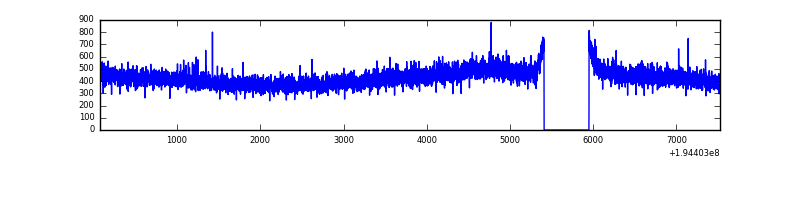 |
| B | 7449 | 6910 | 2 | 2 | 0.03% | 0.03% | 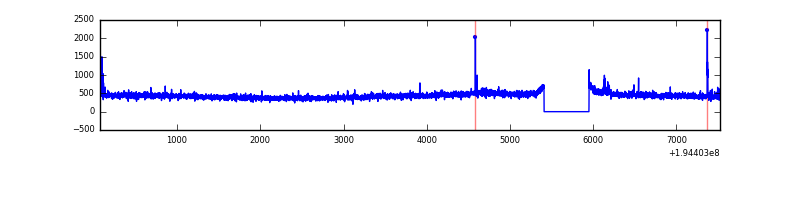 |
| C | 7449 | 6910 | 1 | 1 | 0.01% | 0.01% | 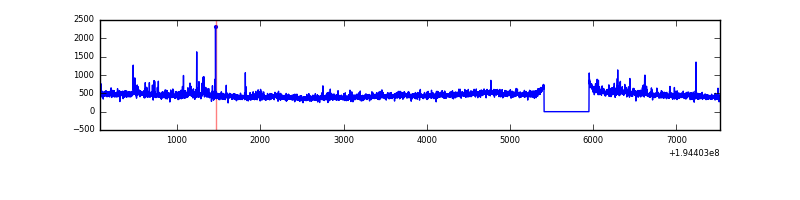 |
| D | 7449 | 6910 | 1 | 1 | 0.01% | 0.01% | 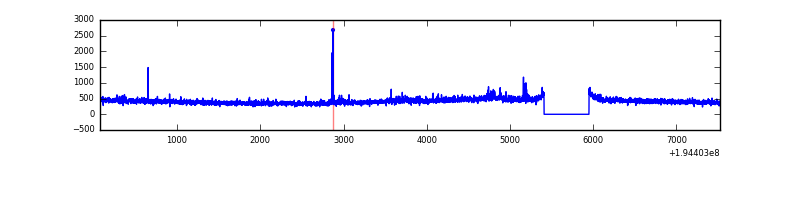 |
Top three noisy pixels from each quadrant. If the there are fewer than three noisy pixels in the level2.evt file, extra rows are filled as -1
| Pixel properties | Quadrant properties | ||||||
|---|---|---|---|---|---|---|---|
| Quadrant | DetID | PixID | Counts | Sigma | Mean | Median | Sigma |
| A | 12 | 194 | 8436 | 49.03 | 763 | 745 | 156.9 |
| A | 0 | 226 | 8097 | 46.87 | 763 | 745 | 156.9 |
| A | 13 | 9 | 1994 | 7.96 | 763 | 745 | 156.9 |
| B | 4 | 185 | 13345 | 84.47 | 772 | 753 | 149.1 |
| B | 3 | 0 | 12714 | 80.24 | 772 | 753 | 149.1 |
| B | 12 | 111 | 11961 | 75.18 | 772 | 753 | 149.1 |
| C | 5 | 234 | 155147 | 873.49 | 751 | 754 | 176.8 |
| C | 2 | 53 | 46781 | 260.4 | 751 | 754 | 176.8 |
| C | 10 | 34 | 9891 | 51.69 | 751 | 754 | 176.8 |
| D | 13 | 169 | 33895 | 189.54 | 738 | 721 | 175.0 |
| D | 9 | 64 | 26006 | 144.47 | 738 | 721 | 175.0 |
| D | 5 | 233 | 13704 | 74.18 | 738 | 721 | 175.0 |
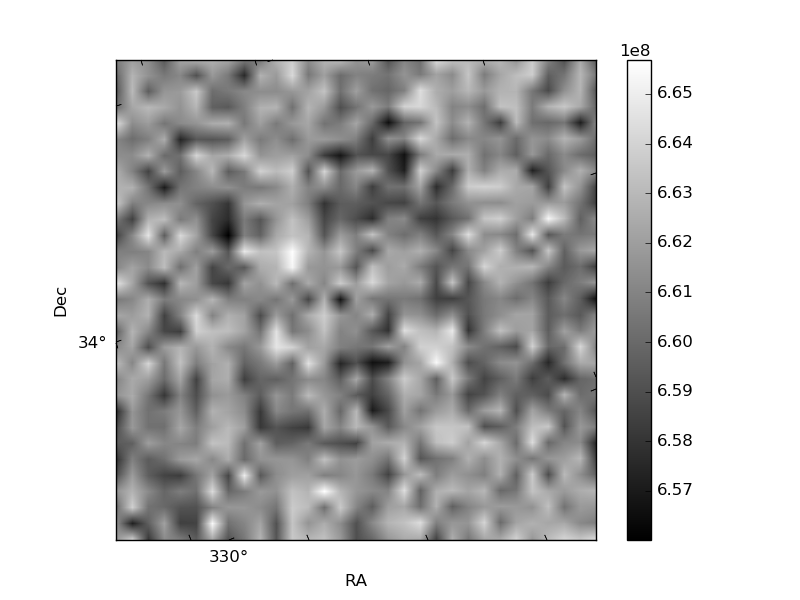
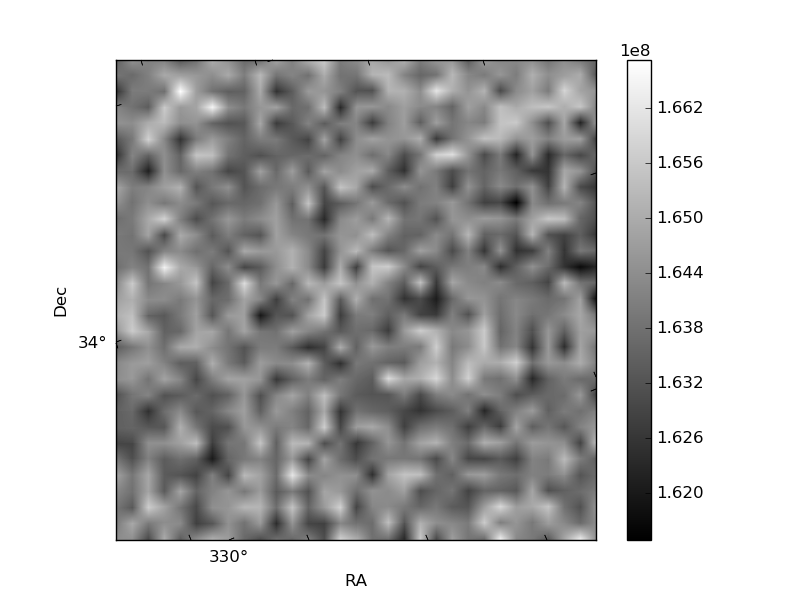
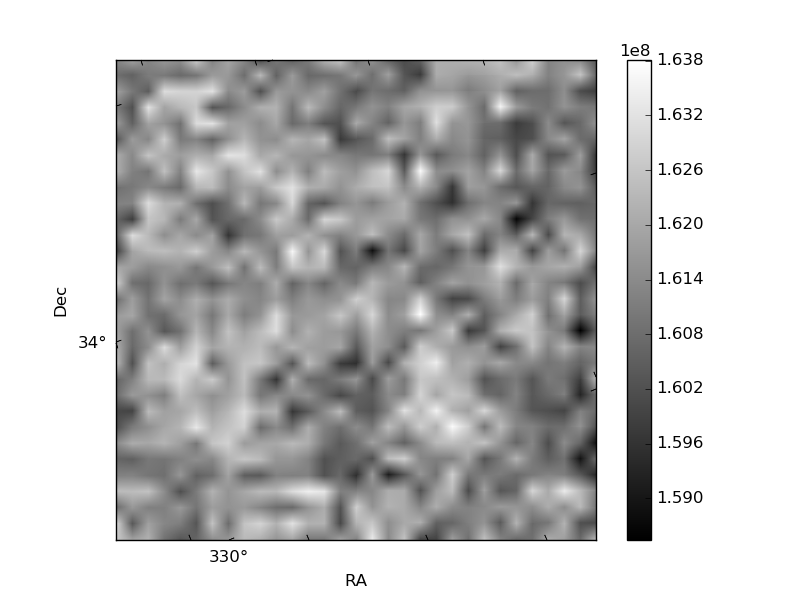
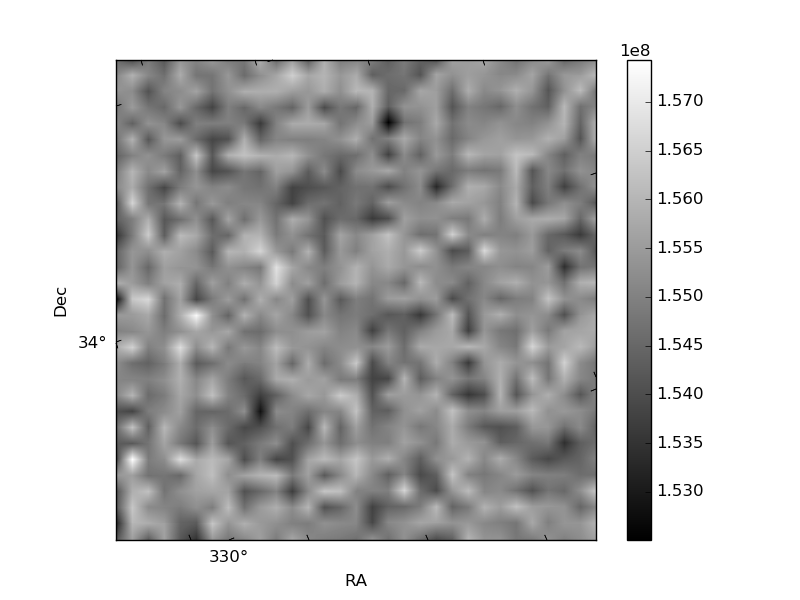
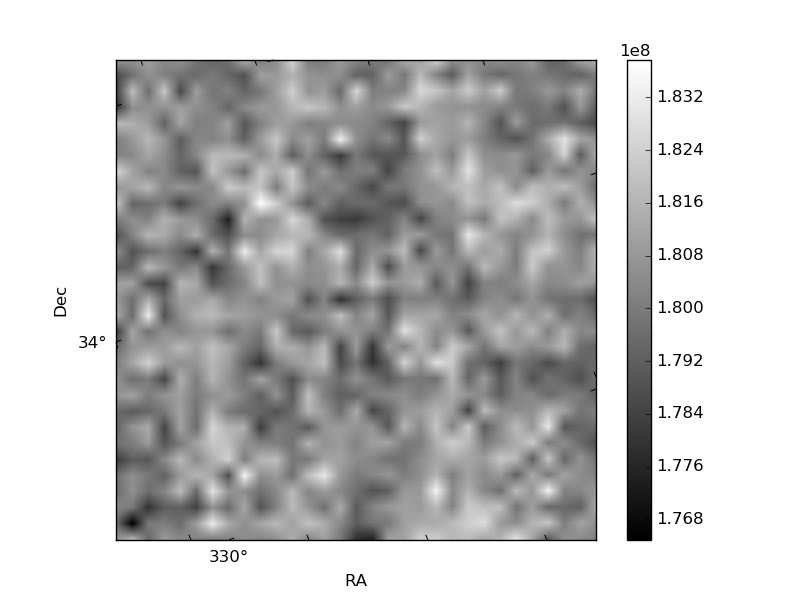
Histogram calculated using DETX and DETY for each event in the final _common_clean file
| Quadrant A | 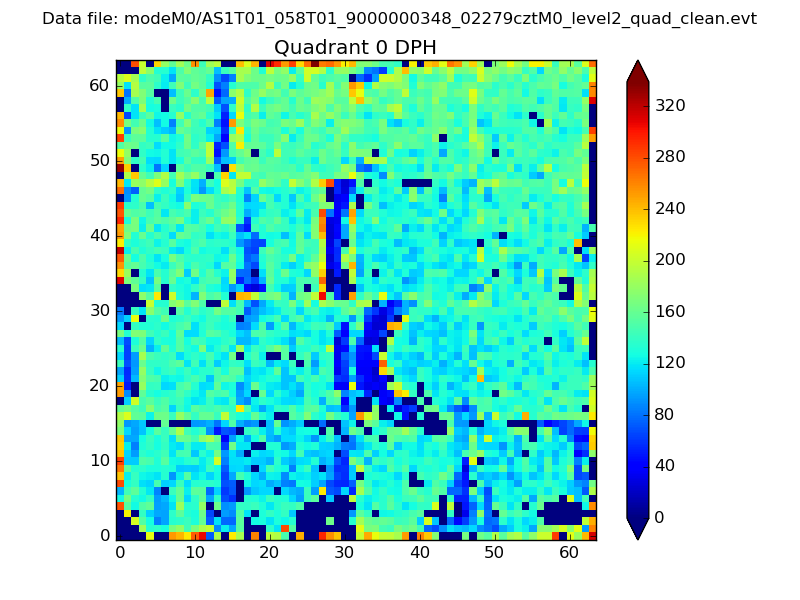 |
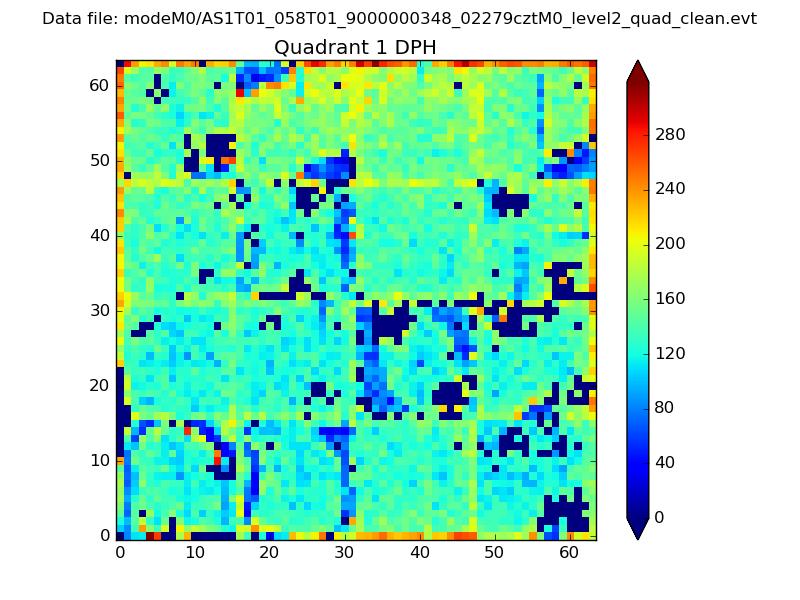 |
Quadrant B |
|---|---|---|---|
| Quadrant D | 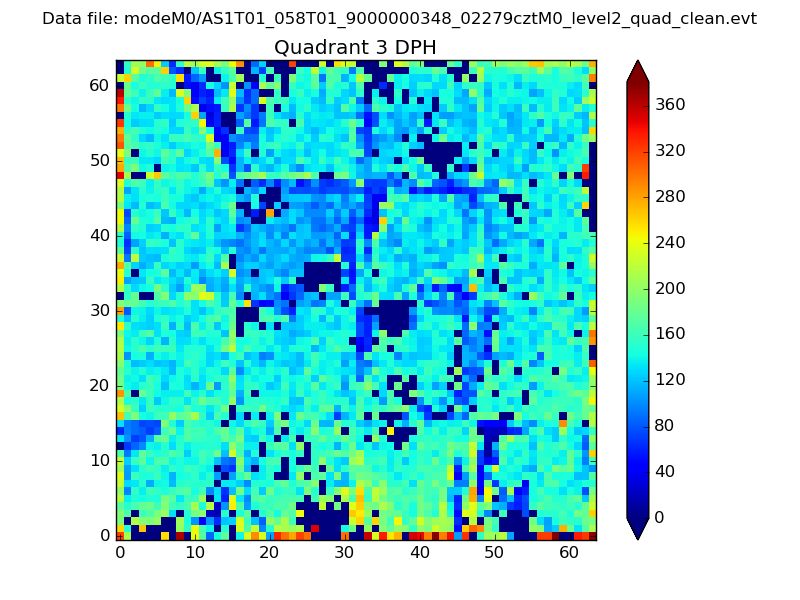 |
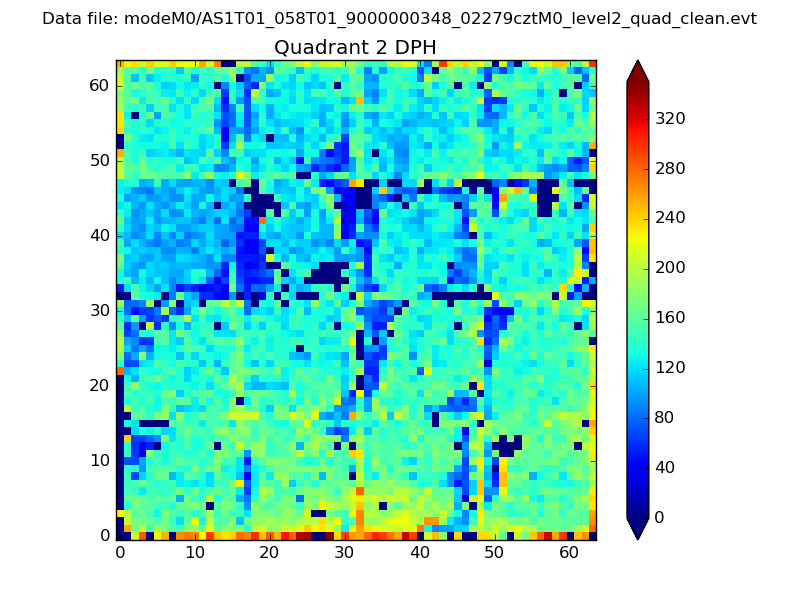 |
Quadrant C |
| Plot type | Count rate plots | Images |
|---|---|---|
| Comparison with Poisson distribution Blue bars denote a histogram of data divided into 1 sec bins. Red curve is a Poisson curve with rate = median count rate of data. |
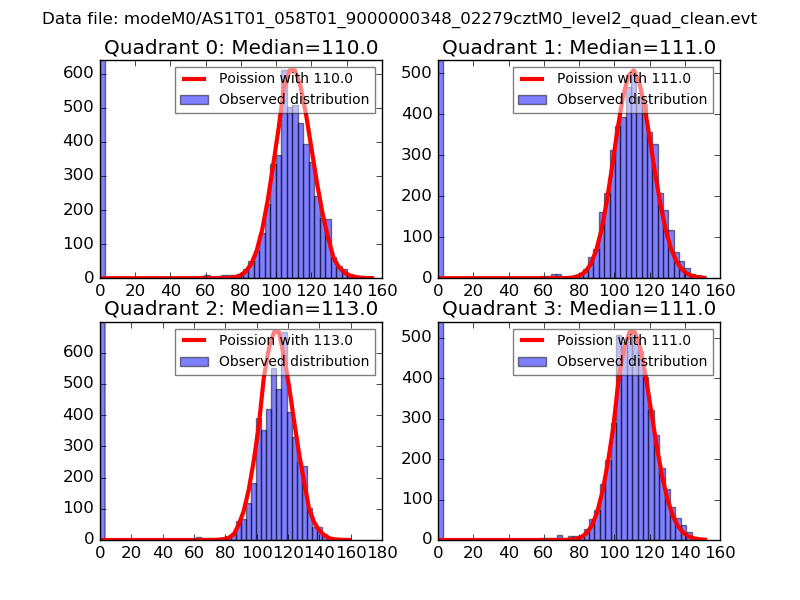 |
 |
| Quadrant-wise count rates Data is divided into 100 sec bins |
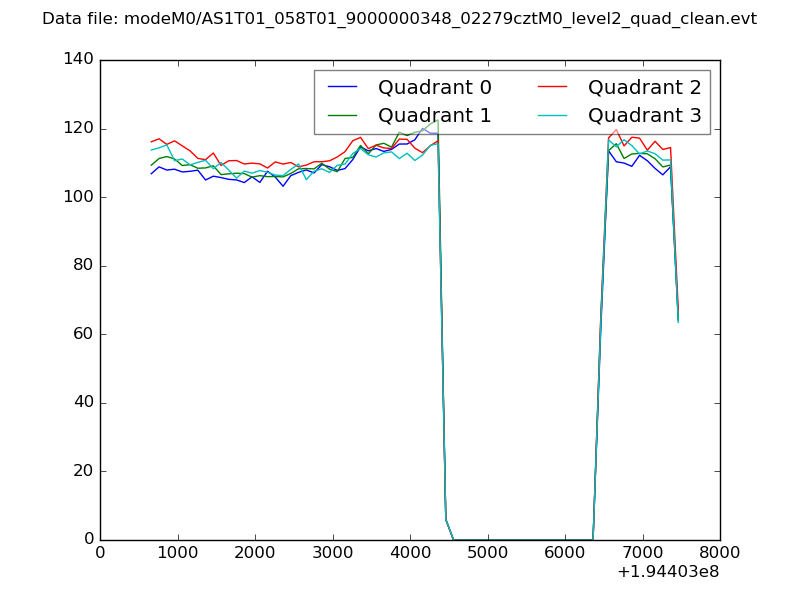 |
|
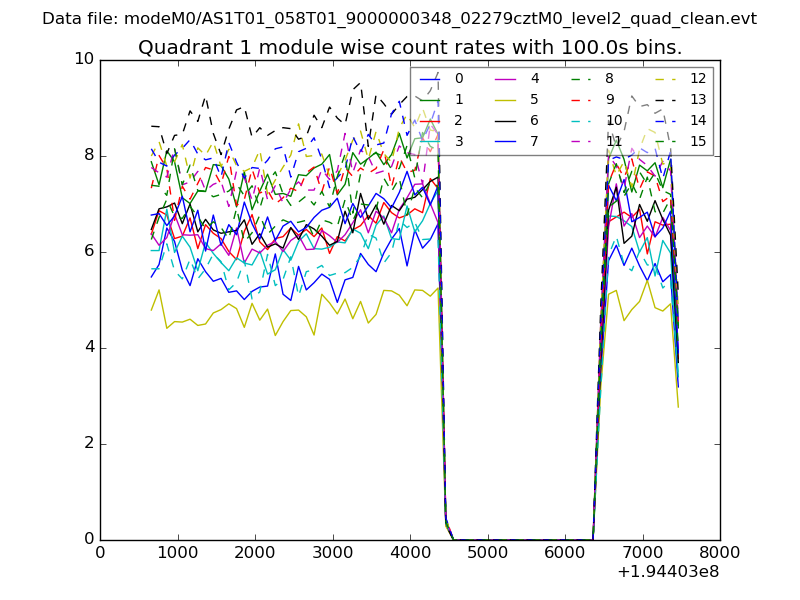
| Module-wise count rates for Quadrant A Data is divided into 100 sec bins |
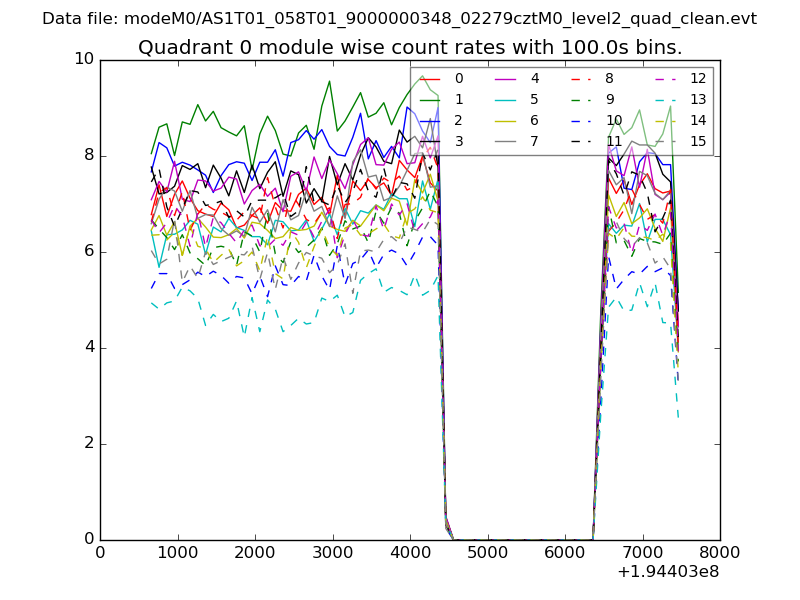 |
 |
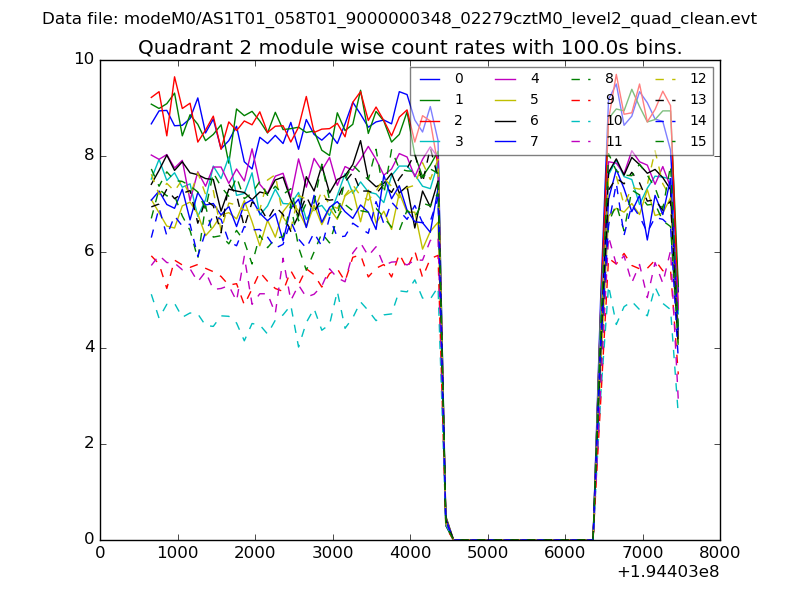
| Module-wise count rates for Quadrant B Data is divided into 100 sec bins |
 |
 |
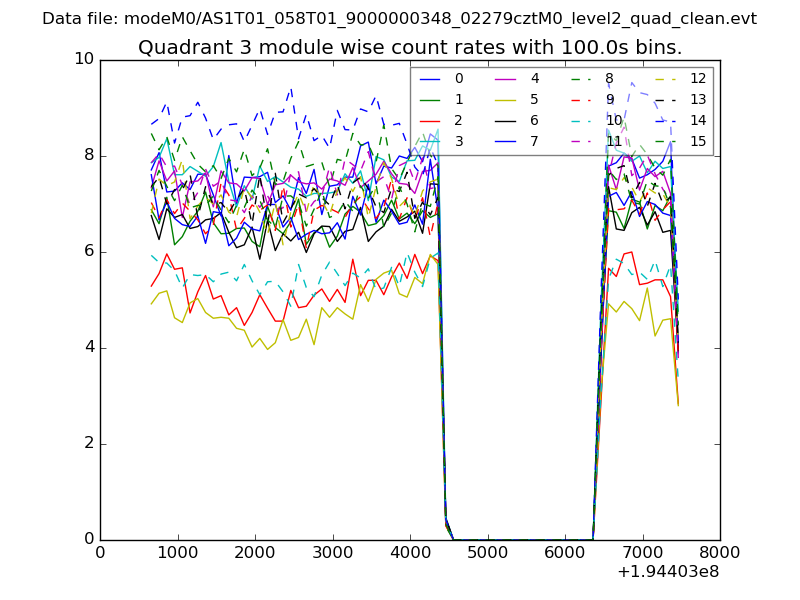
| Module-wise count rates for Quadrant C Data is divided into 100 sec bins |
 |
 |
| Module-wise count rates for Quadrant D Data is divided into 100 sec bins |
 |
 |
| Parameter | Plot |
|---|---|
| CZT HV Monitor | 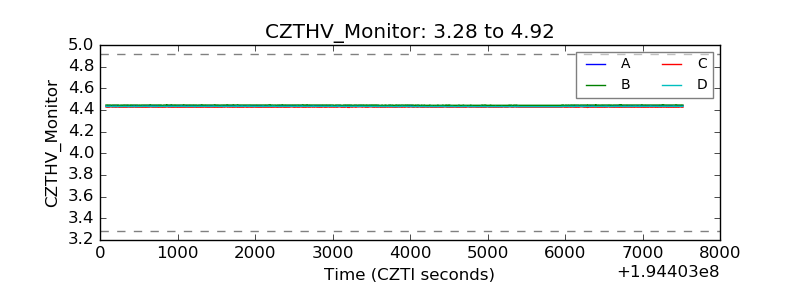 |
| D_VDD | 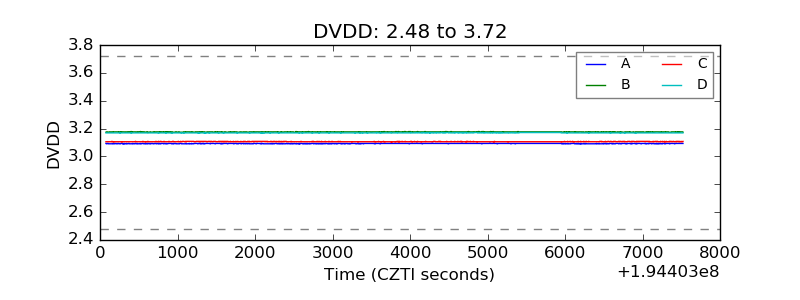 |
| Temperature 1 | 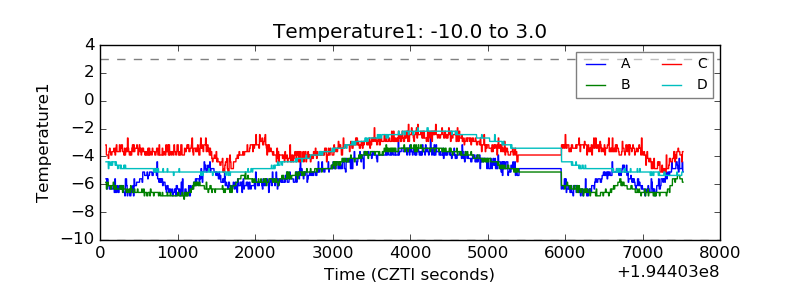 |
| Veto HV Monitor | 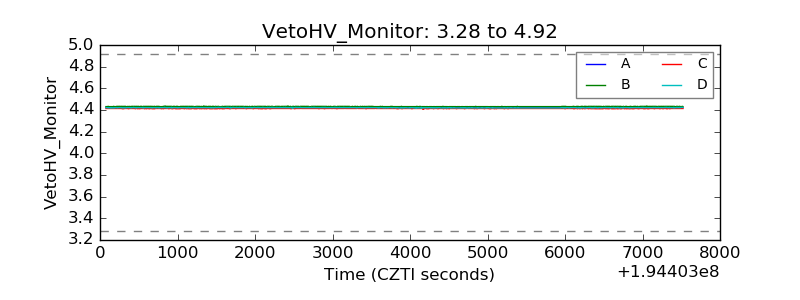 |
| Veto LLD | 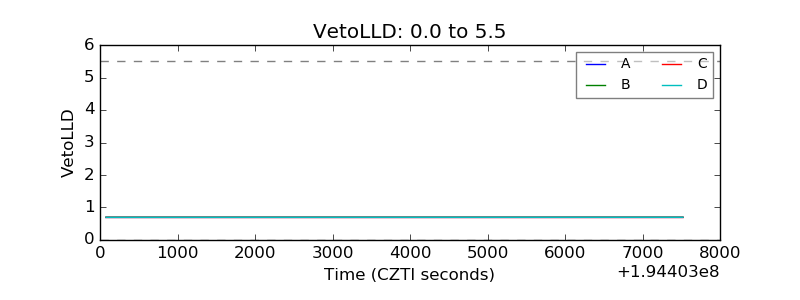 |
| Alpha Counter | 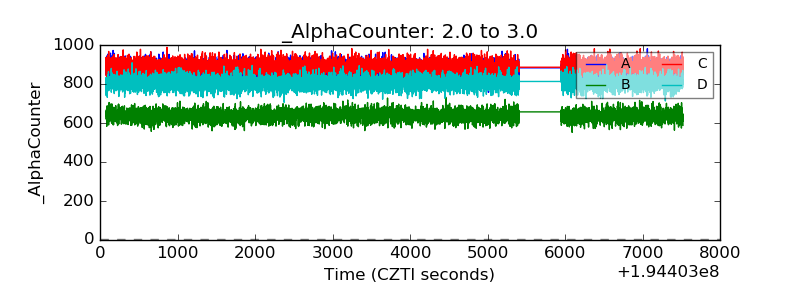 |
| _CPM_Rate | 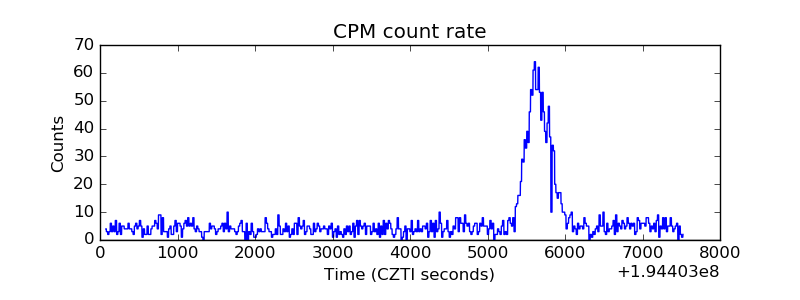 |
| CZT Counter | 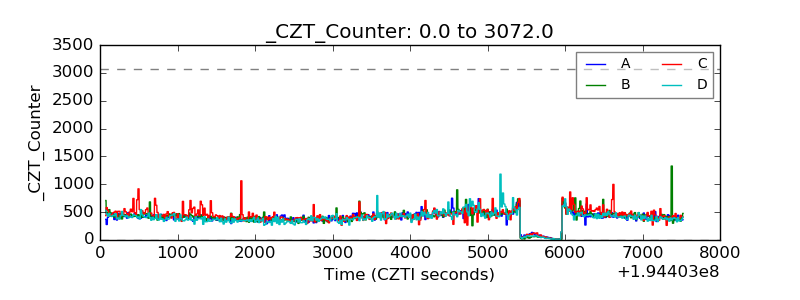 |
| +2.5 Volts monitor |  |
| +5 Volts monitor |  |
| _ROLL_ROT | 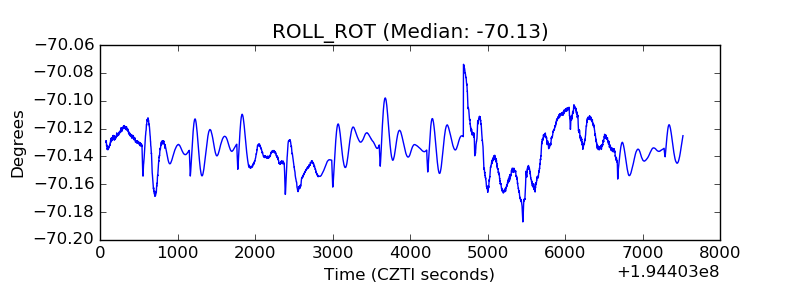 |
| _Roll_DEC | 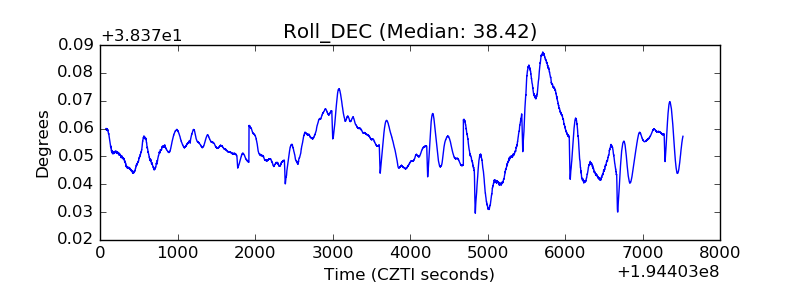 |
| _Roll_RA | 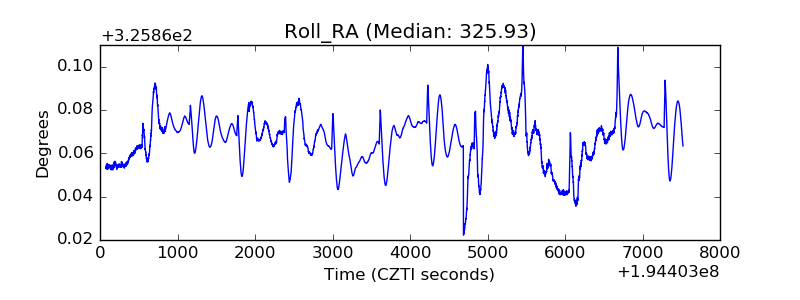 |
| Veto Counter | 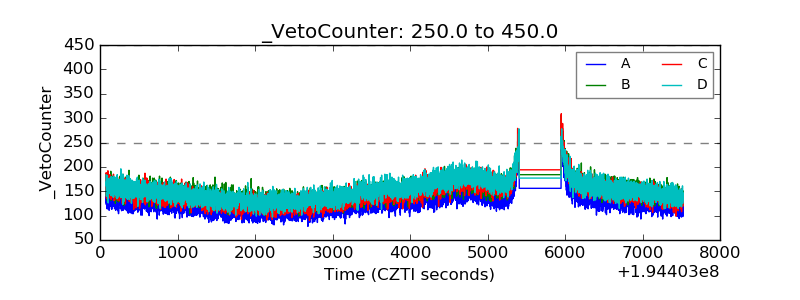 |