| Param | Original file | Final file |
|---|---|---|
| Filename | modeM0/AS1T01_058T01_9000000348_02280cztM0_level2.evt | modeM0/AS1T01_058T01_9000000348_02280cztM0_level2_quad_clean.evt |
| Size (bytes) | 389,148,480 | 90,489,600 |
| Size | 371.1 MB | 86.3 MB |
| Events in quadrant A | 2,754,715 | 562,891 |
| Events in quadrant B | 2,976,887 | 572,947 |
| Events in quadrant C | 2,847,870 | 583,502 |
| Events in quadrant D | 2,763,220 | 567,682 |
| Mode M9 | |||
|---|---|---|---|
| Quadrant | BADHDUFLAG | Total packets | Discarded packets |
| A | 0 | 1 | 0 |
| B | 1 | 1 | 0 |
| C | 1 | -1 | -1 |
| D | 1 | -1 | -1 |
| Mode SS | |||
|---|---|---|---|
| Quadrant | BADHDUFLAG | Total packets | Discarded packets |
| A | 0 | 130 | 0 |
| B | 0 | 130 | 0 |
| C | 0 | 130 | 0 |
| D | 0 | 130 | 0 |
| Mode M0 | |||
|---|---|---|---|
| Quadrant | BADHDUFLAG | Total packets | Discarded packets |
| A | 0 | 13129 | 1 |
| B | 0 | 13652 | 1 |
| C | 0 | 13224 | 1 |
| D | 0 | 13367 | 1 |
| Quadrant | Total seconds | Saturated seconds | Saturation percentage |
|---|---|---|---|
| A | 6500 | 23 | 0.353846% |
| B | 6500 | 40 | 0.615385% |
| C | 6500 | 5 | 0.076923% |
| D | 6500 | 24 | 0.369231% |
Noise dominated data is calculated using 1-second bins in cleaned event files. If a bin has >2000 counts, and if more than 50% of those come from <1% of pixels, then it is considered to be noise-dominated and hence unusable.
| Quadrant | # 1 sec bins | Bins with >0 counts | Bins with >2000 counts | High rate bins dominated by noise | Noise dominated (total time) | Noise dominated (detector-on time) | Marked lightcurve |
|---|---|---|---|---|---|---|---|
| A | 7185 | 6500 | 0 | 0 | 0.00% | 0.00% | 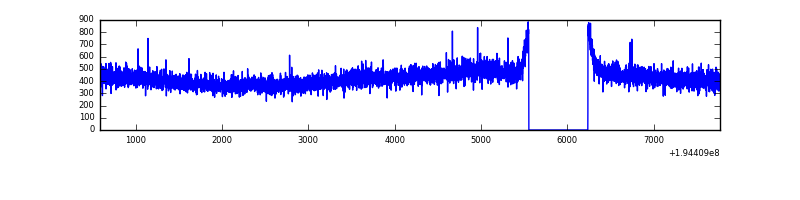 |
| B | 7185 | 6500 | 10 | 10 | 0.14% | 0.15% | 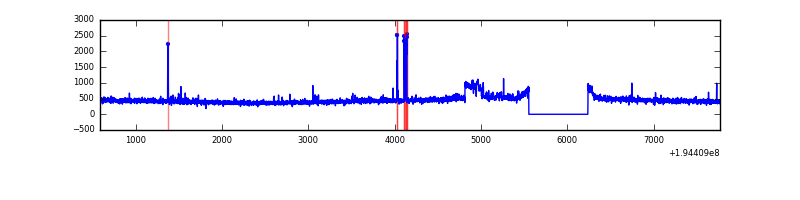 |
| C | 7185 | 6501 | 1 | 1 | 0.01% | 0.02% | 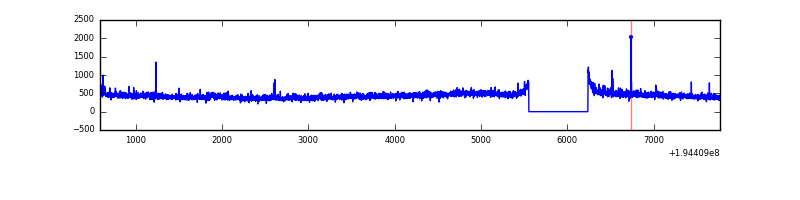 |
| D | 7185 | 6501 | 12 | 12 | 0.17% | 0.18% | 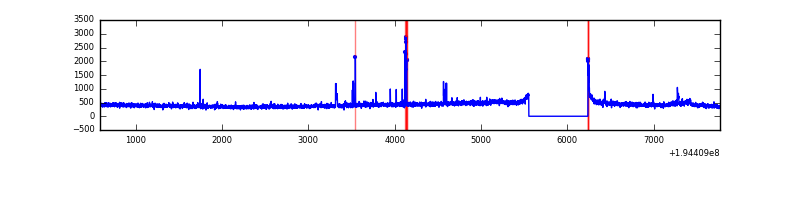 |
Top three noisy pixels from each quadrant. If the there are fewer than three noisy pixels in the level2.evt file, extra rows are filled as -1
| Pixel properties | Quadrant properties | ||||||
|---|---|---|---|---|---|---|---|
| Quadrant | DetID | PixID | Counts | Sigma | Mean | Median | Sigma |
| A | 12 | 194 | 8029 | 49.85 | 714 | 698 | 147.1 |
| A | 0 | 226 | 7709 | 47.67 | 714 | 698 | 147.1 |
| A | 13 | 9 | 2783 | 14.18 | 714 | 698 | 147.1 |
| B | 3 | 0 | 148691 | 1053.63 | 724 | 706 | 140.5 |
| B | 15 | 85 | 30953 | 215.35 | 724 | 706 | 140.5 |
| B | 12 | 111 | 10999 | 73.28 | 724 | 706 | 140.5 |
| C | 5 | 234 | 72691 | 432.04 | 701 | 704 | 166.6 |
| C | 14 | 252 | 10257 | 57.33 | 701 | 704 | 166.6 |
| C | 8 | 112 | 8060 | 44.15 | 701 | 704 | 166.6 |
| D | 9 | 66 | 62730 | 378.54 | 689 | 673 | 163.9 |
| D | 9 | 64 | 39765 | 238.46 | 689 | 673 | 163.9 |
| D | 12 | 126 | 33620 | 200.97 | 689 | 673 | 163.9 |
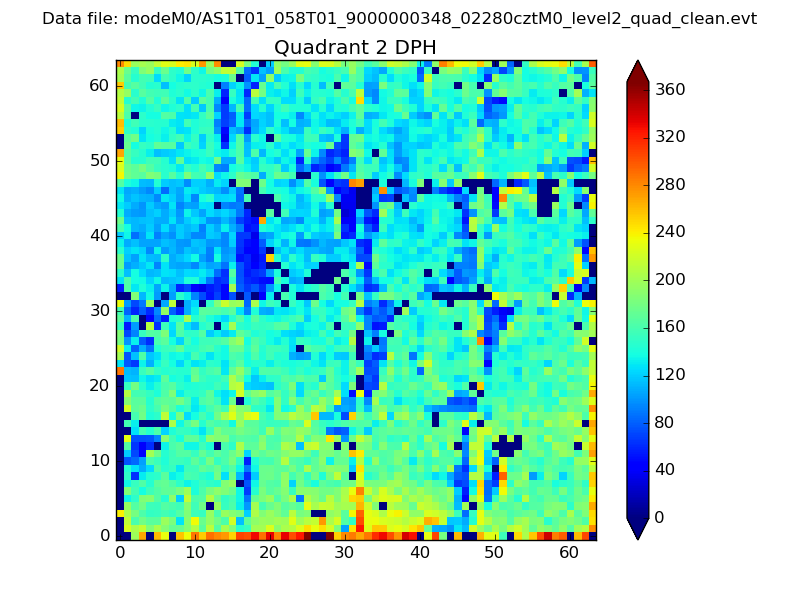
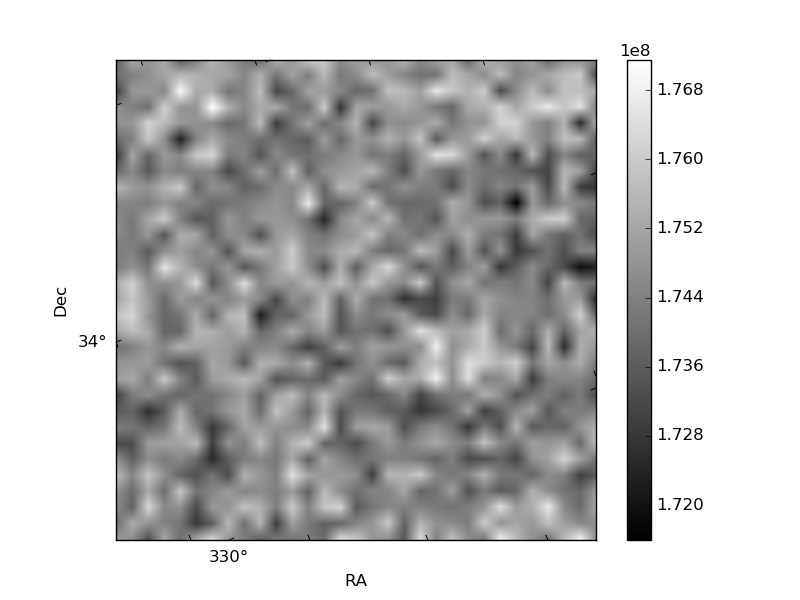
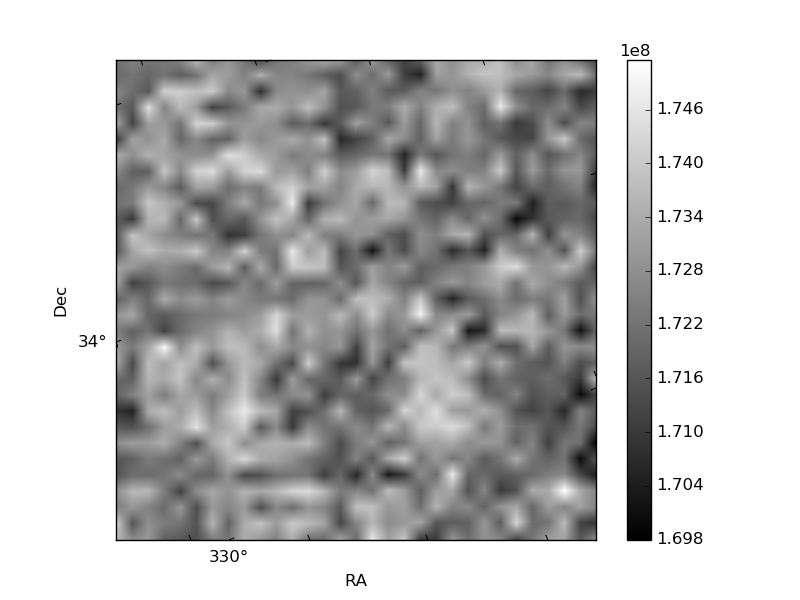
Histogram calculated using DETX and DETY for each event in the final _common_clean file
| Quadrant A | 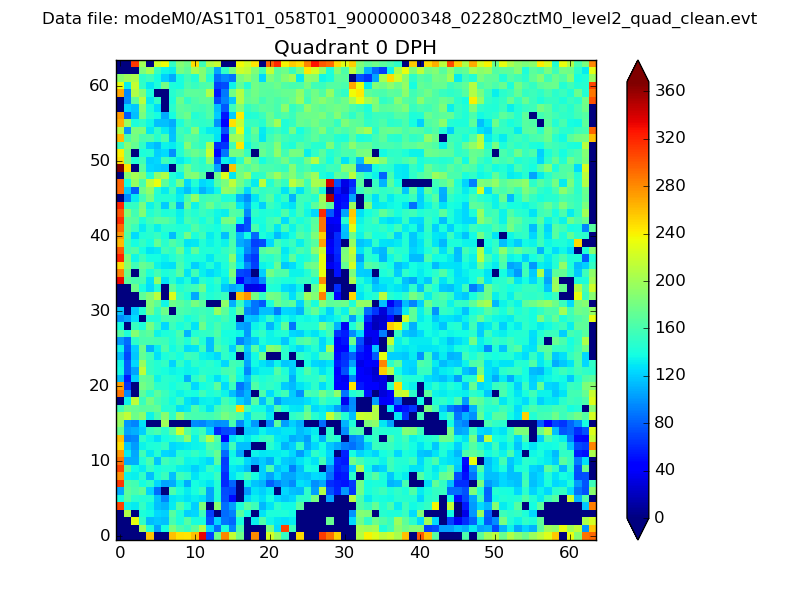 |
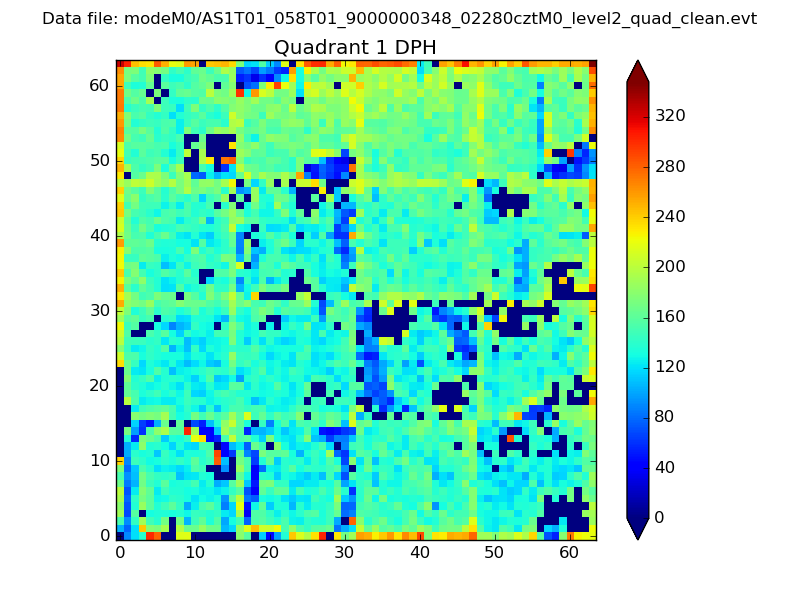 |
Quadrant B |
|---|---|---|---|
| Quadrant D | 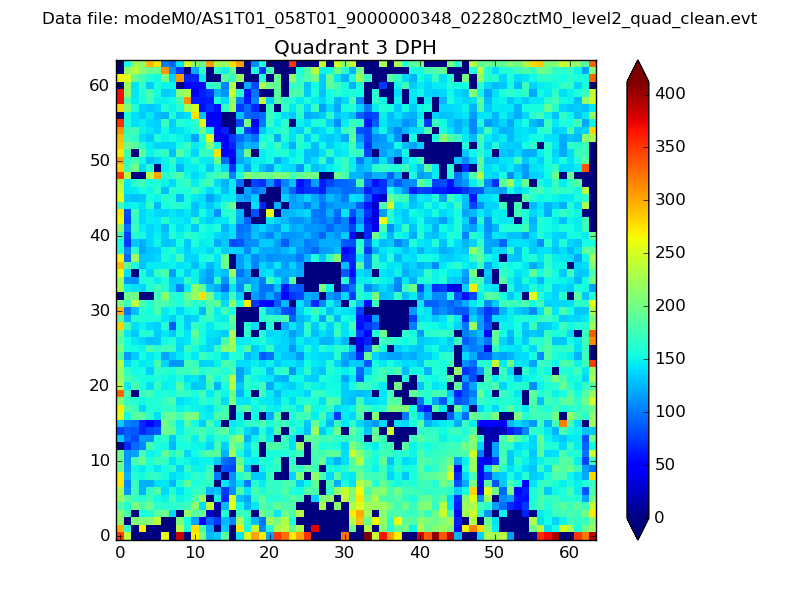 |
 |
Quadrant C |
| Plot type | Count rate plots | Images |
|---|---|---|
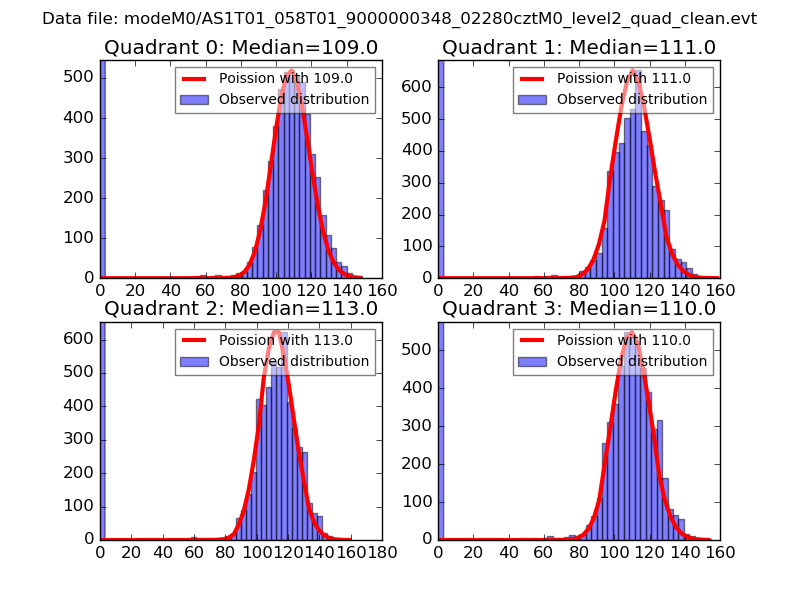
| Comparison with Poisson distribution Blue bars denote a histogram of data divided into 1 sec bins. Red curve is a Poisson curve with rate = median count rate of data. |
 |
 |
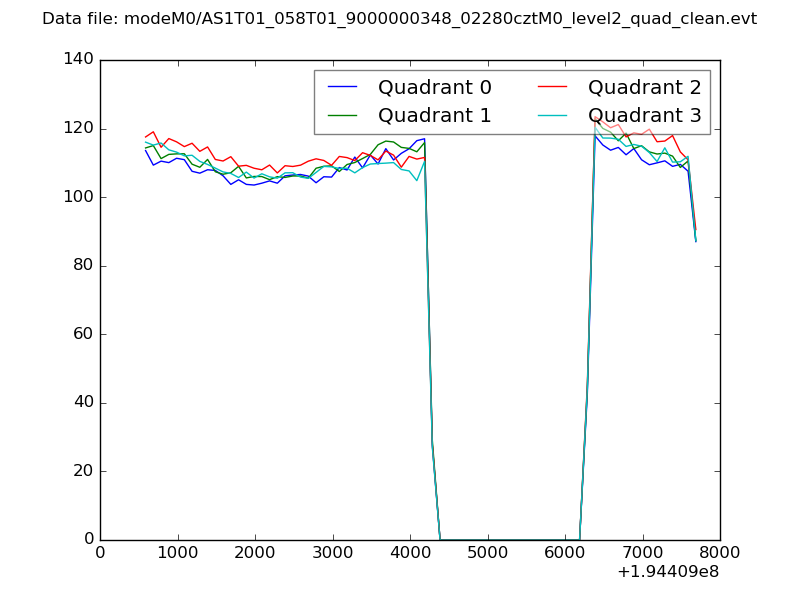
| Quadrant-wise count rates Data is divided into 100 sec bins |
 |
|
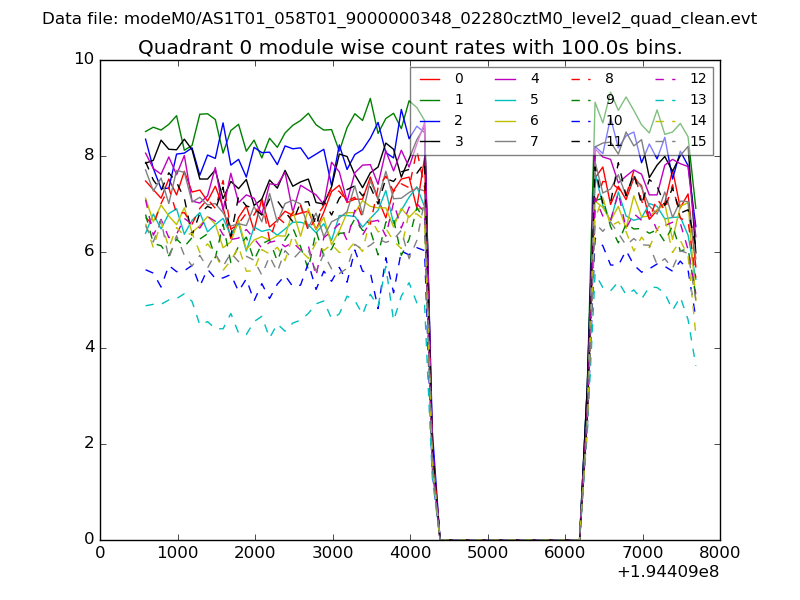
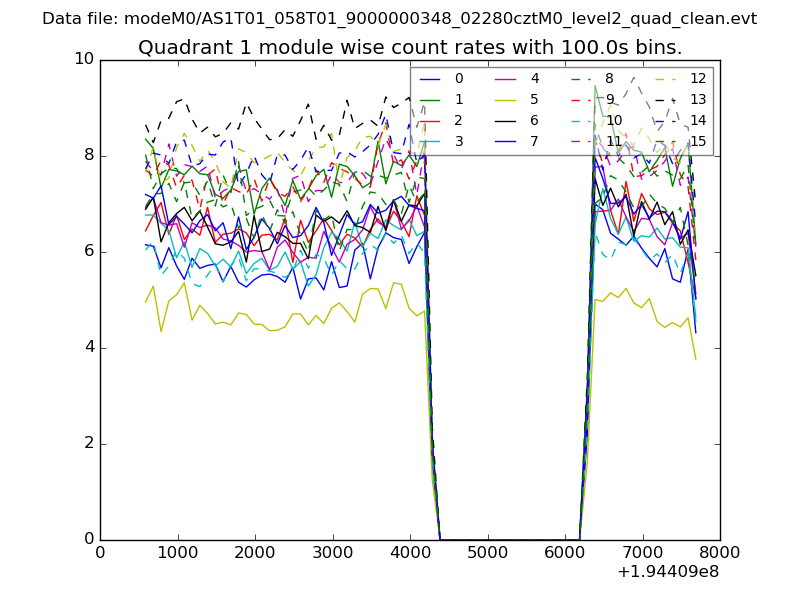
| Module-wise count rates for Quadrant A Data is divided into 100 sec bins |
 |
 |
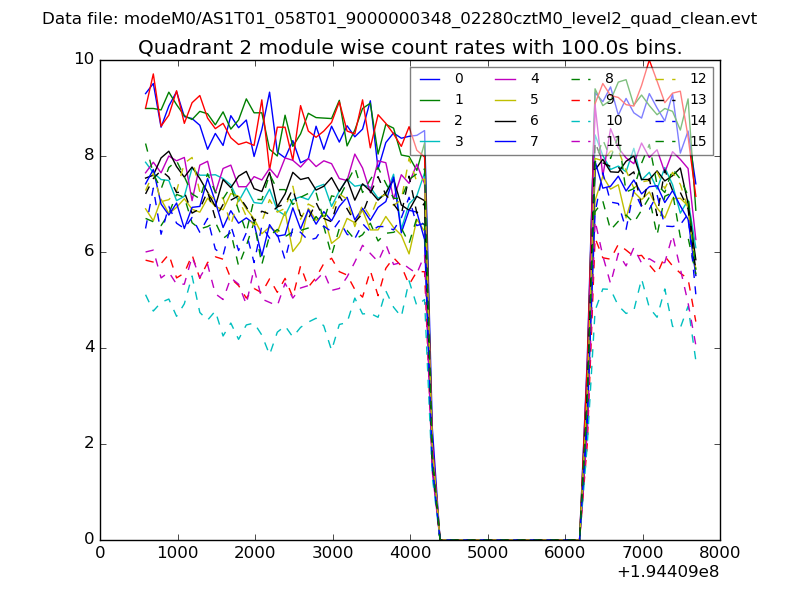
| Module-wise count rates for Quadrant B Data is divided into 100 sec bins |
 |
 |
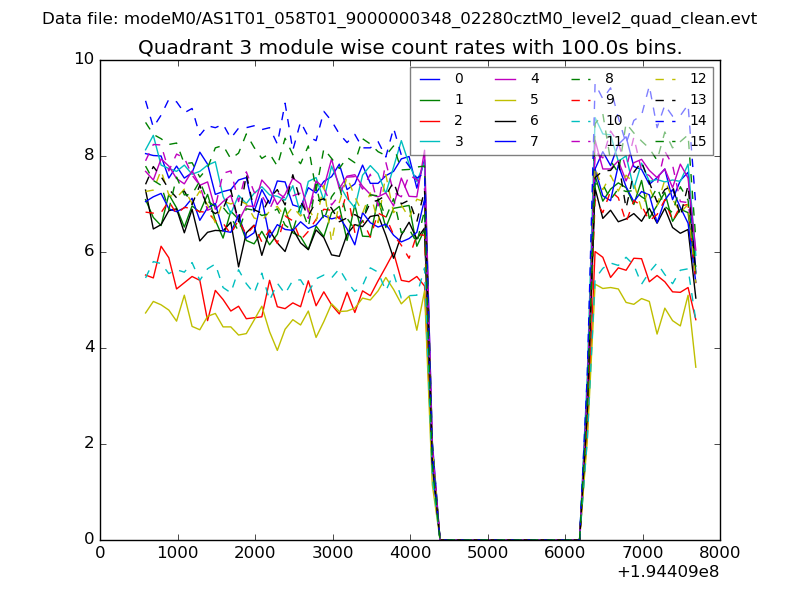
| Module-wise count rates for Quadrant C Data is divided into 100 sec bins |
 |
 |
| Module-wise count rates for Quadrant D Data is divided into 100 sec bins |
 |
 |
| Parameter | Plot |
|---|---|
| CZT HV Monitor | 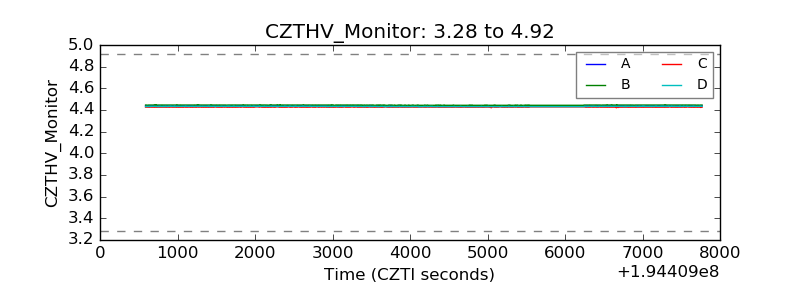 |
| D_VDD | 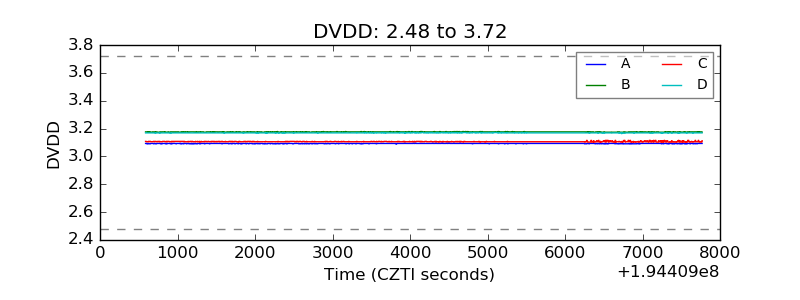 |
| Temperature 1 | 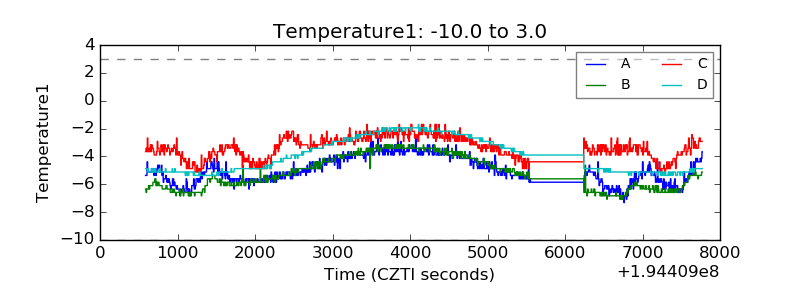 |
| Veto HV Monitor | 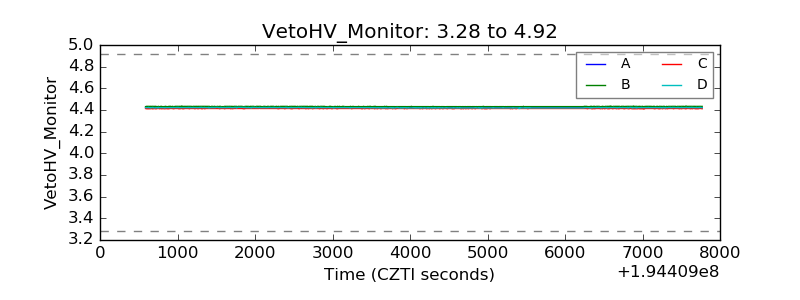 |
| Veto LLD | 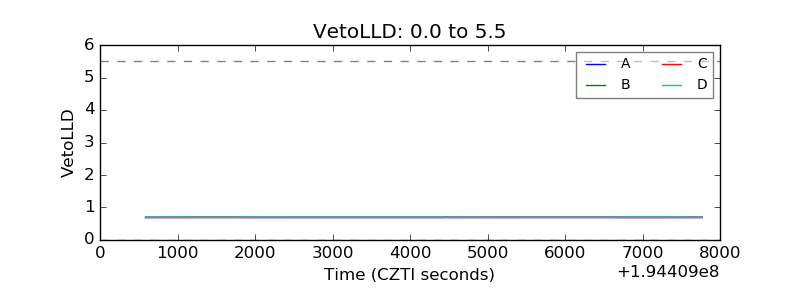 |
| Alpha Counter | 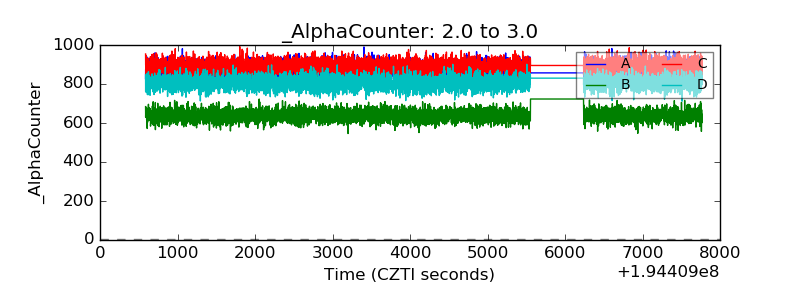 |
| _CPM_Rate | 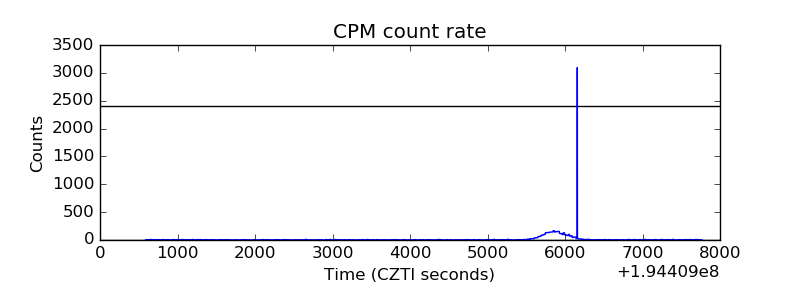 |
| CZT Counter | 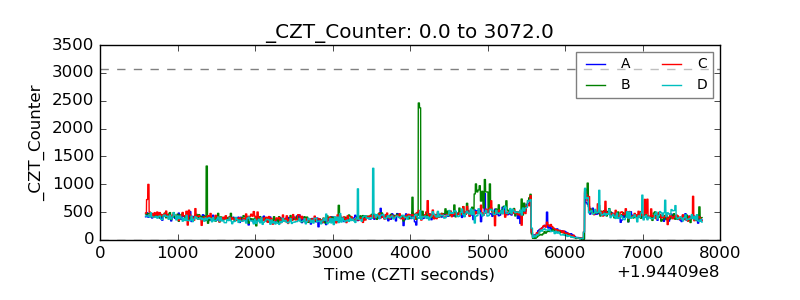 |
| +2.5 Volts monitor | 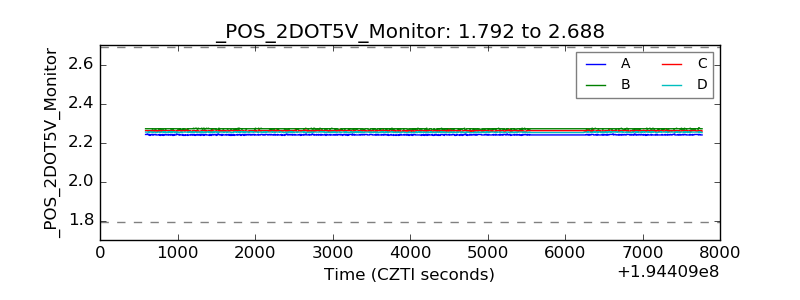 |
| +5 Volts monitor |  |
| _ROLL_ROT | 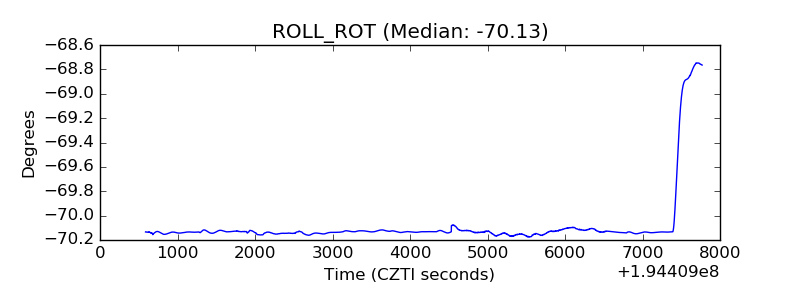 |
| _Roll_DEC | 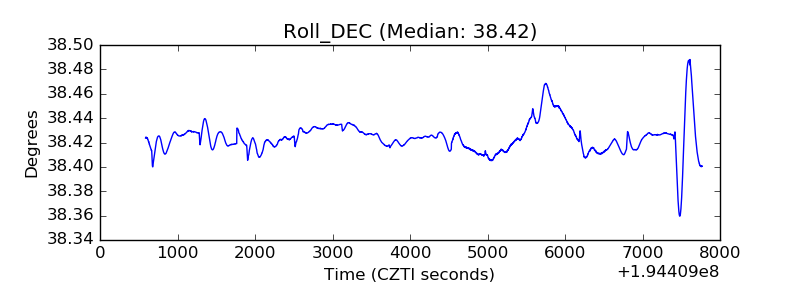 |
| _Roll_RA | 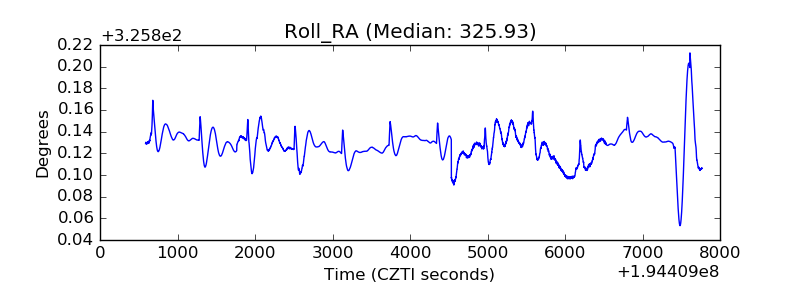 |
| Veto Counter | 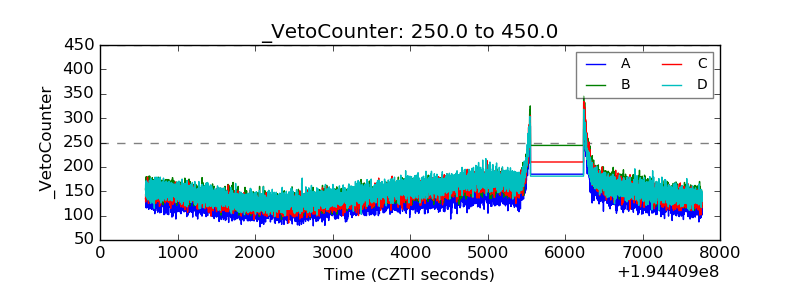 |