| Param | Original file | Final file |
|---|---|---|
| Filename | modeM0/AS1T01_058T01_9000000348_02281cztM0_level2.evt | modeM0/AS1T01_058T01_9000000348_02281cztM0_level2_quad_clean.evt |
| Size (bytes) | 380,517,120 | 88,655,040 |
| Size | 362.9 MB | 84.5 MB |
| Events in quadrant A | 2,735,624 | 551,701 |
| Events in quadrant B | 2,806,763 | 562,025 |
| Events in quadrant C | 2,854,176 | 568,137 |
| Events in quadrant D | 2,685,452 | 550,513 |
| Mode M9 | |||
|---|---|---|---|
| Quadrant | BADHDUFLAG | Total packets | Discarded packets |
| A | 0 | 1 | 0 |
| B | 1 | 1 | 0 |
| C | 1 | -1 | -1 |
| D | 1 | -1 | -1 |
| Mode SS | |||
|---|---|---|---|
| Quadrant | BADHDUFLAG | Total packets | Discarded packets |
| A | 0 | 130 | 0 |
| B | 0 | 130 | 0 |
| C | 0 | 130 | 0 |
| D | 0 | 130 | 0 |
| Mode M0 | |||
|---|---|---|---|
| Quadrant | BADHDUFLAG | Total packets | Discarded packets |
| A | 0 | 13067 | 1 |
| B | 0 | 13130 | 1 |
| C | 0 | 13209 | 1 |
| D | 0 | 13165 | 5 |
| Quadrant | Total seconds | Saturated seconds | Saturation percentage |
|---|---|---|---|
| A | 6487 | 9 | 0.138739% |
| B | 6487 | 9 | 0.138739% |
| C | 6487 | 5 | 0.077077% |
| D | 6485 | 11 | 0.169622% |
Noise dominated data is calculated using 1-second bins in cleaned event files. If a bin has >2000 counts, and if more than 50% of those come from <1% of pixels, then it is considered to be noise-dominated and hence unusable.
| Quadrant | # 1 sec bins | Bins with >0 counts | Bins with >2000 counts | High rate bins dominated by noise | Noise dominated (total time) | Noise dominated (detector-on time) | Marked lightcurve |
|---|---|---|---|---|---|---|---|
| A | 7377 | 6487 | 0 | 0 | 0.00% | 0.00% |  |
| B | 7377 | 6488 | 1 | 1 | 0.01% | 0.02% |  |
| C | 7377 | 6488 | 3 | 3 | 0.04% | 0.05% | 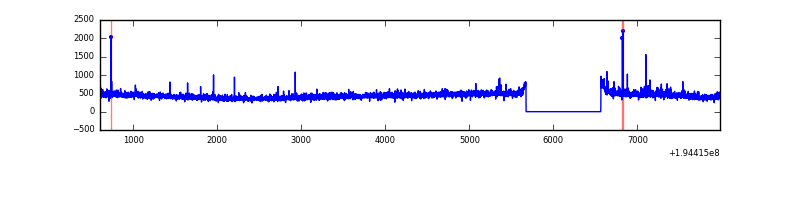 |
| D | 7377 | 6487 | 5 | 5 | 0.07% | 0.08% |  |
Top three noisy pixels from each quadrant. If the there are fewer than three noisy pixels in the level2.evt file, extra rows are filled as -1
| Pixel properties | Quadrant properties | ||||||
|---|---|---|---|---|---|---|---|
| Quadrant | DetID | PixID | Counts | Sigma | Mean | Median | Sigma |
| A | 12 | 194 | 8007 | 50.56 | 710 | 693 | 144.7 |
| A | 0 | 226 | 7414 | 46.46 | 710 | 693 | 144.7 |
| A | 8 | 34 | 1768 | 7.43 | 710 | 693 | 144.7 |
| B | 0 | 228 | 15953 | 109.69 | 721 | 702 | 139.0 |
| B | 12 | 111 | 10644 | 71.5 | 721 | 702 | 139.0 |
| B | 11 | 111 | 8930 | 59.18 | 721 | 702 | 139.0 |
| C | 5 | 234 | 100137 | 609.85 | 691 | 694 | 163.1 |
| C | 8 | 112 | 26953 | 161.04 | 691 | 694 | 163.1 |
| C | 8 | 128 | 11493 | 66.22 | 691 | 694 | 163.1 |
| D | 9 | 66 | 38841 | 233.47 | 682 | 664 | 163.5 |
| D | 9 | 64 | 20060 | 118.62 | 682 | 664 | 163.5 |
| D | 13 | 169 | 19474 | 115.03 | 682 | 664 | 163.5 |
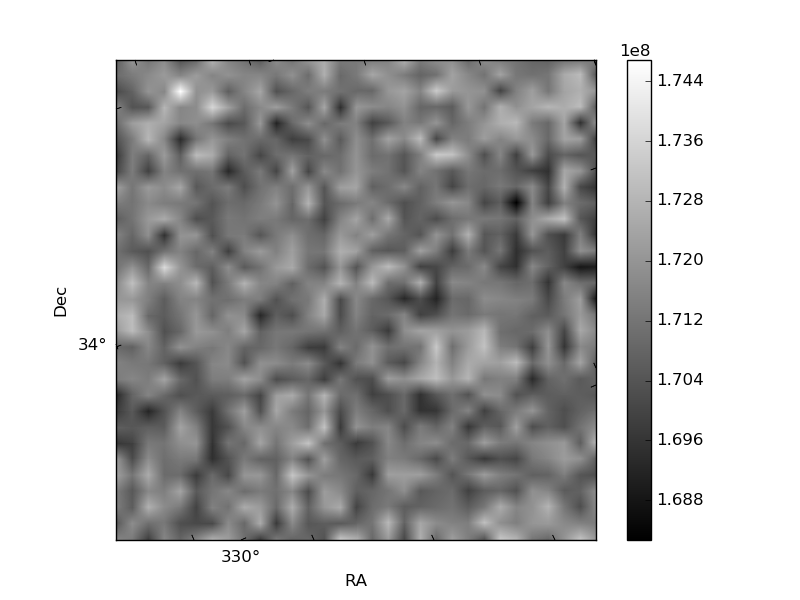
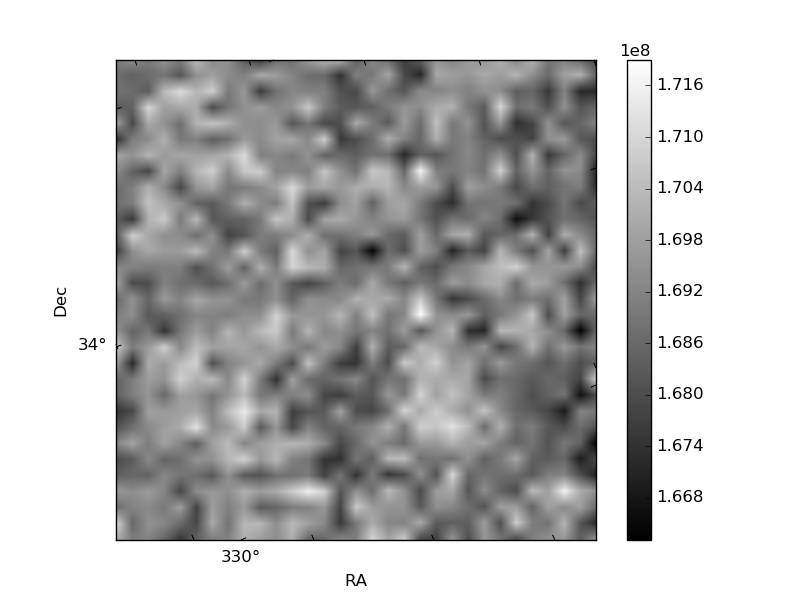
Histogram calculated using DETX and DETY for each event in the final _common_clean file
| Quadrant A | 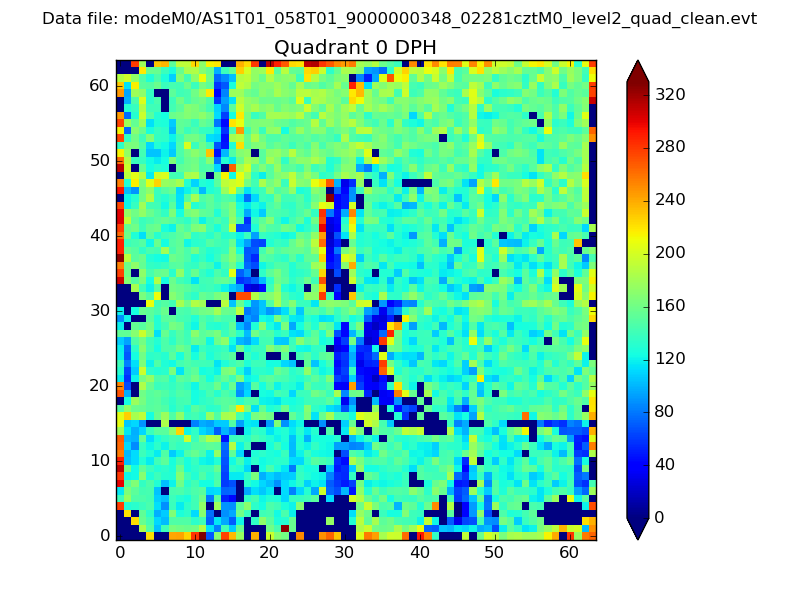 |
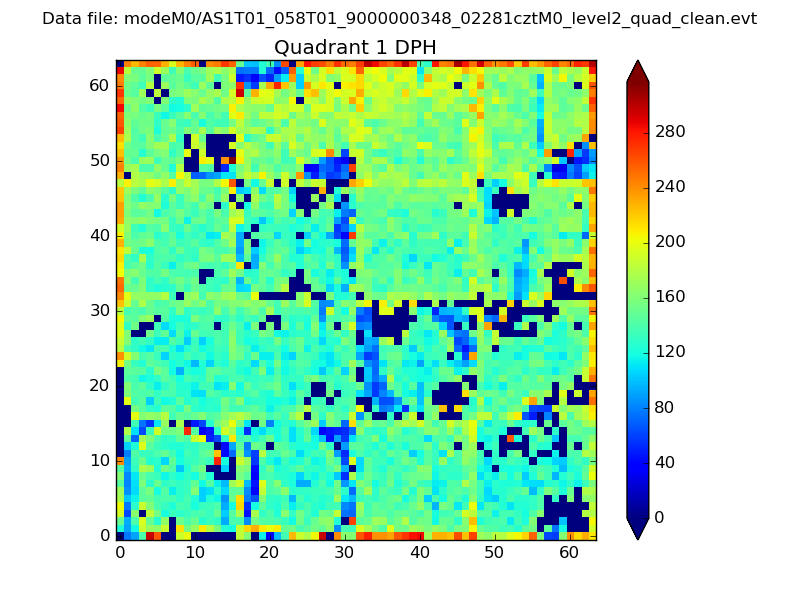 |
Quadrant B |
|---|---|---|---|
| Quadrant D | 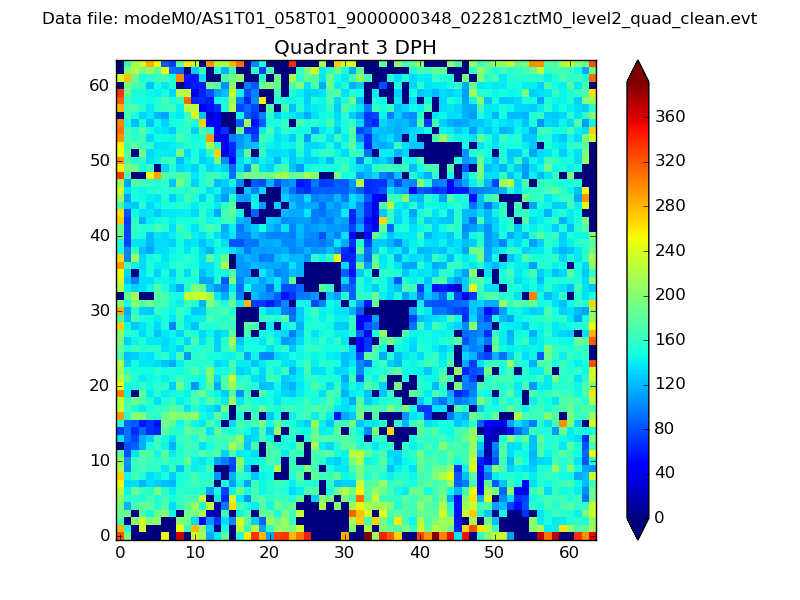 |
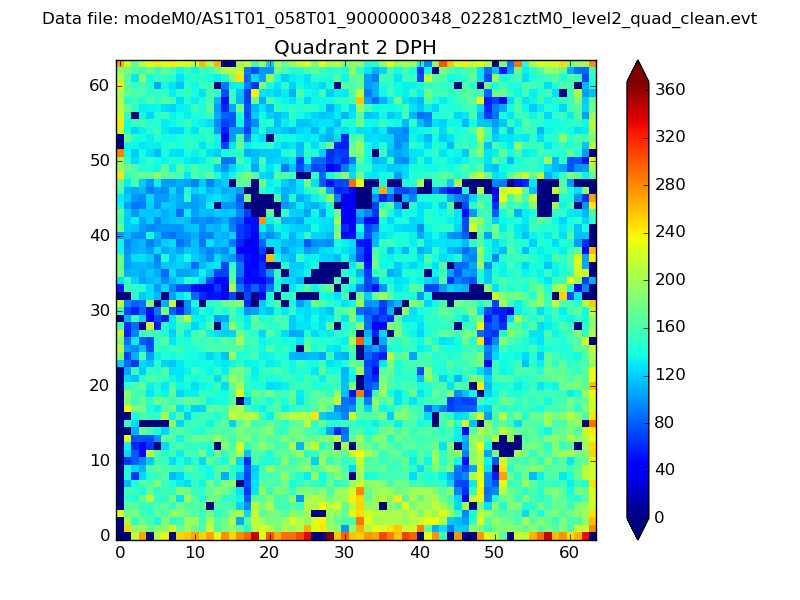 |
Quadrant C |
| Plot type | Count rate plots | Images |
|---|---|---|
| Comparison with Poisson distribution Blue bars denote a histogram of data divided into 1 sec bins. Red curve is a Poisson curve with rate = median count rate of data. |
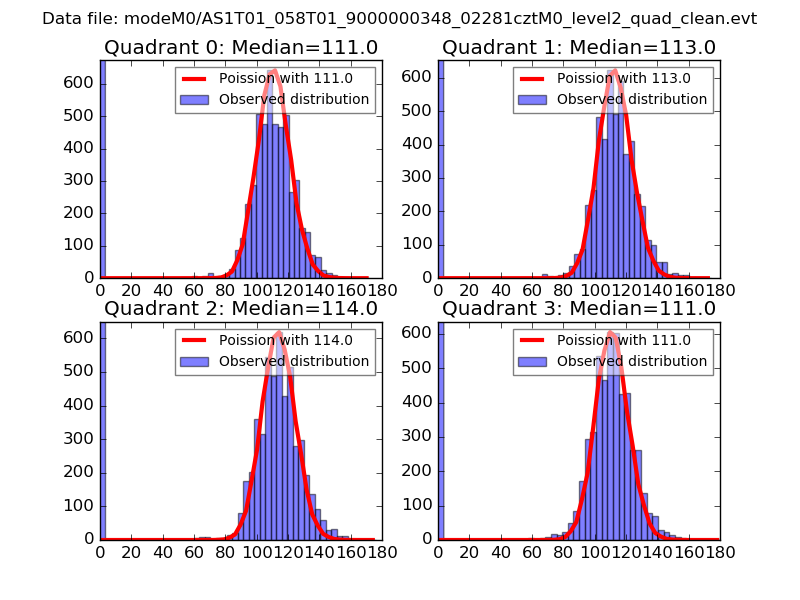 |
 |
| Quadrant-wise count rates Data is divided into 100 sec bins |
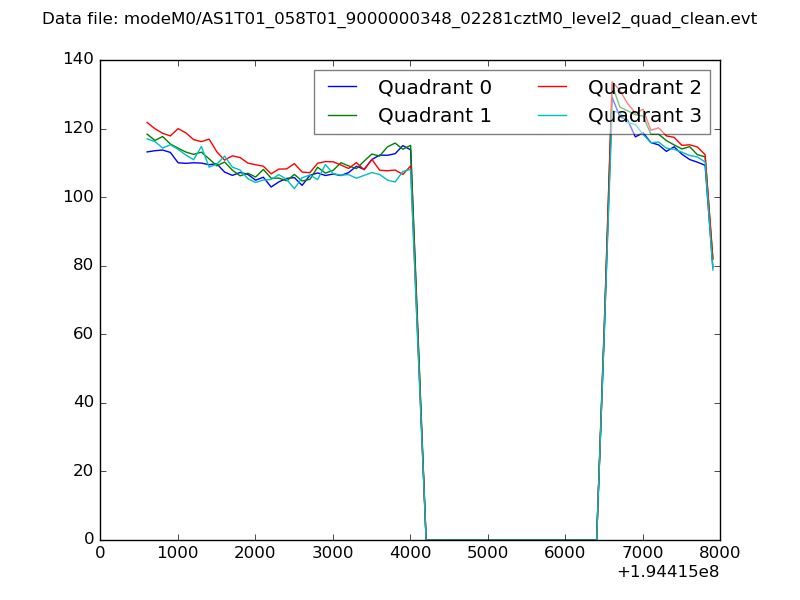 |
|
| Module-wise count rates for Quadrant A Data is divided into 100 sec bins |
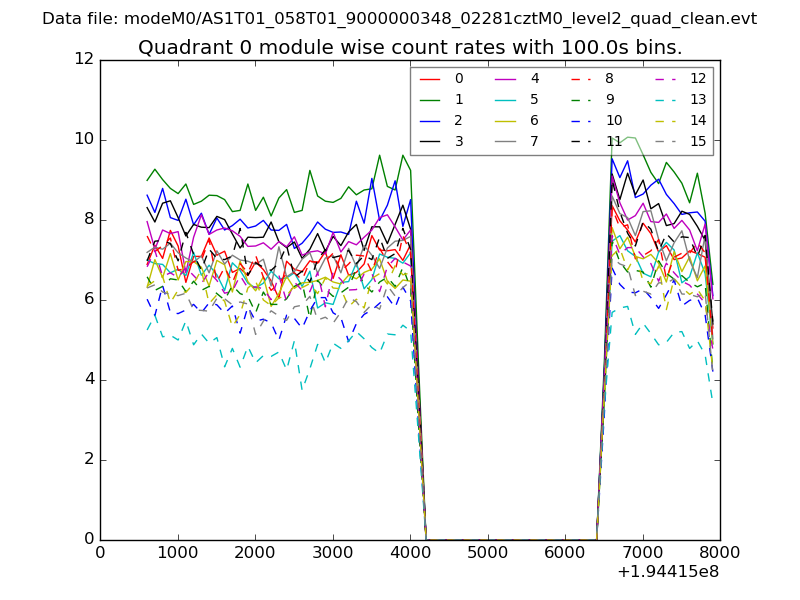 |
 |
| Module-wise count rates for Quadrant B Data is divided into 100 sec bins |
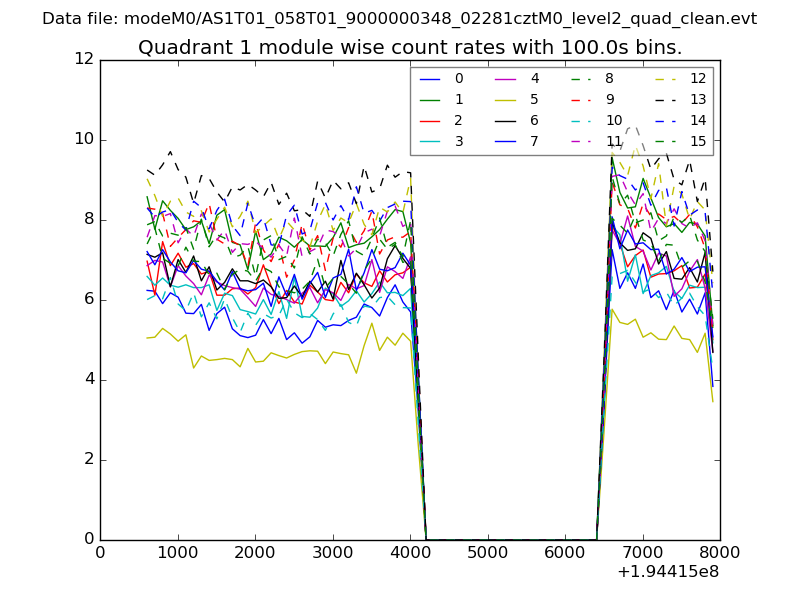 |
 |
| Module-wise count rates for Quadrant C Data is divided into 100 sec bins |
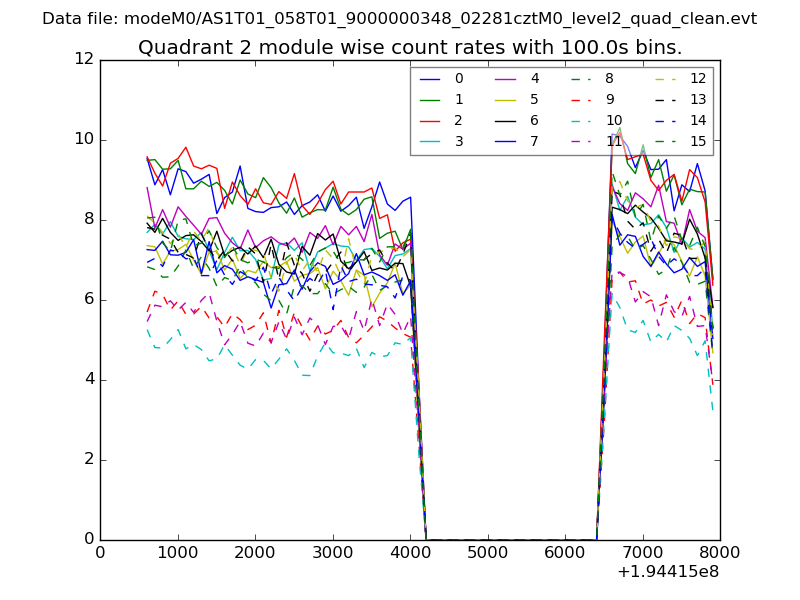 |
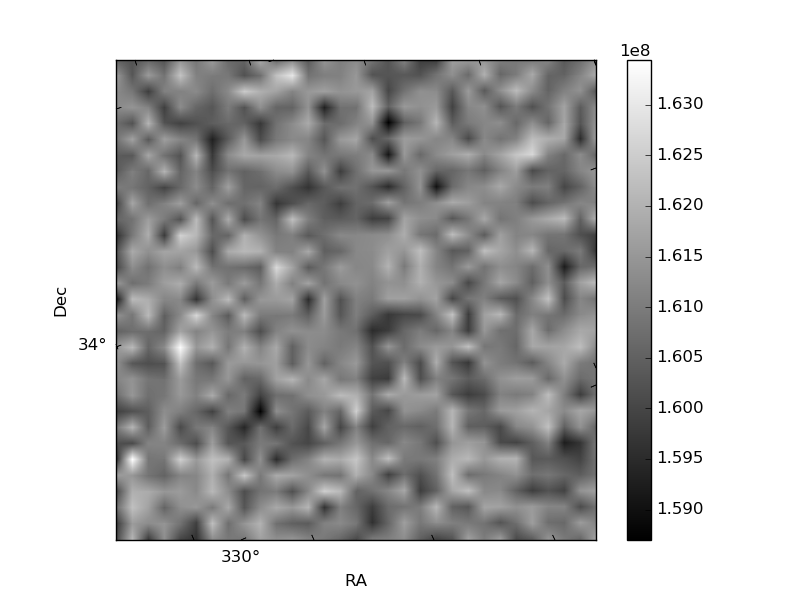 |
| Module-wise count rates for Quadrant D Data is divided into 100 sec bins |
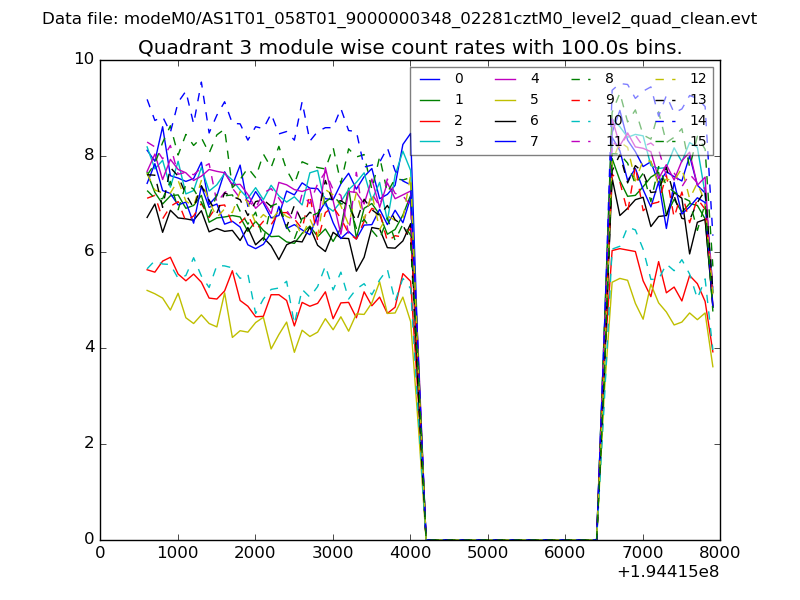 |
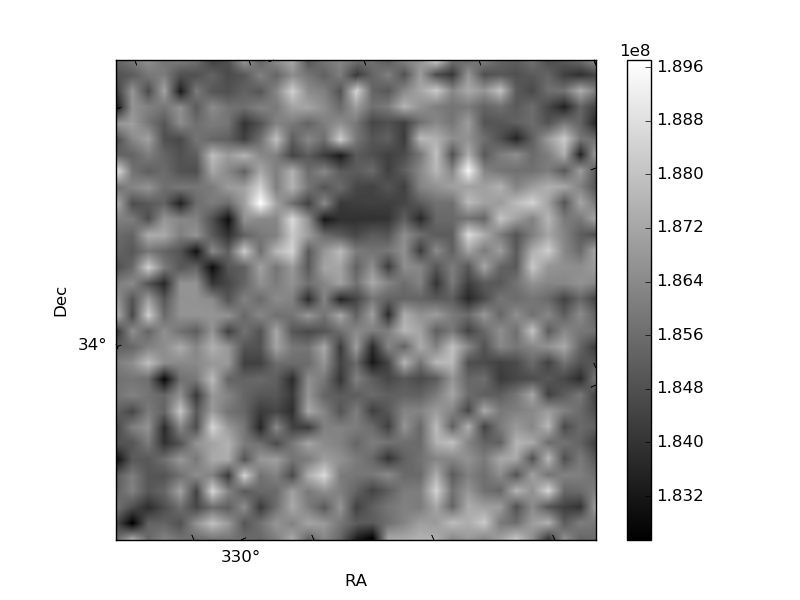 |
| Parameter | Plot |
|---|---|
| CZT HV Monitor | 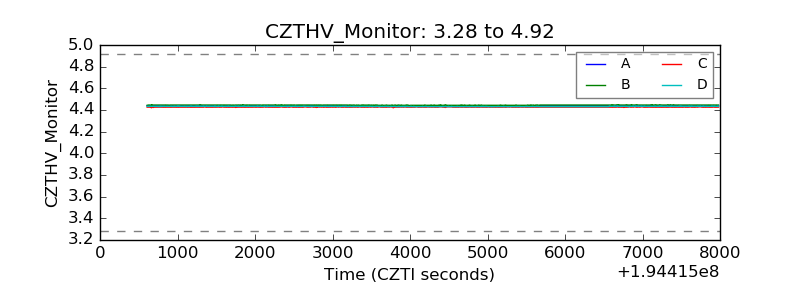 |
| D_VDD | 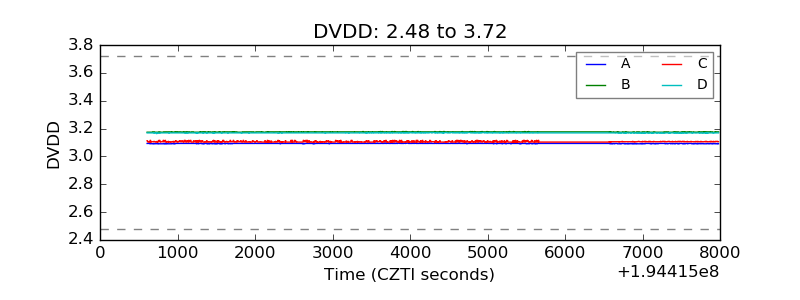 |
| Temperature 1 | 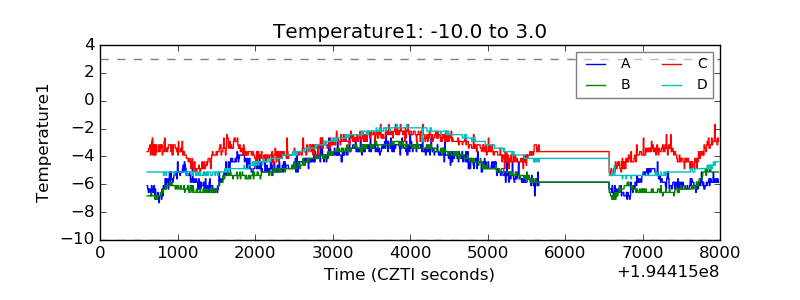 |
| Veto HV Monitor | 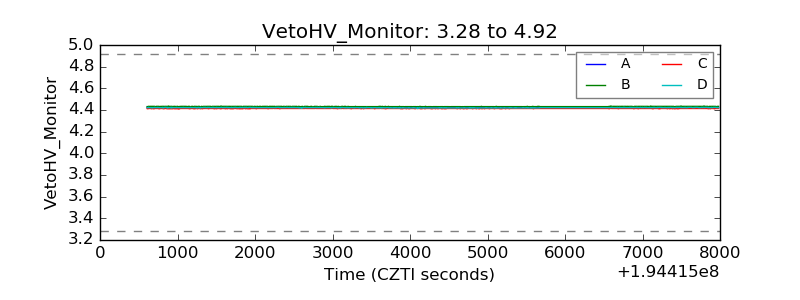 |
| Veto LLD | 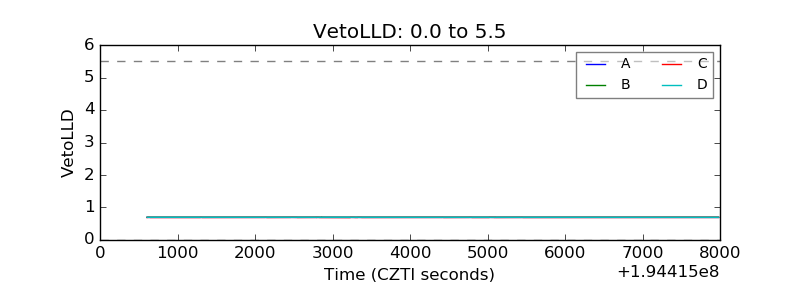 |
| Alpha Counter | 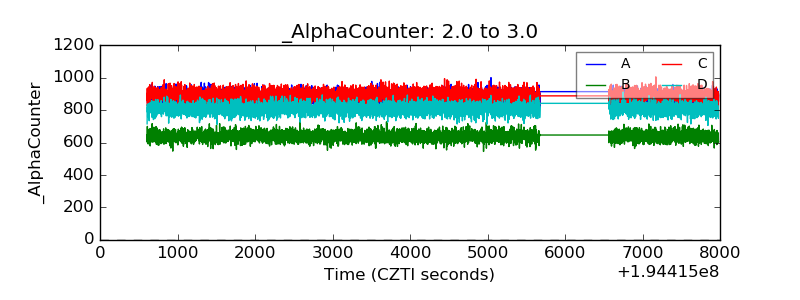 |
| _CPM_Rate | 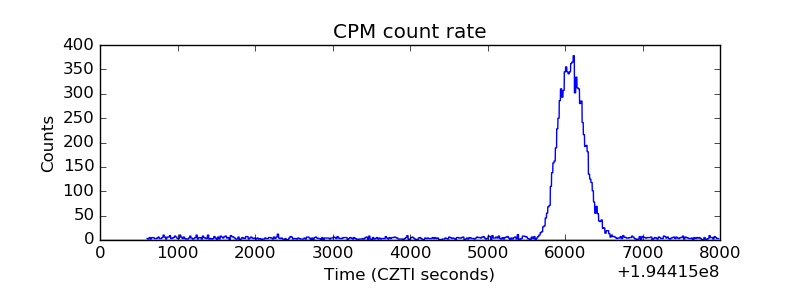 |
| CZT Counter | 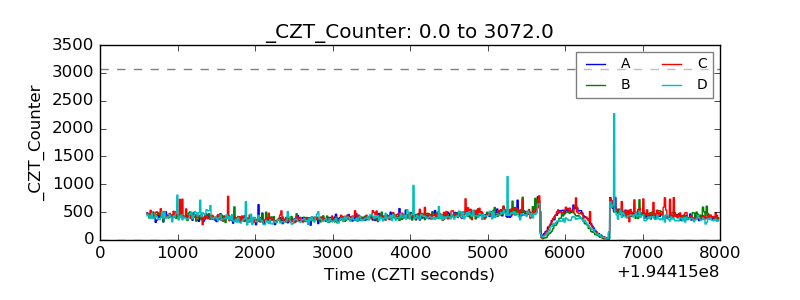 |
| +2.5 Volts monitor |  |
| +5 Volts monitor |  |
| _ROLL_ROT | 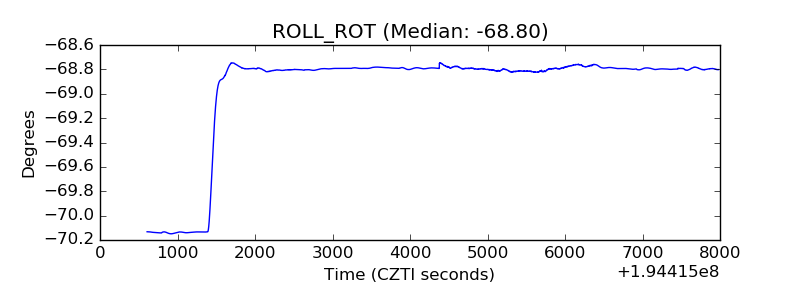 |
| _Roll_DEC | 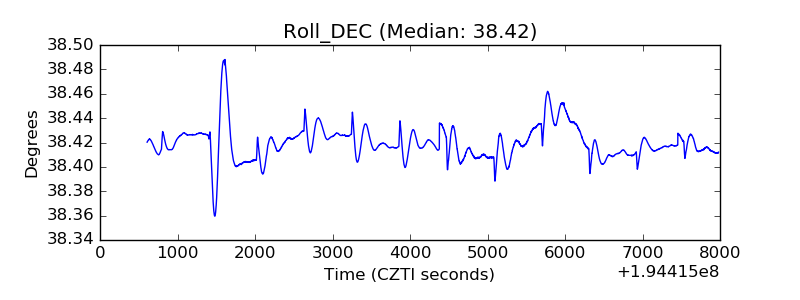 |
| _Roll_RA | 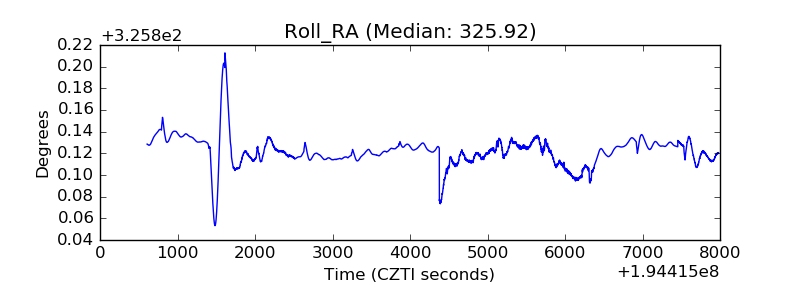 |
| Veto Counter | 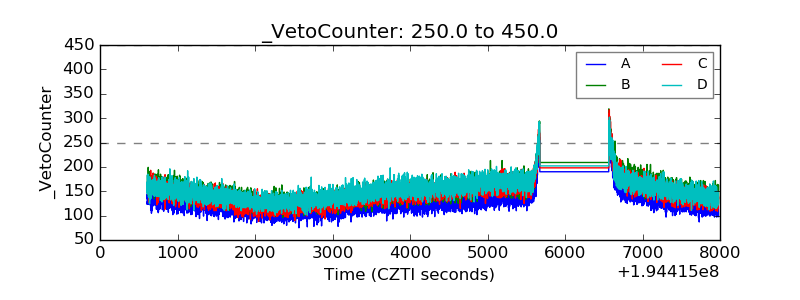 |