| Param | Original file | Final file |
|---|---|---|
| Filename | modeM0/AS1T01_058T01_9000000348_02282cztM0_level2.evt | modeM0/AS1T01_058T01_9000000348_02282cztM0_level2_quad_clean.evt |
| Size (bytes) | 346,515,840 | 75,372,480 |
| Size | 330.5 MB | 71.9 MB |
| Events in quadrant A | 2,501,084 | 463,681 |
| Events in quadrant B | 2,565,627 | 472,464 |
| Events in quadrant C | 2,570,197 | 473,881 |
| Events in quadrant D | 2,454,587 | 459,599 |
| Mode M9 | |||
|---|---|---|---|
| Quadrant | BADHDUFLAG | Total packets | Discarded packets |
| A | 0 | 1 | 0 |
| B | 1 | 1 | 0 |
| C | 1 | -1 | -1 |
| D | 1 | -1 | -1 |
| Mode SS | |||
|---|---|---|---|
| Quadrant | BADHDUFLAG | Total packets | Discarded packets |
| A | 0 | 118 | 0 |
| B | 0 | 118 | 0 |
| C | 0 | 118 | 0 |
| D | 0 | 118 | 0 |
| Mode M0 | |||
|---|---|---|---|
| Quadrant | BADHDUFLAG | Total packets | Discarded packets |
| A | 0 | 11939 | 1 |
| B | 0 | 12003 | 1 |
| C | 0 | 12036 | 1 |
| D | 0 | 12029 | 1 |
| Quadrant | Total seconds | Saturated seconds | Saturation percentage |
|---|---|---|---|
| A | 5906 | 18 | 0.304775% |
| B | 5906 | 35 | 0.592618% |
| C | 5906 | 8 | 0.135455% |
| D | 5906 | 7 | 0.118524% |
Noise dominated data is calculated using 1-second bins in cleaned event files. If a bin has >2000 counts, and if more than 50% of those come from <1% of pixels, then it is considered to be noise-dominated and hence unusable.
| Quadrant | # 1 sec bins | Bins with >0 counts | Bins with >2000 counts | High rate bins dominated by noise | Noise dominated (total time) | Noise dominated (detector-on time) | Marked lightcurve |
|---|---|---|---|---|---|---|---|
| A | 6930 | 5905 | 0 | 0 | 0.00% | 0.00% | 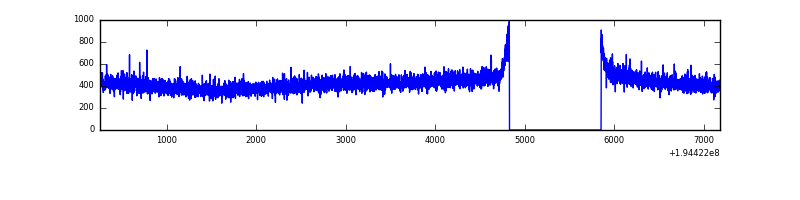 |
| B | 6931 | 5906 | 3 | 3 | 0.04% | 0.05% | 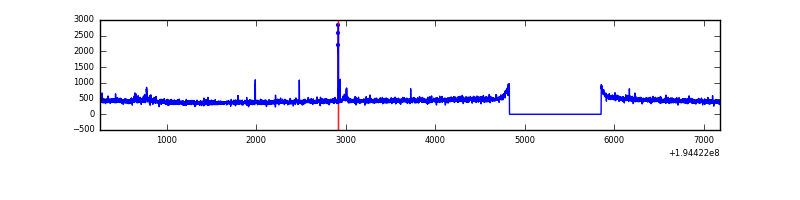 |
| C | 6931 | 5907 | 4 | 4 | 0.06% | 0.07% | 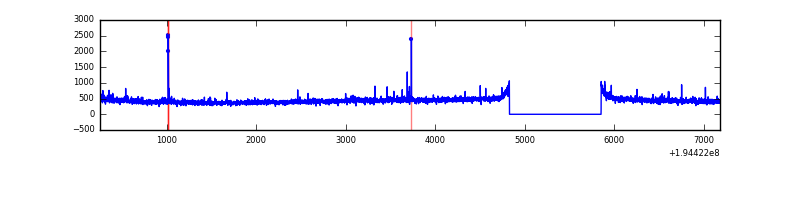 |
| D | 6931 | 5907 | 1 | 1 | 0.01% | 0.02% | 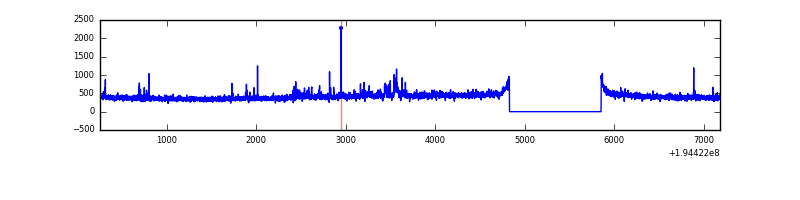 |
Top three noisy pixels from each quadrant. If the there are fewer than three noisy pixels in the level2.evt file, extra rows are filled as -1
| Pixel properties | Quadrant properties | ||||||
|---|---|---|---|---|---|---|---|
| Quadrant | DetID | PixID | Counts | Sigma | Mean | Median | Sigma |
| A | 12 | 194 | 7321 | 50.22 | 648 | 634 | 133.2 |
| A | 0 | 226 | 6975 | 47.62 | 648 | 634 | 133.2 |
| A | 13 | 9 | 2025 | 10.45 | 648 | 634 | 133.2 |
| B | 0 | 228 | 17776 | 135.89 | 655 | 639 | 126.1 |
| B | 15 | 85 | 12725 | 95.84 | 655 | 639 | 126.1 |
| B | 12 | 111 | 9623 | 71.24 | 655 | 639 | 126.1 |
| C | 5 | 234 | 84716 | 570.04 | 630 | 633 | 147.5 |
| C | 10 | 200 | 9030 | 56.92 | 630 | 633 | 147.5 |
| C | 10 | 65 | 7788 | 48.5 | 630 | 633 | 147.5 |
| D | 13 | 169 | 24833 | 163.13 | 625 | 611 | 148.5 |
| D | 9 | 64 | 19689 | 128.49 | 625 | 611 | 148.5 |
| D | 2 | 253 | 14619 | 94.34 | 625 | 611 | 148.5 |
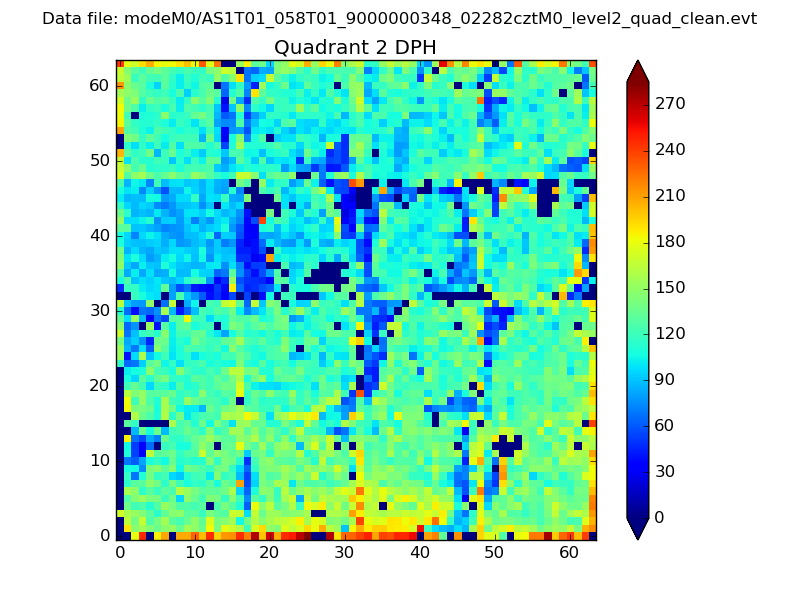
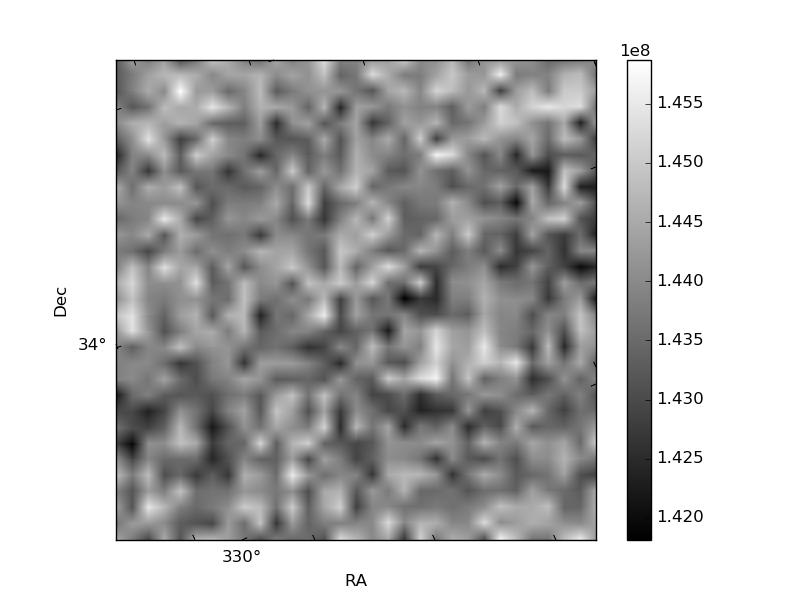
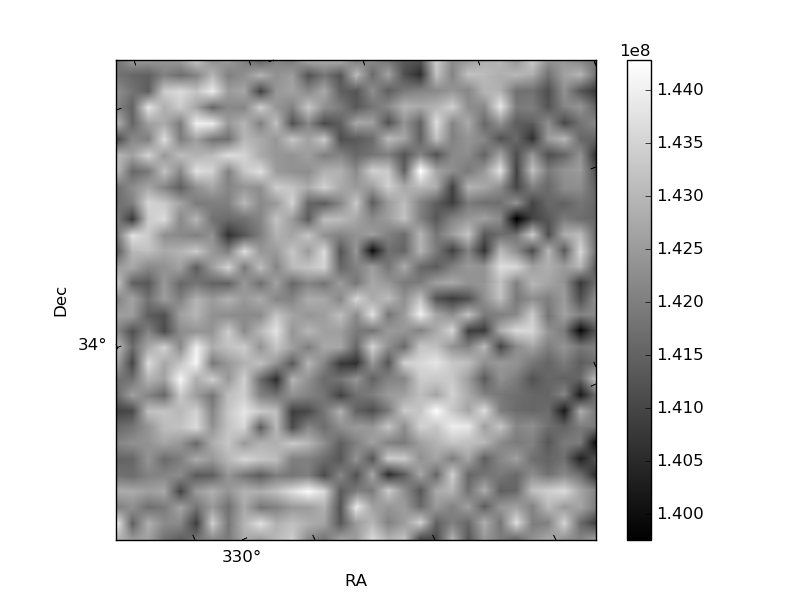
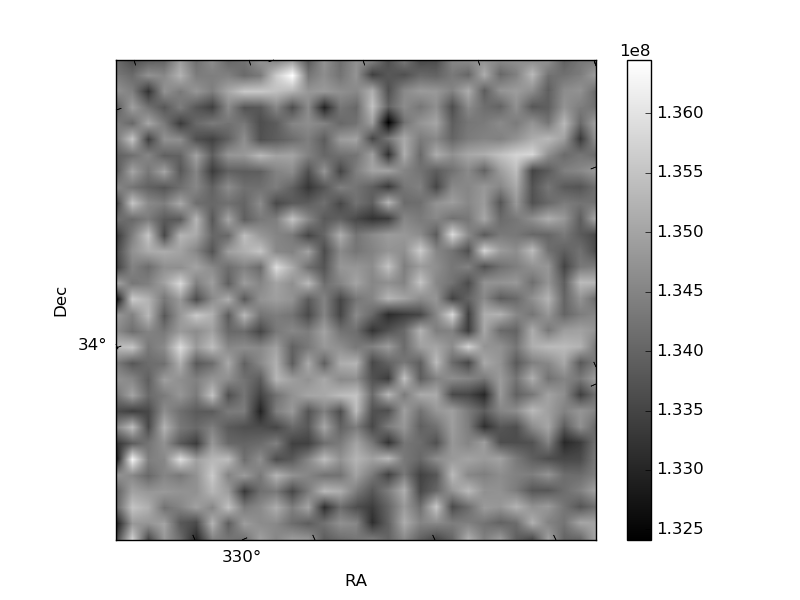
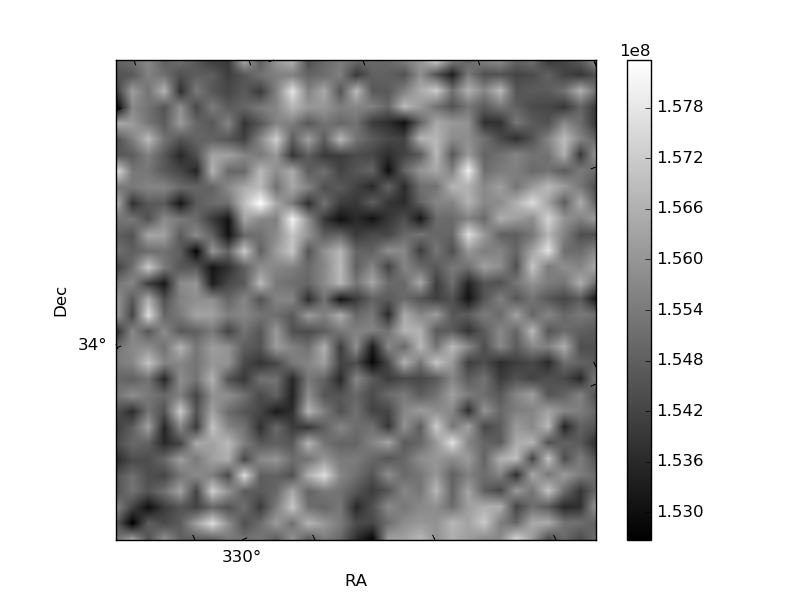
Histogram calculated using DETX and DETY for each event in the final _common_clean file
| Quadrant A | 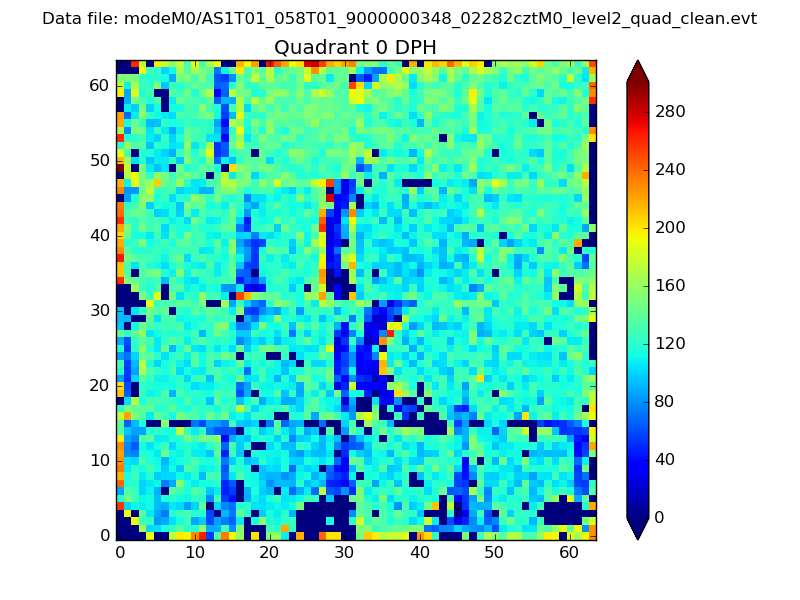 |
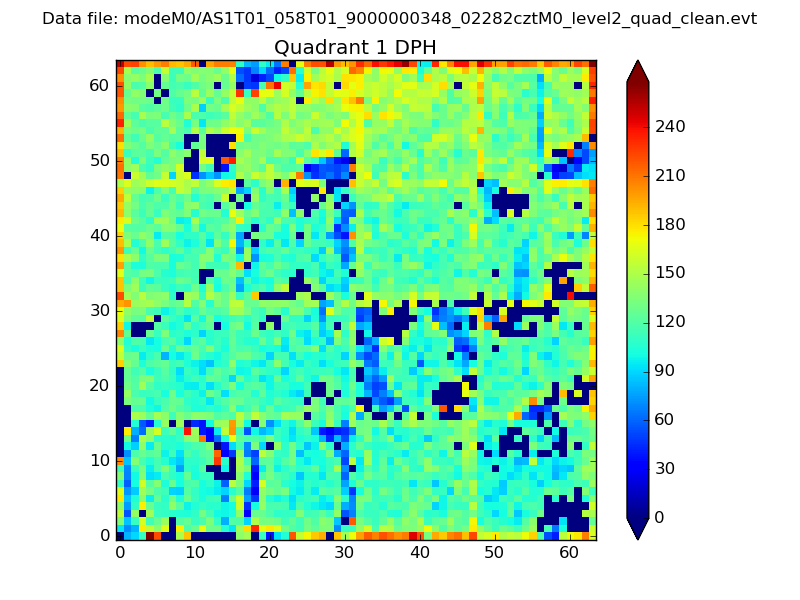 |
Quadrant B |
|---|---|---|---|
| Quadrant D | 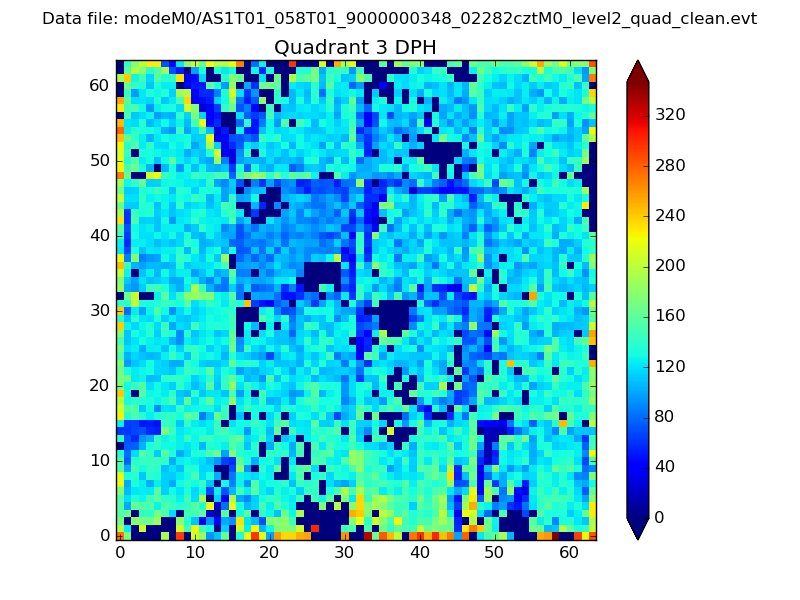 |
 |
Quadrant C |
| Plot type | Count rate plots | Images |
|---|---|---|
| Comparison with Poisson distribution Blue bars denote a histogram of data divided into 1 sec bins. Red curve is a Poisson curve with rate = median count rate of data. |
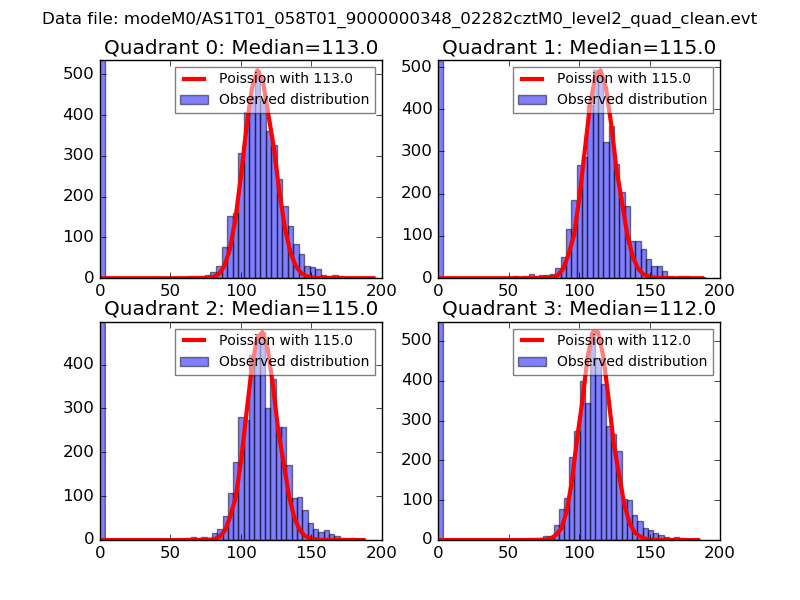 |
 |
| Quadrant-wise count rates Data is divided into 100 sec bins |
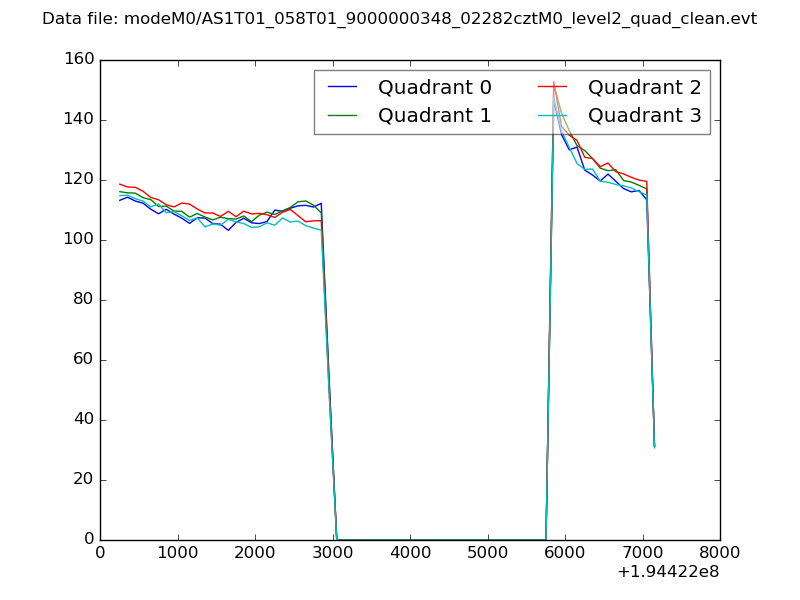 |
|
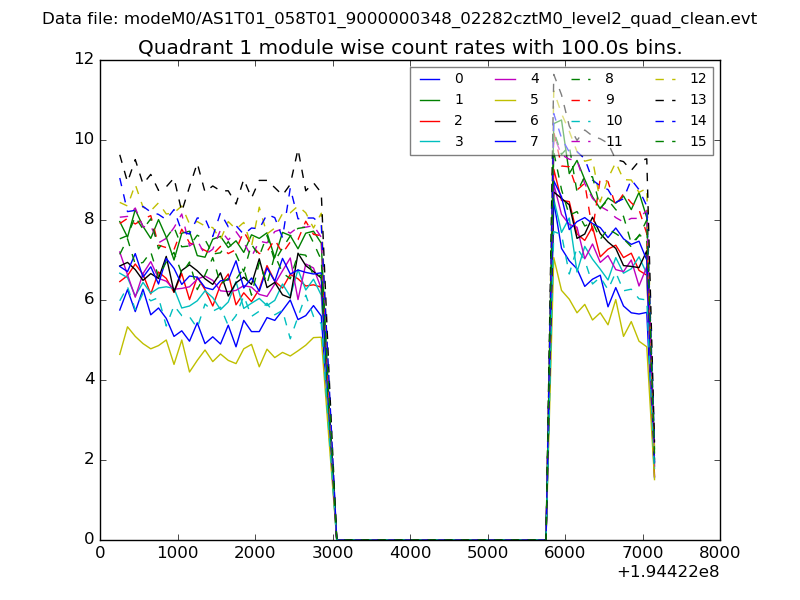
| Module-wise count rates for Quadrant A Data is divided into 100 sec bins |
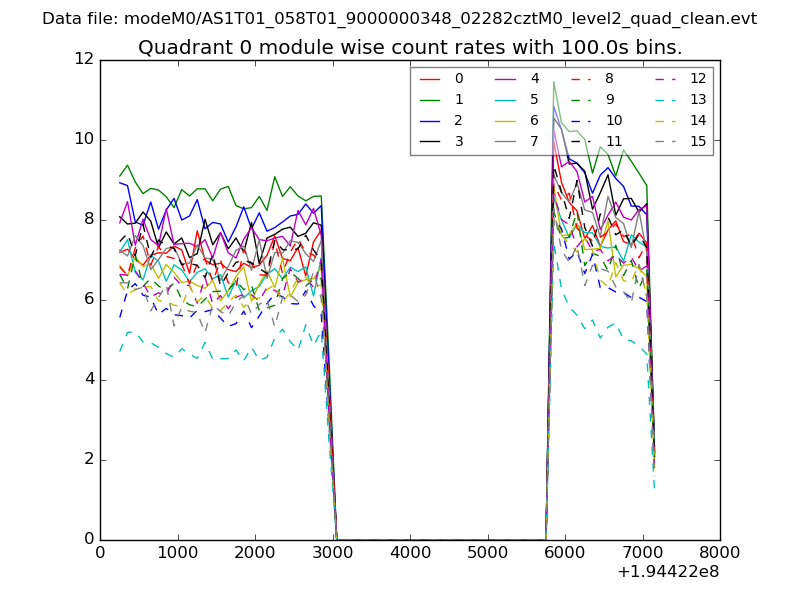 |
 |
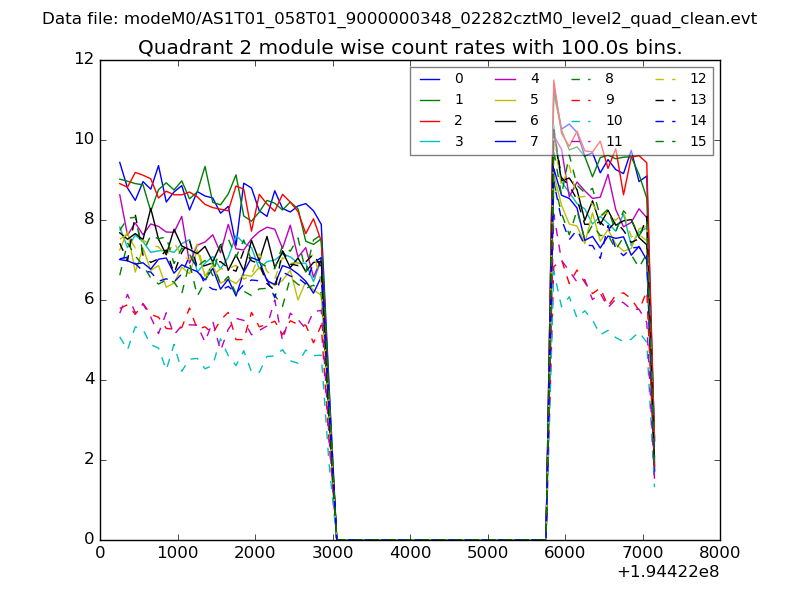
| Module-wise count rates for Quadrant B Data is divided into 100 sec bins |
 |
 |
| Module-wise count rates for Quadrant C Data is divided into 100 sec bins |
 |
 |
| Module-wise count rates for Quadrant D Data is divided into 100 sec bins |
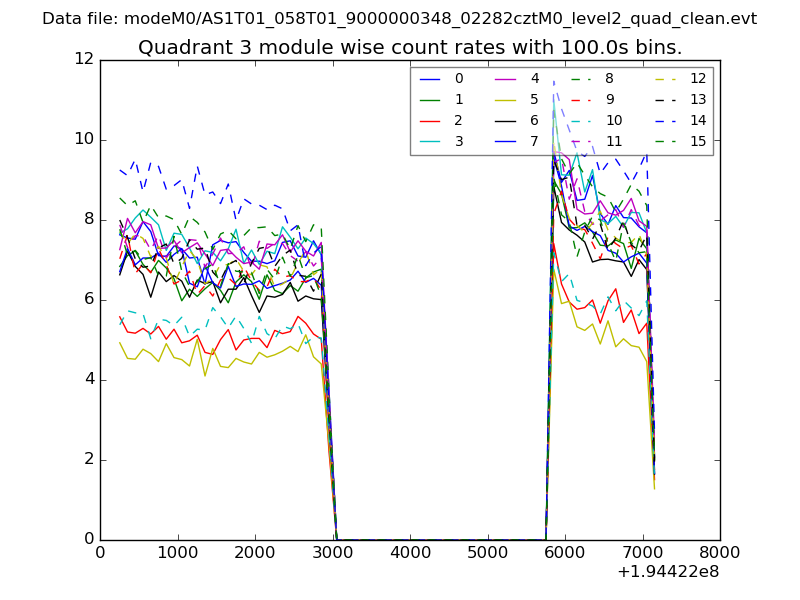 |
 |
| Parameter | Plot |
|---|---|
| CZT HV Monitor | 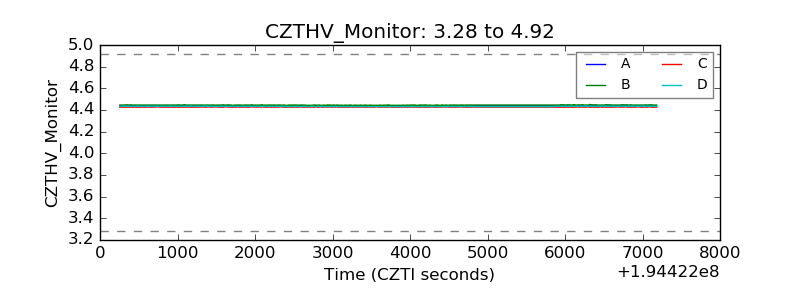 |
| D_VDD | 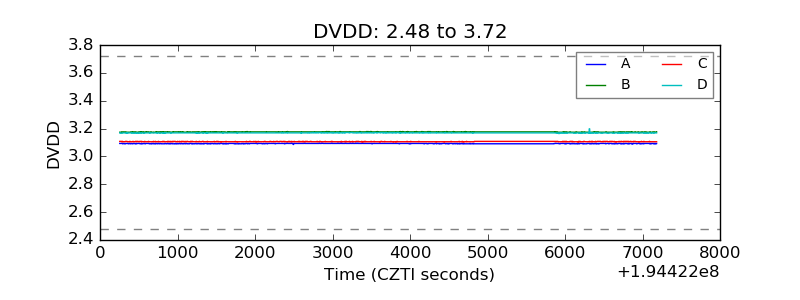 |
| Temperature 1 | 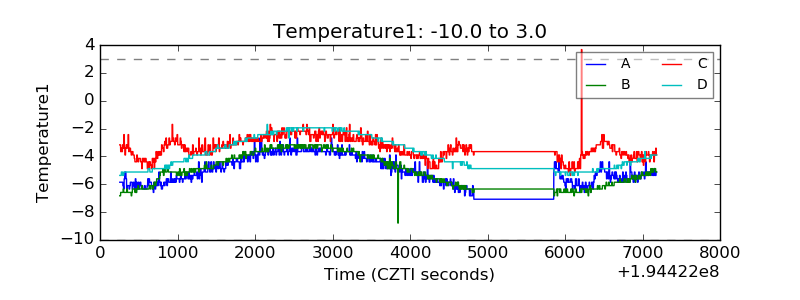 |
| Veto HV Monitor | 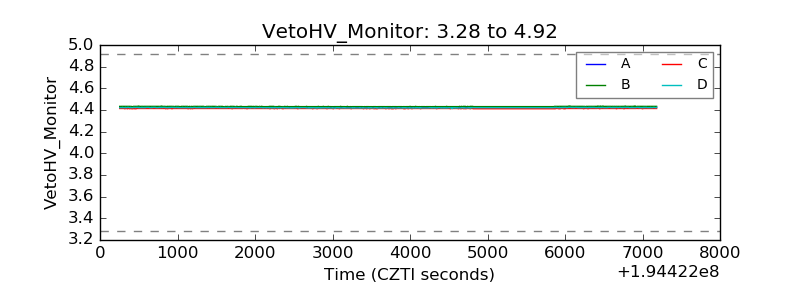 |
| Veto LLD | 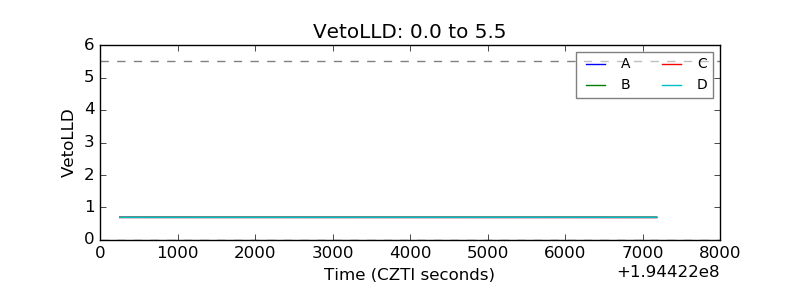 |
| Alpha Counter | 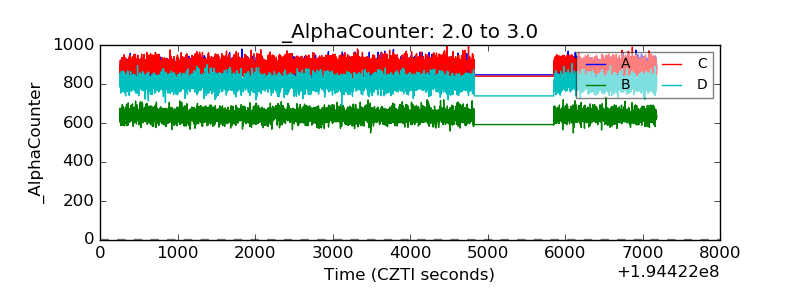 |
| _CPM_Rate | 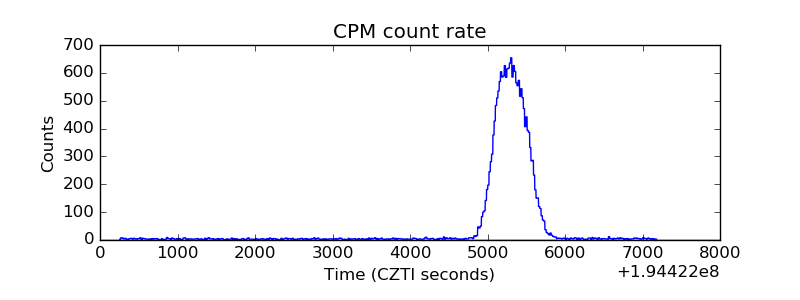 |
| CZT Counter | 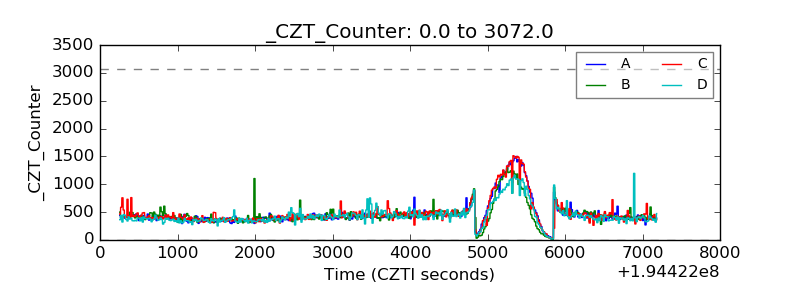 |
| +2.5 Volts monitor |  |
| +5 Volts monitor |  |
| _ROLL_ROT | 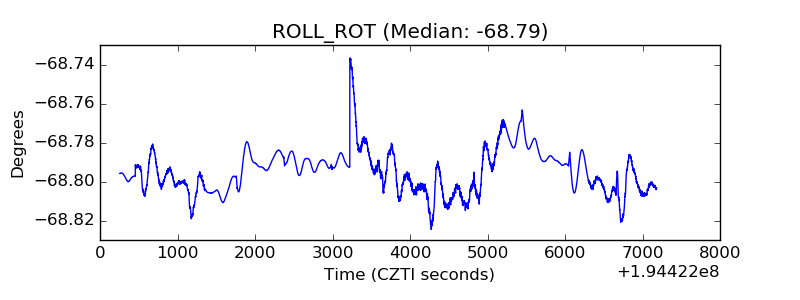 |
| _Roll_DEC | 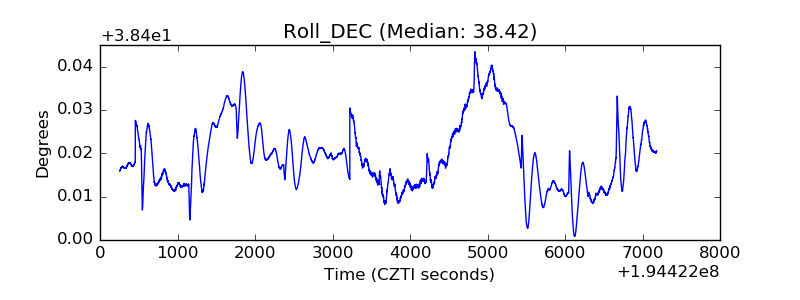 |
| _Roll_RA |  |
| Veto Counter | 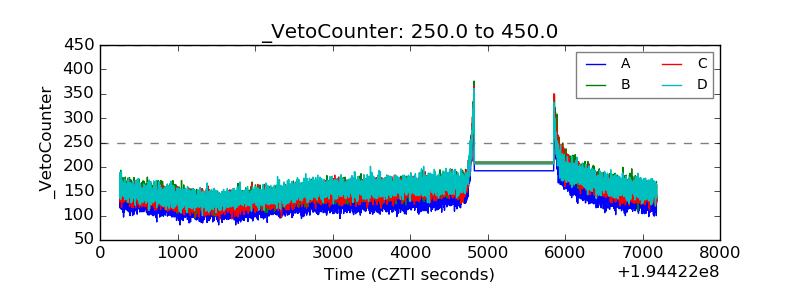 |