| Param | Original file | Final file |
|---|---|---|
| Filename | modeM0/AS1T01_058T01_9000000348_02284cztM0_level2.evt | modeM0/AS1T01_058T01_9000000348_02284cztM0_level2_quad_clean.evt |
| Size (bytes) | 244,630,080 | 33,704,640 |
| Size | 233.3 MB | 32.1 MB |
| Events in quadrant A | 1,594,876 | 192,277 |
| Events in quadrant B | 1,614,358 | 198,331 |
| Events in quadrant C | 1,673,561 | 197,631 |
| Events in quadrant D | 2,287,174 | 184,606 |
| Mode M9 | |||
|---|---|---|---|
| Quadrant | BADHDUFLAG | Total packets | Discarded packets |
| A | 0 | 11 | 0 |
| B | 0 | 11 | 0 |
| C | 0 | 11 | 0 |
| D | 0 | 11 | 0 |
| Mode SS | |||
|---|---|---|---|
| Quadrant | BADHDUFLAG | Total packets | Discarded packets |
| A | 0 | 72 | 0 |
| B | 0 | 72 | 0 |
| C | 0 | 72 | 0 |
| D | 0 | 72 | 0 |
| Mode M0 | |||
|---|---|---|---|
| Quadrant | BADHDUFLAG | Total packets | Discarded packets |
| A | 0 | 7141 | 2 |
| B | 0 | 7153 | 1 |
| C | 0 | 7303 | 1 |
| D | 0 | 9150 | 1 |
| Quadrant | Total seconds | Saturated seconds | Saturation percentage |
|---|---|---|---|
| A | 3487 | 27 | 0.774305% |
| B | 3487 | 31 | 0.889016% |
| C | 3487 | 20 | 0.573559% |
| D | 3487 | 104 | 2.982506% |
Noise dominated data is calculated using 1-second bins in cleaned event files. If a bin has >2000 counts, and if more than 50% of those come from <1% of pixels, then it is considered to be noise-dominated and hence unusable.
| Quadrant | # 1 sec bins | Bins with >0 counts | Bins with >2000 counts | High rate bins dominated by noise | Noise dominated (total time) | Noise dominated (detector-on time) | Marked lightcurve |
|---|---|---|---|---|---|---|---|
| A | 4607 | 3487 | 0 | 0 | 0.00% | 0.00% | 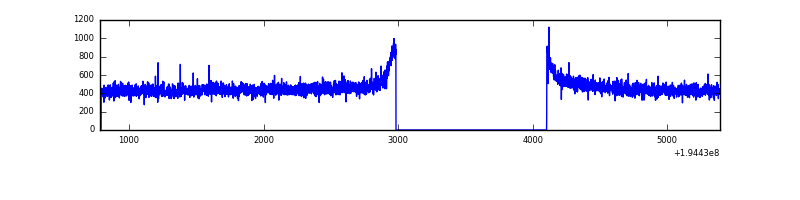 |
| B | 4608 | 3488 | 1 | 1 | 0.02% | 0.03% | 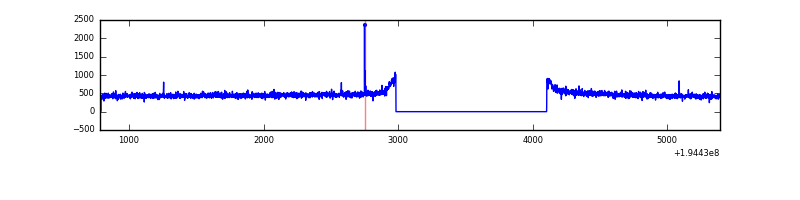 |
| C | 4608 | 3489 | 1 | 1 | 0.02% | 0.03% | 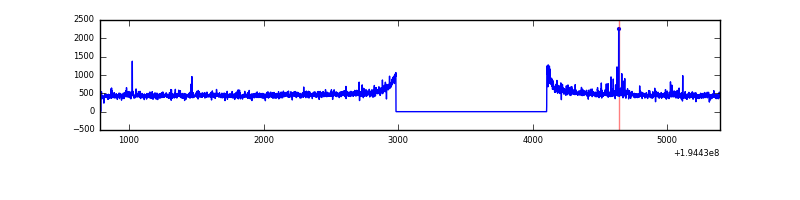 |
| D | 4608 | 3488 | 40 | 40 | 0.87% | 1.15% | 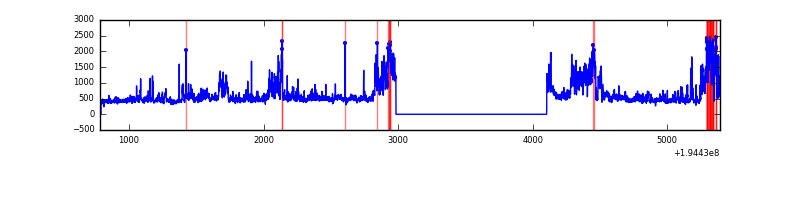 |
Top three noisy pixels from each quadrant. If the there are fewer than three noisy pixels in the level2.evt file, extra rows are filled as -1
| Pixel properties | Quadrant properties | ||||||
|---|---|---|---|---|---|---|---|
| Quadrant | DetID | PixID | Counts | Sigma | Mean | Median | Sigma |
| A | 13 | 9 | 5147 | 55.58 | 412 | 403 | 85.4 |
| A | 12 | 194 | 4754 | 50.98 | 412 | 403 | 85.4 |
| A | 0 | 226 | 4437 | 47.26 | 412 | 403 | 85.4 |
| B | 12 | 111 | 6026 | 69.58 | 417 | 408 | 80.7 |
| B | 11 | 111 | 5009 | 56.98 | 417 | 408 | 80.7 |
| B | 0 | 182 | 4429 | 49.8 | 417 | 408 | 80.7 |
| C | 5 | 234 | 75787 | 786.27 | 405 | 406 | 95.9 |
| C | 8 | 112 | 6306 | 61.54 | 405 | 406 | 95.9 |
| C | 13 | 61 | 3671 | 34.06 | 405 | 406 | 95.9 |
| D | 9 | 66 | 687880 | 7184.68 | 398 | 389 | 95.7 |
| D | 6 | 112 | 60207 | 625.13 | 398 | 389 | 95.7 |
| D | 13 | 169 | 17437 | 178.16 | 398 | 389 | 95.7 |
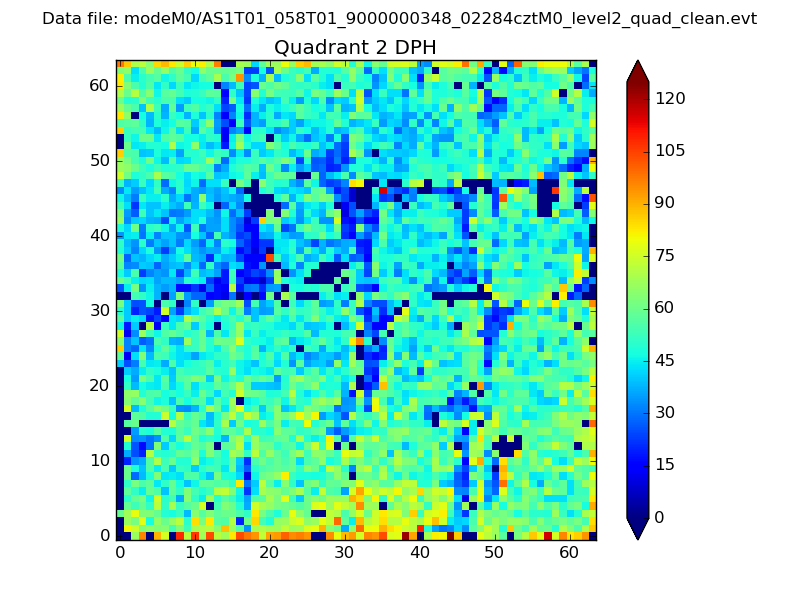
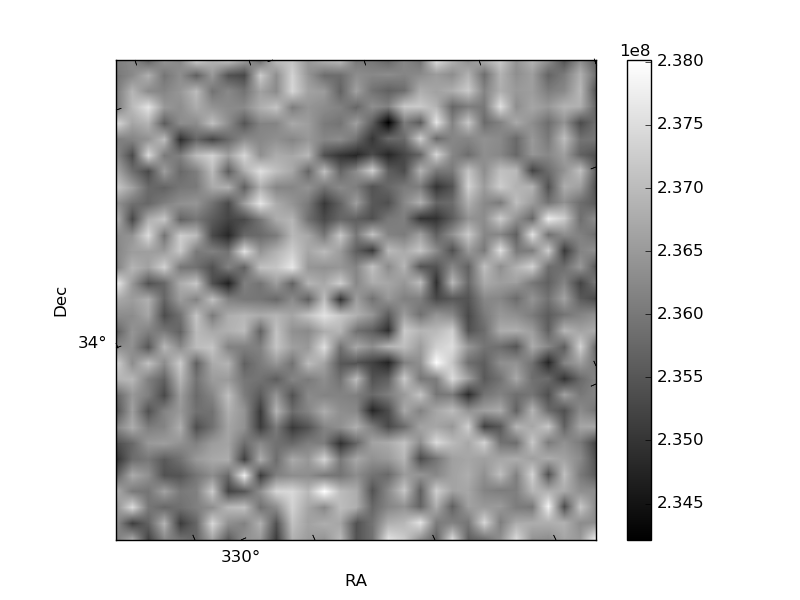
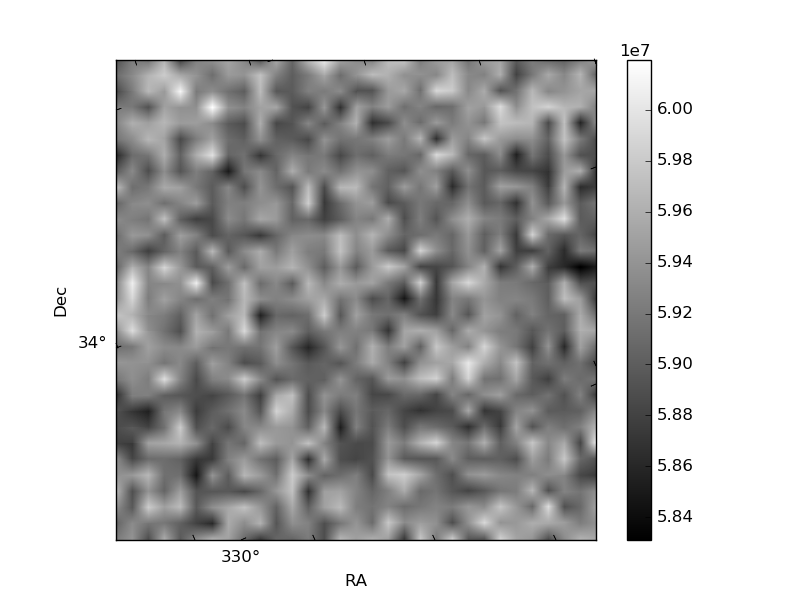
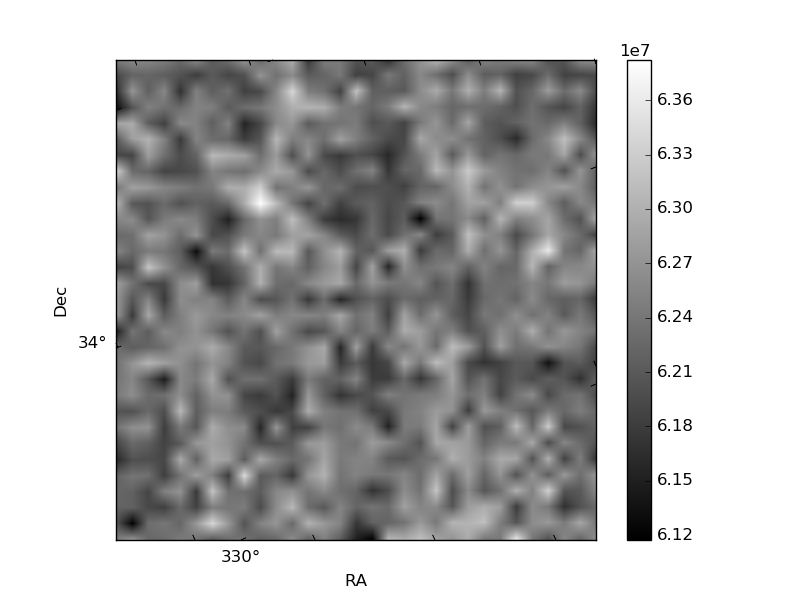
Histogram calculated using DETX and DETY for each event in the final _common_clean file
| Quadrant A | 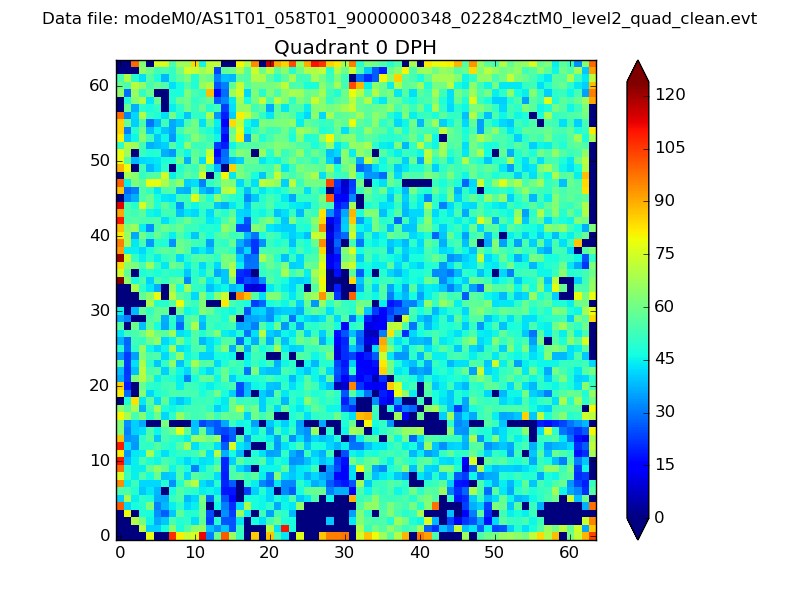 |
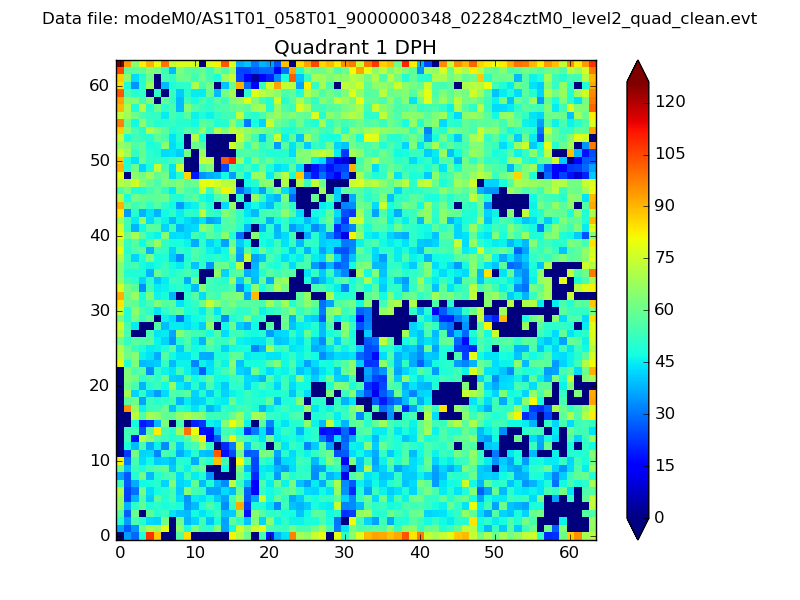 |
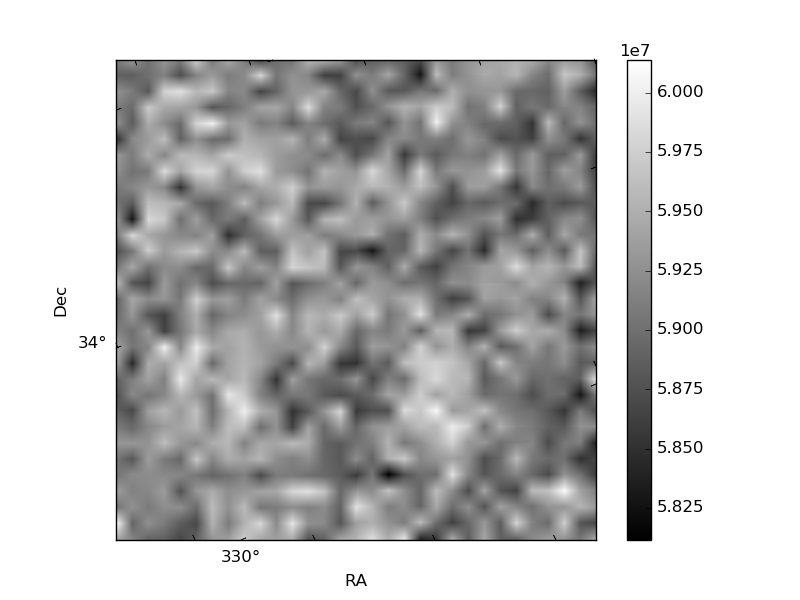
Quadrant B |
|---|---|---|---|
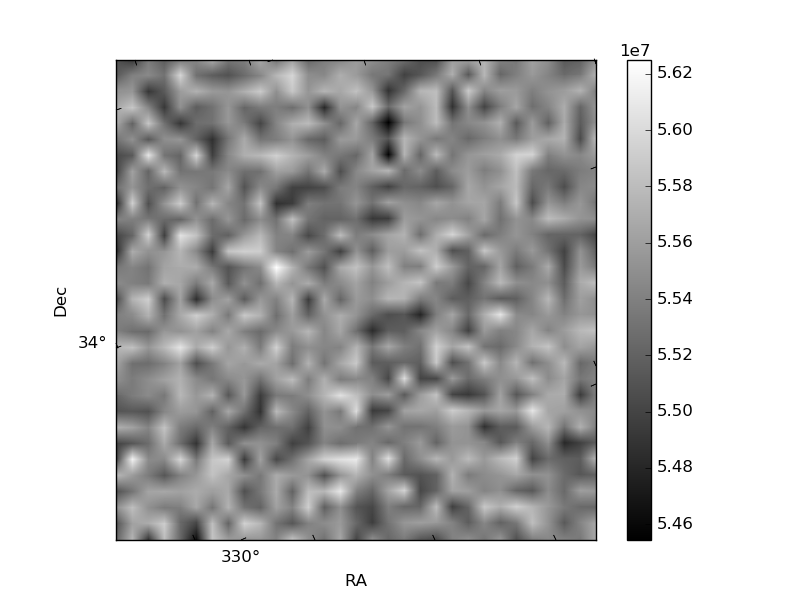
| Quadrant D | 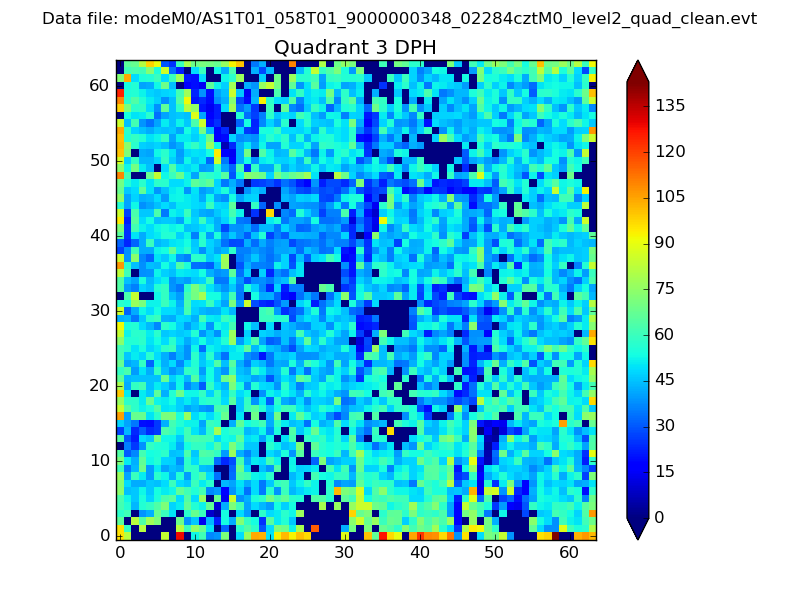 |
 |
Quadrant C |
| Plot type | Count rate plots | Images |
|---|---|---|
| Comparison with Poisson distribution Blue bars denote a histogram of data divided into 1 sec bins. Red curve is a Poisson curve with rate = median count rate of data. |
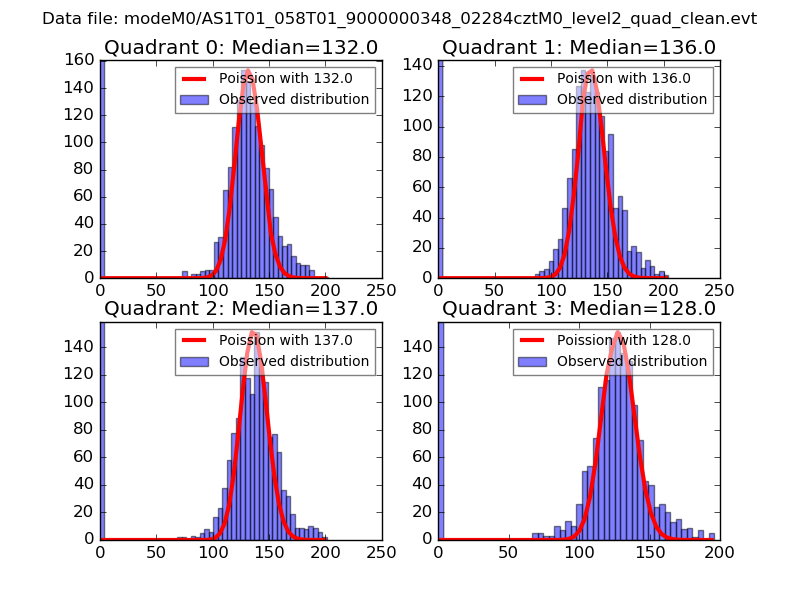 |
 |
| Quadrant-wise count rates Data is divided into 100 sec bins |
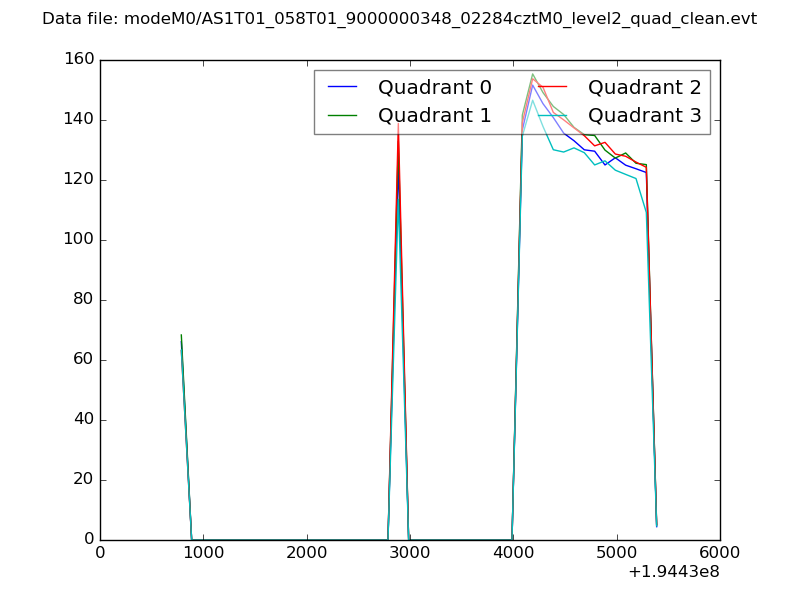 |
|
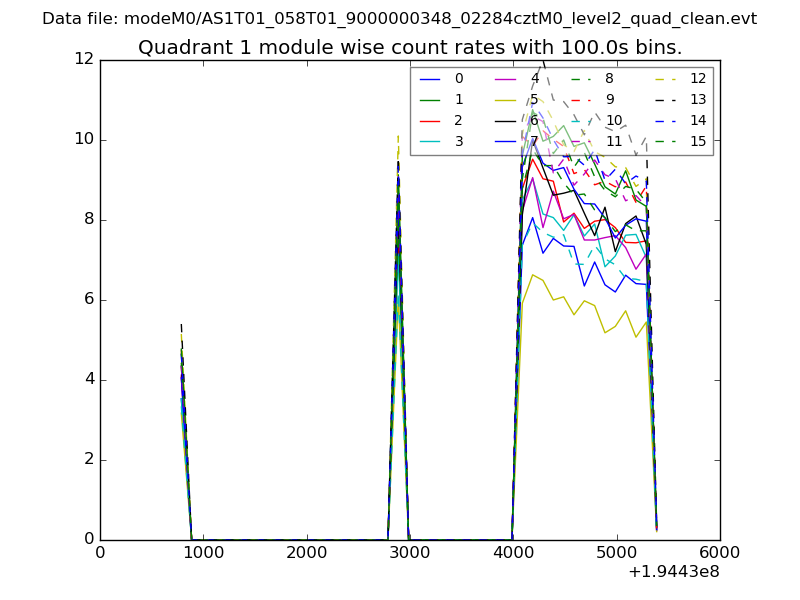
| Module-wise count rates for Quadrant A Data is divided into 100 sec bins |
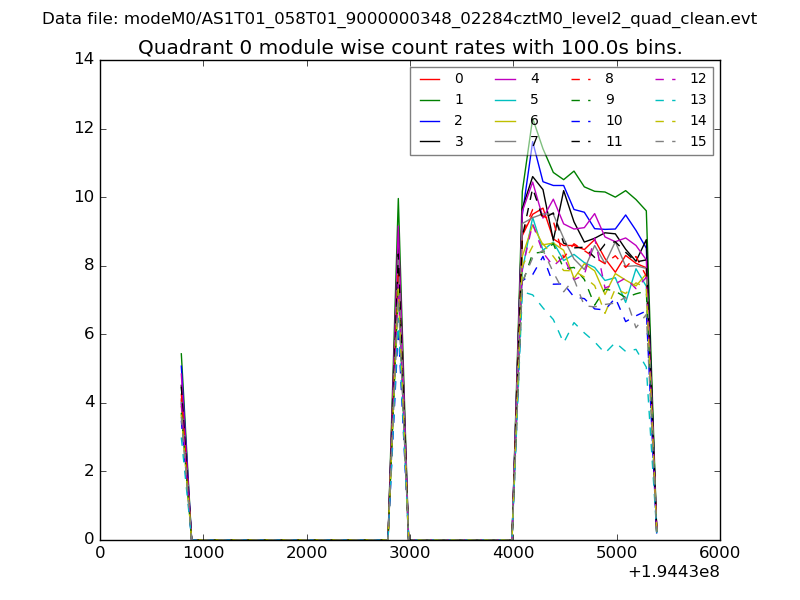 |
 |
| Module-wise count rates for Quadrant B Data is divided into 100 sec bins |
 |
 |
| Module-wise count rates for Quadrant C Data is divided into 100 sec bins |
 |
 |
| Module-wise count rates for Quadrant D Data is divided into 100 sec bins |
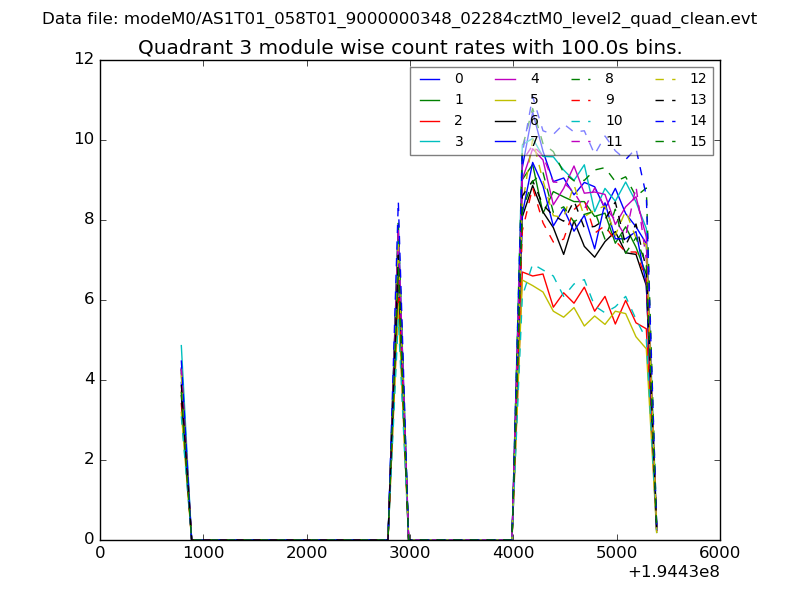 |
 |
| Parameter | Plot |
|---|---|
| CZT HV Monitor |  |
| D_VDD | 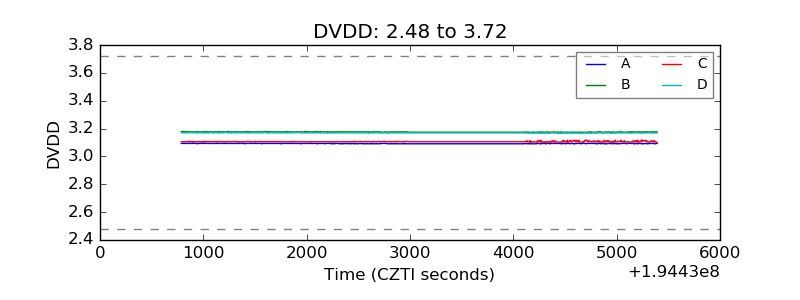 |
| Temperature 1 | 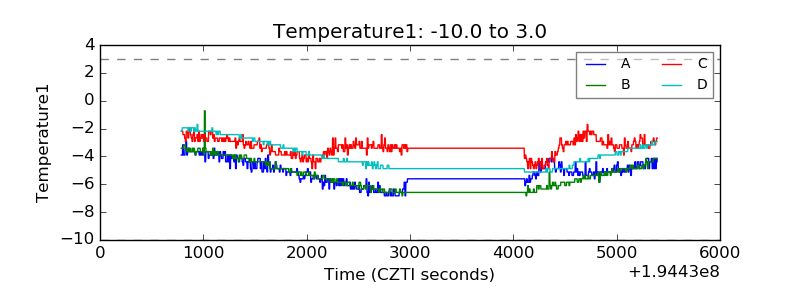 |
| Veto HV Monitor | 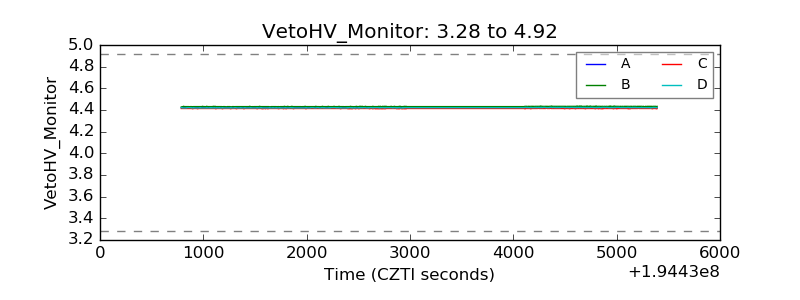 |
| Veto LLD | 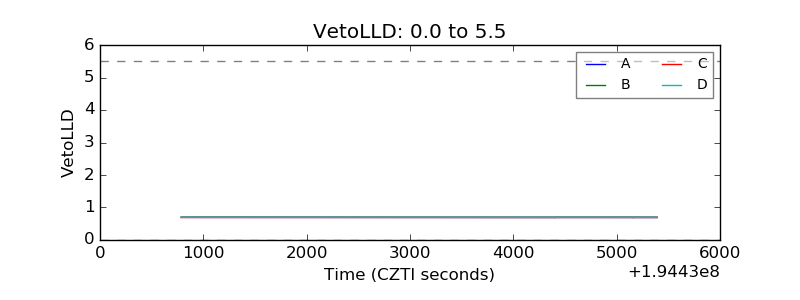 |
| Alpha Counter | 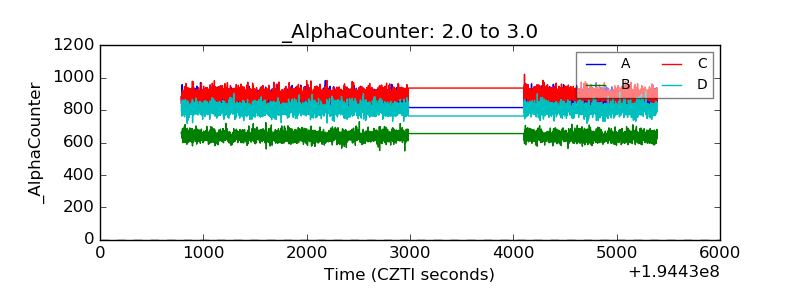 |
| _CPM_Rate | 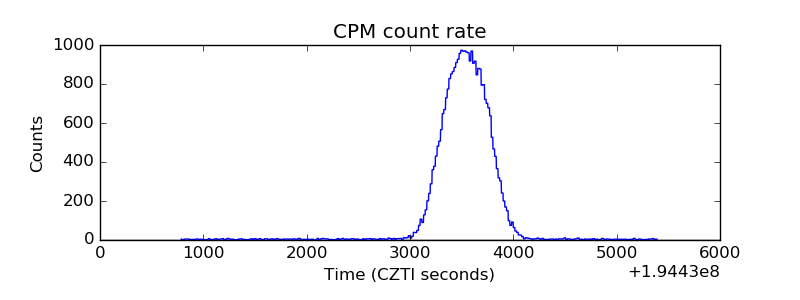 |
| CZT Counter | 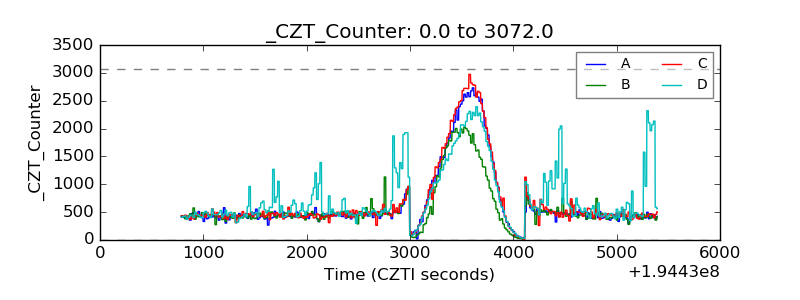 |
| +2.5 Volts monitor |  |
| +5 Volts monitor |  |
| _ROLL_ROT | 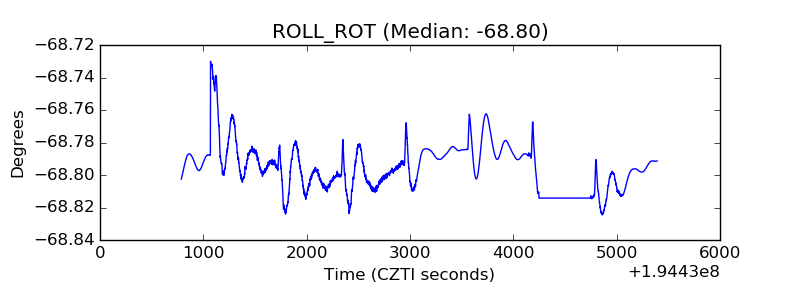 |
| _Roll_DEC | 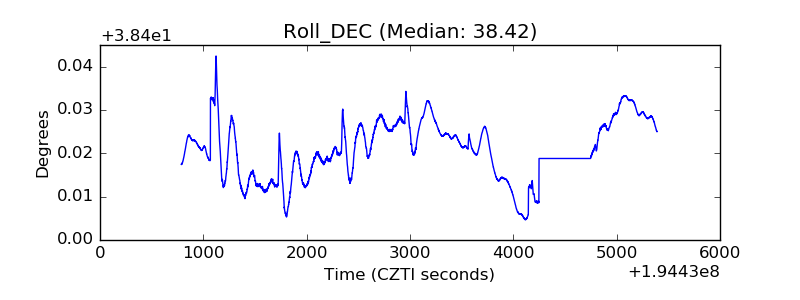 |
| _Roll_RA | 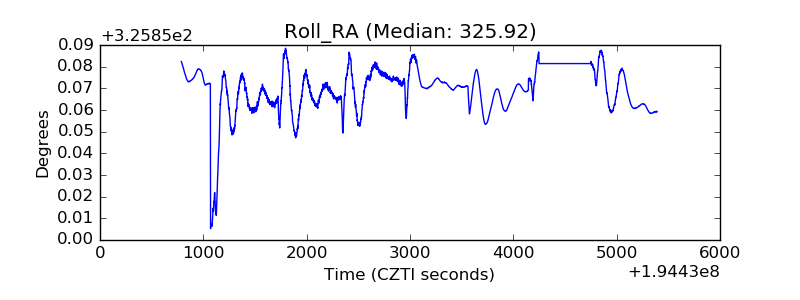 |
| Veto Counter | 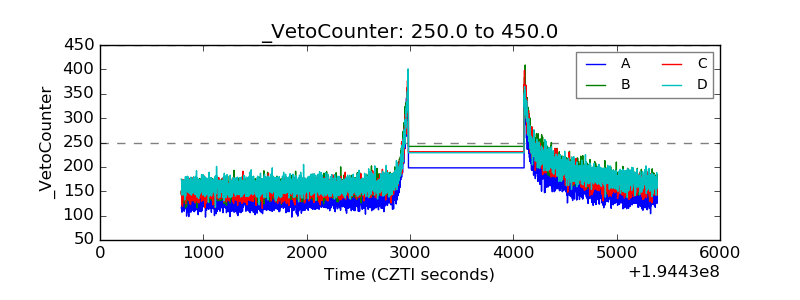 |