| Param | Original file | Final file |
|---|---|---|
| Filename | modeM0/AS1T01_058T01_9000000348_02286cztM0_level2.evt | modeM0/AS1T01_058T01_9000000348_02286cztM0_level2_quad_clean.evt |
| Size (bytes) | 10,342,080 | 1,981,440 |
| Size | 9.9 MB | 1.9 MB |
| Events in quadrant A | 97,144 | 11,304 |
| Events in quadrant B | 90,626 | 10,655 |
| Events in quadrant C | 86,072 | 10,129 |
| Events in quadrant D | 20,491 | 3,583 |
| Mode M9 | |||
|---|---|---|---|
| Quadrant | BADHDUFLAG | Total packets | Discarded packets |
| A | 1 | 273359709408 | 0 |
| B | 1 | -1 | -1 |
| C | 1 | -1 | -1 |
| D | 1 | -1 | -1 |
| Mode SS | |||
|---|---|---|---|
| Quadrant | BADHDUFLAG | Total packets | Discarded packets |
| A | 0 | 273359709408 | 0 |
| B | 0 | -1 | -1 |
| C | 0 | -1 | -1 |
| D | 0 | -1 | -1 |
| Mode M0 | |||
|---|---|---|---|
| Quadrant | BADHDUFLAG | Total packets | Discarded packets |
| A | 0 | 6359 | 5927 |
| B | 0 | 6616 | 6221 |
| C | 0 | 6441 | 6063 |
| D | 0 | 7183 | 7099 |
| Quadrant | Total seconds | Saturated seconds | Saturation percentage |
|---|---|---|---|
| A | 216 | 0 | 0.000000% |
| B | 198 | 2 | 1.010101% |
| C | 189 | 0 | 0.000000% |
| D | 43 | 1 | 2.325581% |
Noise dominated data is calculated using 1-second bins in cleaned event files. If a bin has >2000 counts, and if more than 50% of those come from <1% of pixels, then it is considered to be noise-dominated and hence unusable.
| Quadrant | # 1 sec bins | Bins with >0 counts | Bins with >2000 counts | High rate bins dominated by noise | Noise dominated (total time) | Noise dominated (detector-on time) | Marked lightcurve |
|---|---|---|---|---|---|---|---|
| A | 7343 | 389 | 0 | 0 | 0.00% | 0.00% | 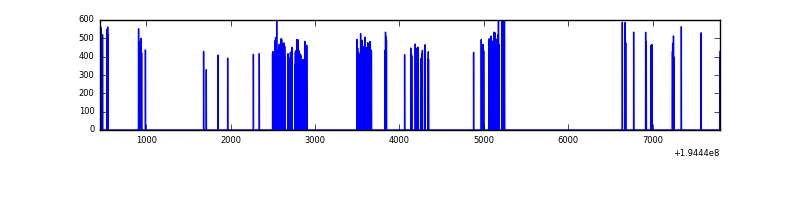 |
| B | 7096 | 367 | 0 | 0 | 0.00% | 0.00% | 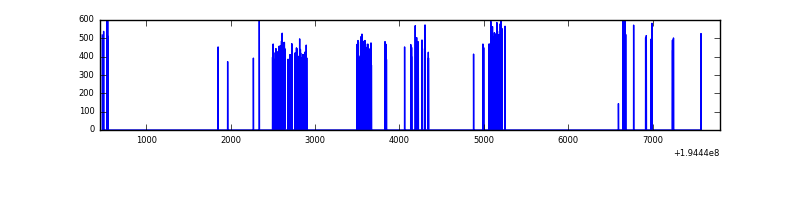 |
| C | 7341 | 348 | 0 | 0 | 0.00% | 0.00% | 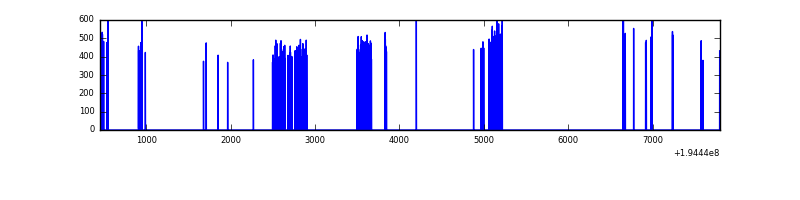 |
| D | 7340 | 77 | 0 | 0 | 0.00% | 0.00% | 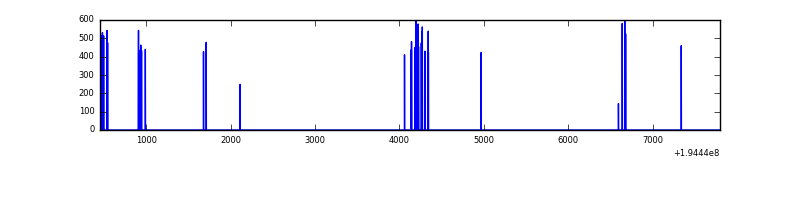 |
Top three noisy pixels from each quadrant. If the there are fewer than three noisy pixels in the level2.evt file, extra rows are filled as -1
| Pixel properties | Quadrant properties | ||||||
|---|---|---|---|---|---|---|---|
| Quadrant | DetID | PixID | Counts | Sigma | Mean | Median | Sigma |
| A | 0 | 226 | 265 | 33.3 | 25 | 24 | 7.2 |
| A | 12 | 194 | 252 | 31.5 | 25 | 24 | 7.2 |
| A | 3 | 1 | 97 | 10.09 | 25 | 24 | 7.2 |
| B | 12 | 111 | 328 | 47.67 | 23 | 23 | 6.4 |
| B | 4 | 200 | 328 | 47.67 | 23 | 23 | 6.4 |
| B | 11 | 111 | 301 | 43.45 | 23 | 23 | 6.4 |
| C | 5 | 234 | 1101 | 154.76 | 21 | 21 | 7.0 |
| C | 13 | 61 | 186 | 23.64 | 21 | 21 | 7.0 |
| C | 2 | 53 | 115 | 13.47 | 21 | 21 | 7.0 |
| D | 9 | 66 | 1372 | 582.42 | 4 | 4 | 2.3 |
| D | 13 | 169 | 113 | 46.41 | 4 | 4 | 2.3 |
| D | 3 | 238 | 86 | 34.91 | 4 | 4 | 2.3 |
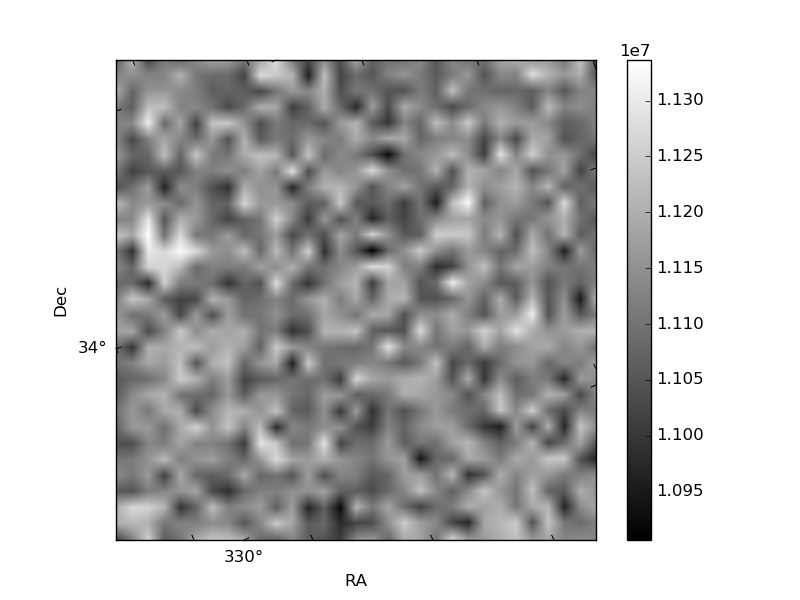
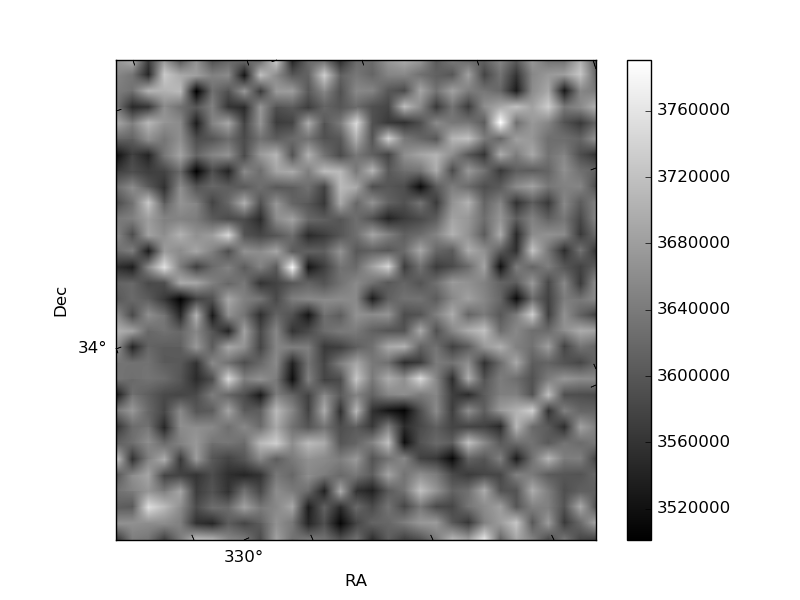
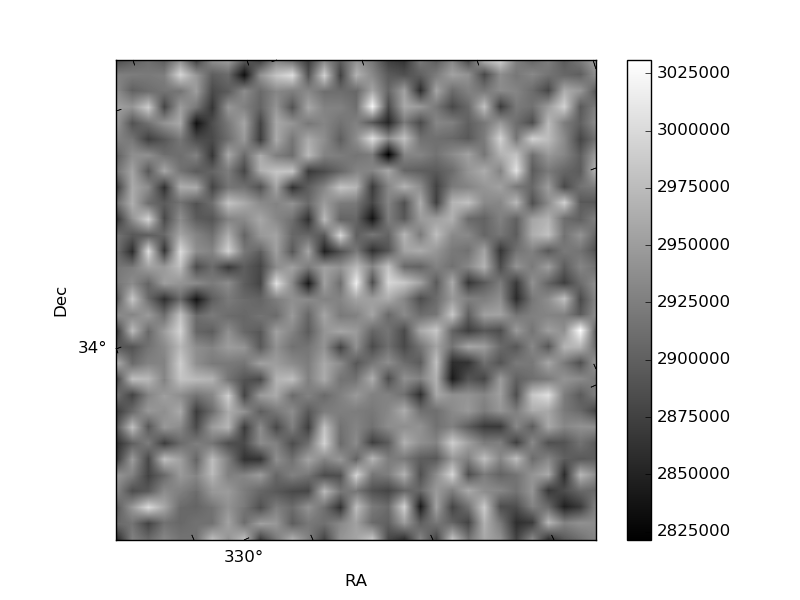
Histogram calculated using DETX and DETY for each event in the final _common_clean file
| Quadrant A | 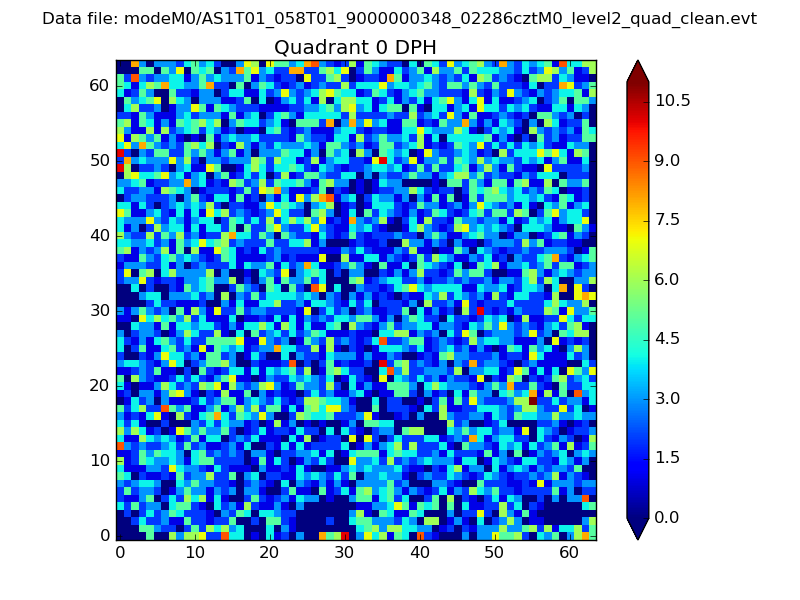 |
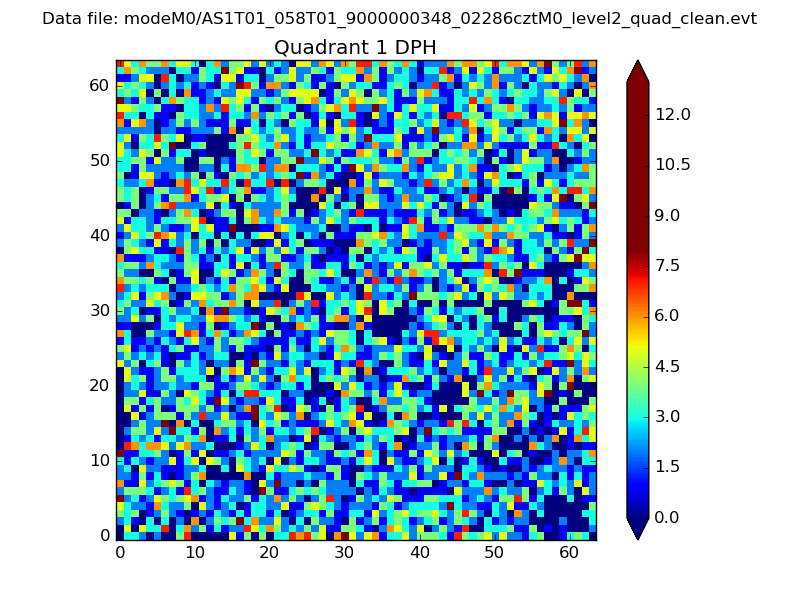 |
Quadrant B |
|---|---|---|---|
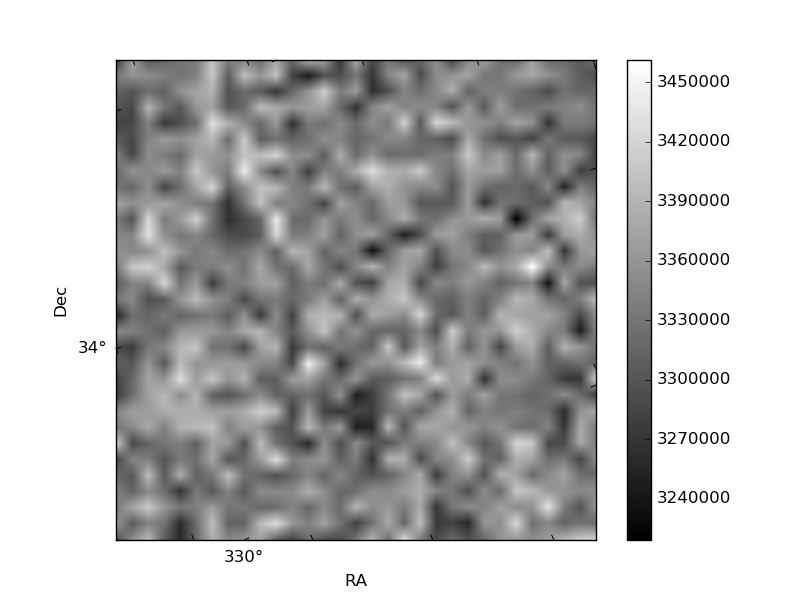
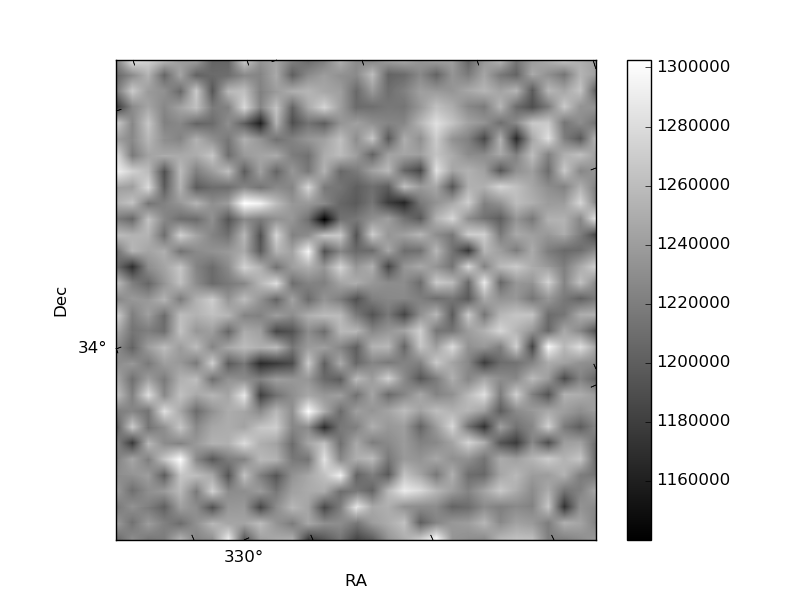
| Quadrant D | 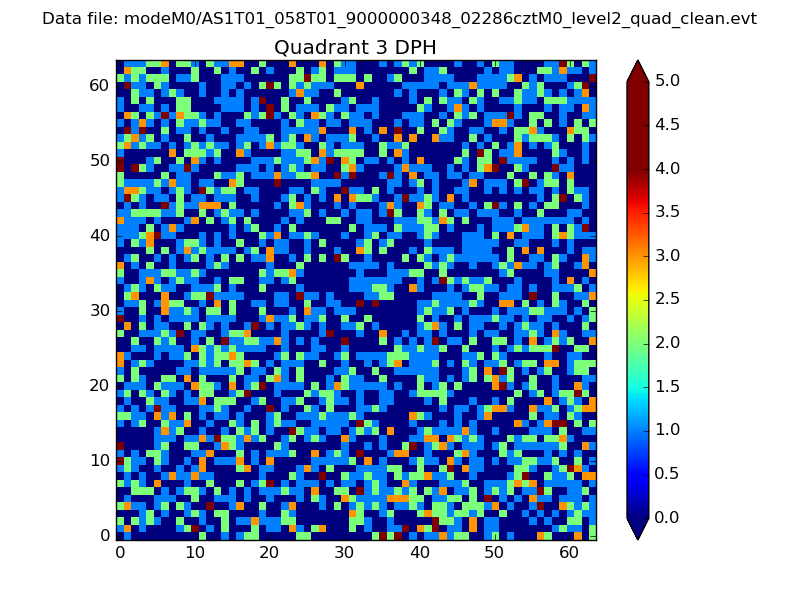 |
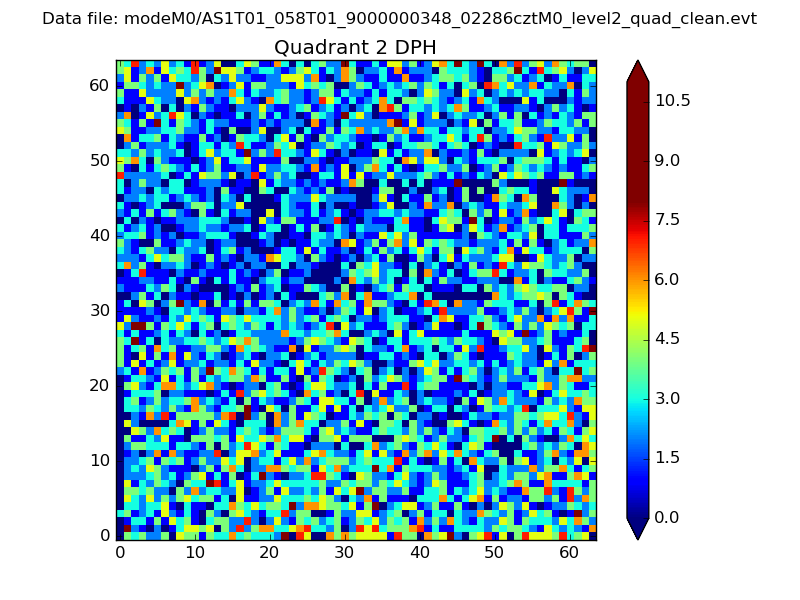 |
Quadrant C |
| Plot type | Count rate plots | Images |
|---|---|---|
| Comparison with Poisson distribution Blue bars denote a histogram of data divided into 1 sec bins. Red curve is a Poisson curve with rate = median count rate of data. |
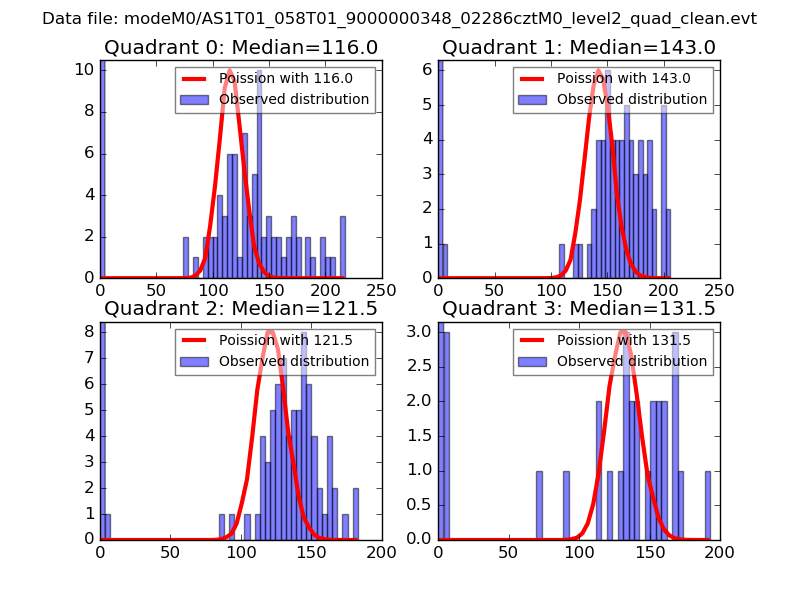 |
 |
| Quadrant-wise count rates Data is divided into 100 sec bins |
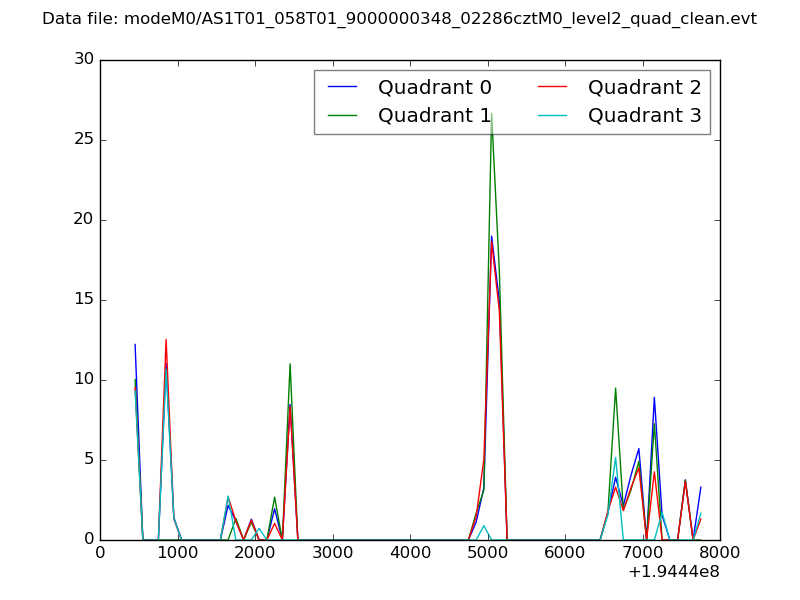 |
|
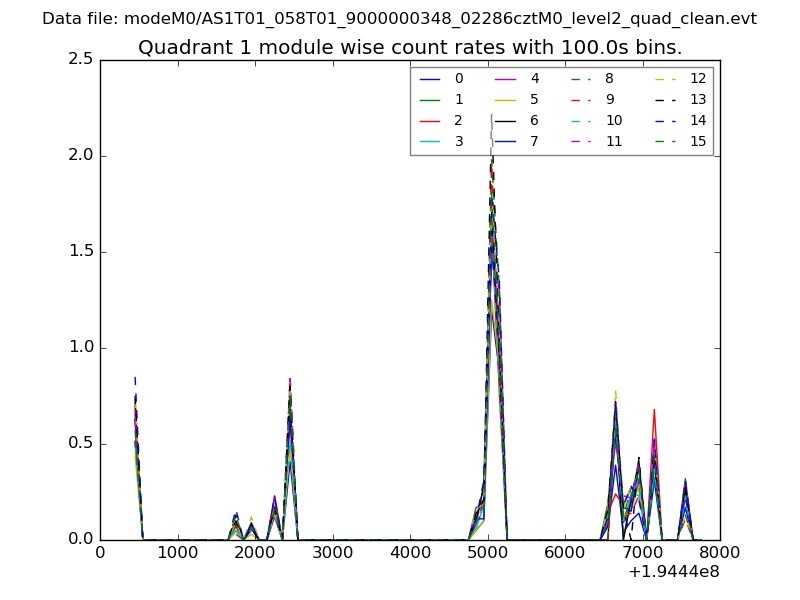
| Module-wise count rates for Quadrant A Data is divided into 100 sec bins |
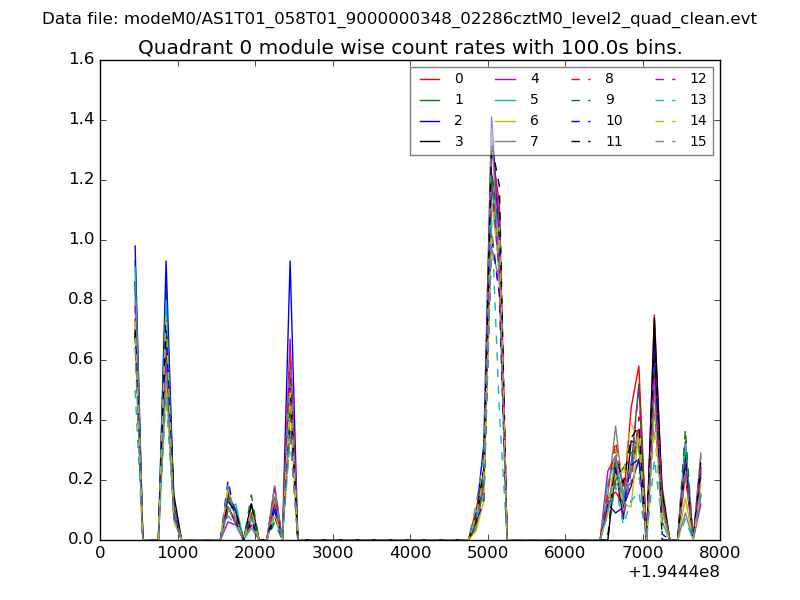 |
 |
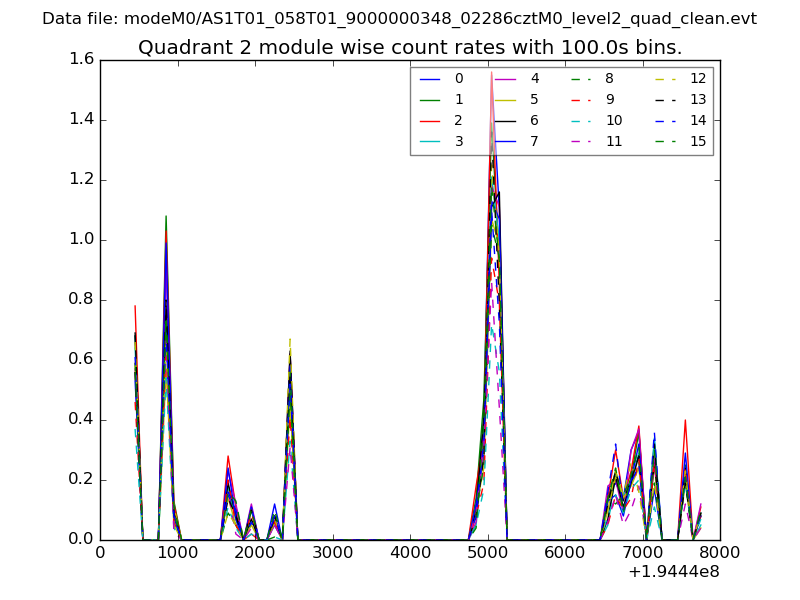
| Module-wise count rates for Quadrant B Data is divided into 100 sec bins |
 |
 |
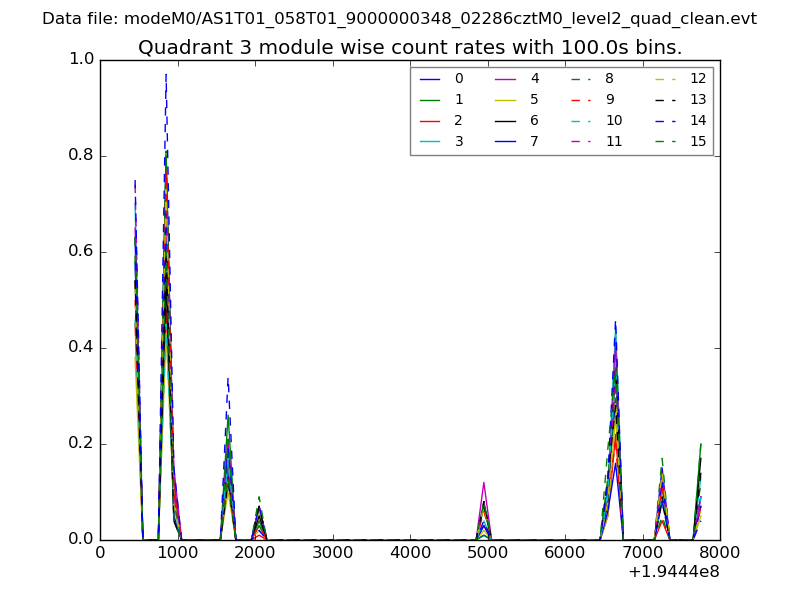
| Module-wise count rates for Quadrant C Data is divided into 100 sec bins |
 |
 |
| Module-wise count rates for Quadrant D Data is divided into 100 sec bins |
 |
 |
| Parameter | Plot |
|---|---|
| CZT HV Monitor | 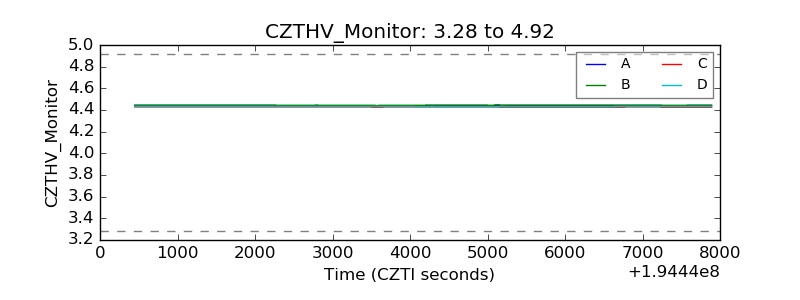 |
| D_VDD | 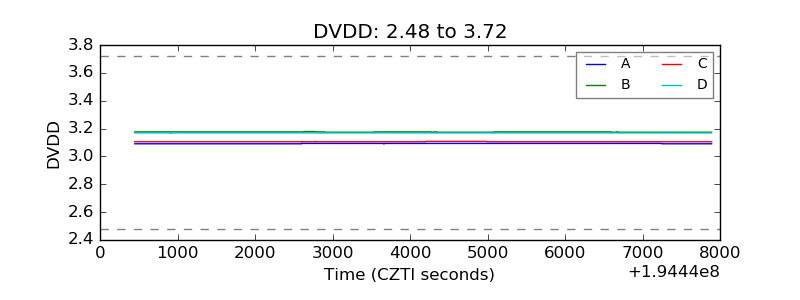 |
| Temperature 1 | 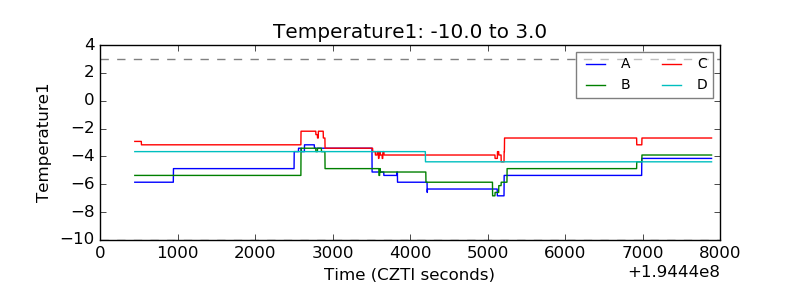 |
| Veto HV Monitor | 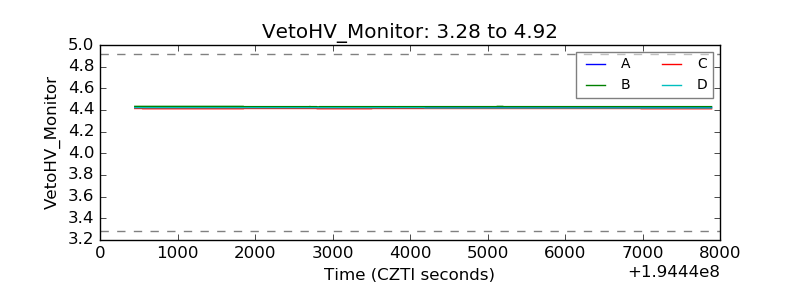 |
| Veto LLD | 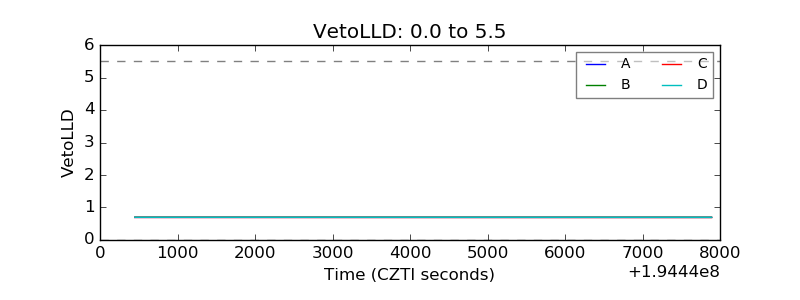 |
| Alpha Counter | 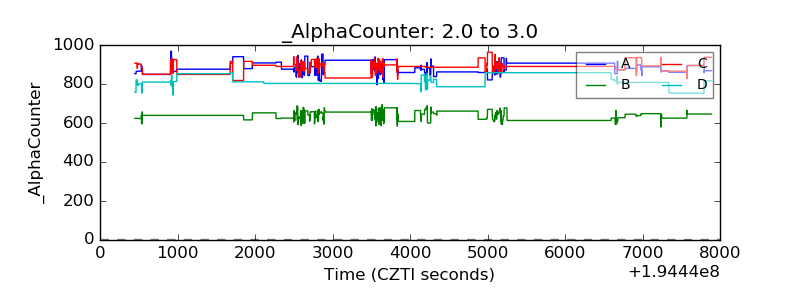 |
| _CPM_Rate |  |
| CZT Counter | 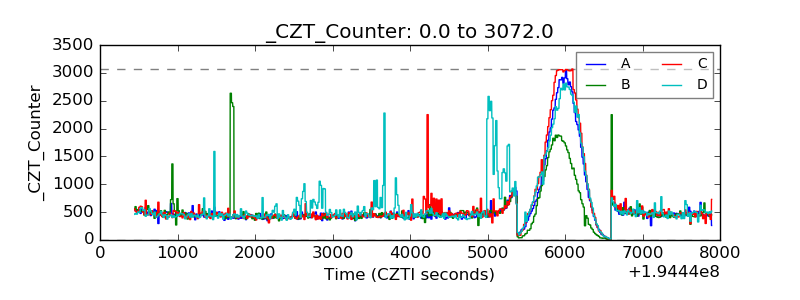 |
| +2.5 Volts monitor |  |
| +5 Volts monitor |  |
| _ROLL_ROT | 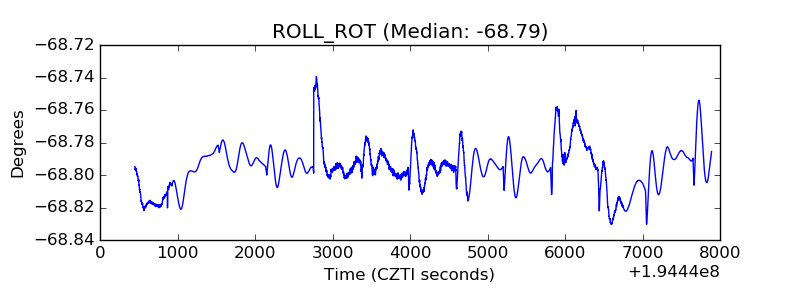 |
| _Roll_DEC |  |
| _Roll_RA | 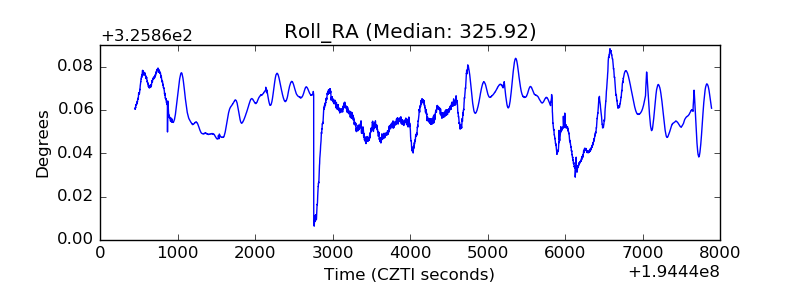 |
| Veto Counter | 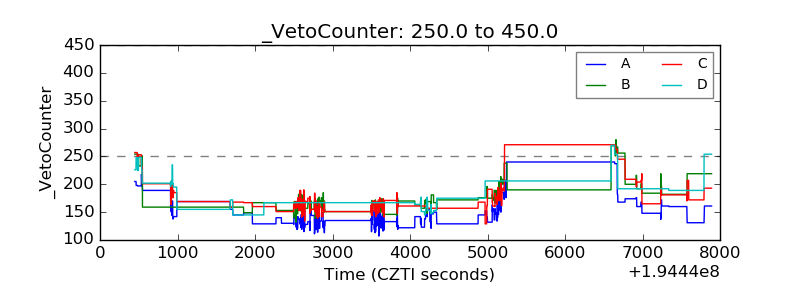 |