| Param | Original file | Final file |
|---|---|---|
| Filename | modeM0/AS1T01_058T01_9000000348_02287cztM0_level2.evt | modeM0/AS1T01_058T01_9000000348_02287cztM0_level2_quad_clean.evt |
| Size (bytes) | 10,929,600 | 2,808,000 |
| Size | 10.4 MB | 2.7 MB |
| Events in quadrant A | 104,065 | 21,316 |
| Events in quadrant B | 101,409 | 20,631 |
| Events in quadrant C | 41,809 | 4,286 |
| Events in quadrant D | 67,529 | 17,163 |
| Mode M9 | |||
|---|---|---|---|
| Quadrant | BADHDUFLAG | Total packets | Discarded packets |
| A | 1 | 273359709408 | 0 |
| B | 1 | -1 | -1 |
| C | 1 | -1 | -1 |
| D | 1 | -1 | -1 |
| Mode SS | |||
|---|---|---|---|
| Quadrant | BADHDUFLAG | Total packets | Discarded packets |
| A | 0 | 273359709408 | 0 |
| B | 0 | -1 | -1 |
| C | 0 | -1 | -1 |
| D | 0 | -1 | -1 |
| Mode M0 | |||
|---|---|---|---|
| Quadrant | BADHDUFLAG | Total packets | Discarded packets |
| A | 0 | 6124 | 5658 |
| B | 0 | 6330 | 5899 |
| C | 0 | 6530 | 6354 |
| D | 0 | 6548 | 6257 |
| Quadrant | Total seconds | Saturated seconds | Saturation percentage |
|---|---|---|---|
| A | 233 | 0 | 0.000000% |
| B | 216 | 1 | 0.462963% |
| C | 88 | 0 | 0.000000% |
| D | 146 | 1 | 0.684932% |
Noise dominated data is calculated using 1-second bins in cleaned event files. If a bin has >2000 counts, and if more than 50% of those come from <1% of pixels, then it is considered to be noise-dominated and hence unusable.
| Quadrant | # 1 sec bins | Bins with >0 counts | Bins with >2000 counts | High rate bins dominated by noise | Noise dominated (total time) | Noise dominated (detector-on time) | Marked lightcurve |
|---|---|---|---|---|---|---|---|
| A | 7238 | 424 | 0 | 0 | 0.00% | 0.00% | 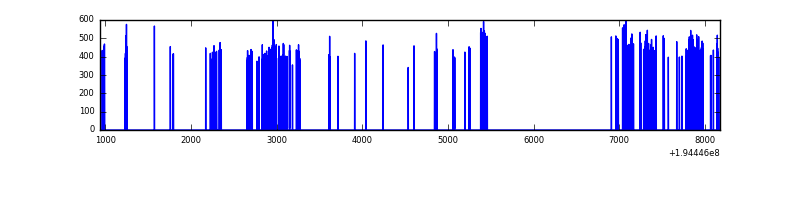 |
| B | 7238 | 404 | 0 | 0 | 0.00% | 0.00% | 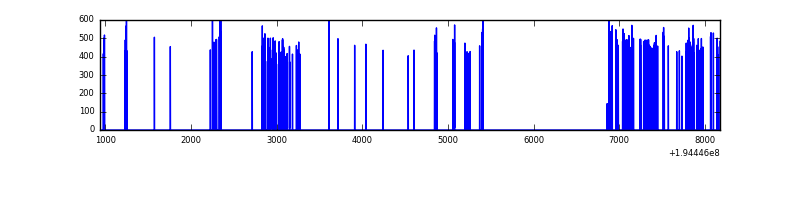 |
| C | 7216 | 153 | 0 | 0 | 0.00% | 0.00% | 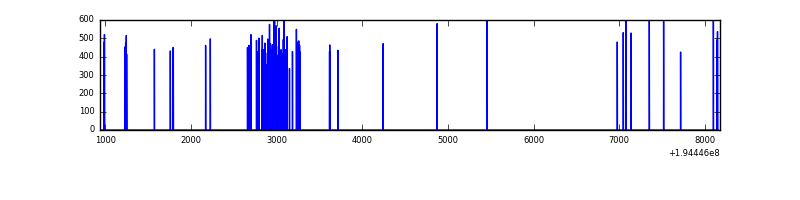 |
| D | 6383 | 272 | 0 | 0 | 0.00% | 0.00% | 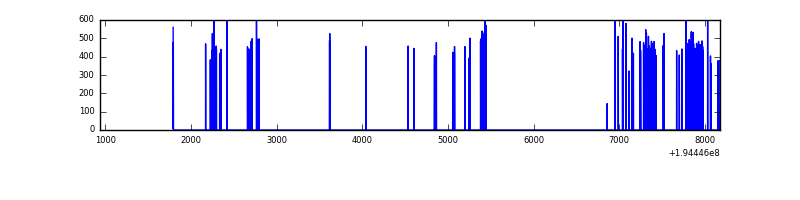 |
Top three noisy pixels from each quadrant. If the there are fewer than three noisy pixels in the level2.evt file, extra rows are filled as -1
| Pixel properties | Quadrant properties | ||||||
|---|---|---|---|---|---|---|---|
| Quadrant | DetID | PixID | Counts | Sigma | Mean | Median | Sigma |
| A | 0 | 226 | 315 | 38.87 | 26 | 26 | 7.4 |
| A | 12 | 194 | 302 | 37.12 | 26 | 26 | 7.4 |
| A | 3 | 1 | 205 | 24.08 | 26 | 26 | 7.4 |
| B | 7 | 205 | 2448 | 350.04 | 25 | 24 | 6.9 |
| B | 4 | 48 | 524 | 72.2 | 25 | 24 | 6.9 |
| B | 12 | 111 | 367 | 49.53 | 25 | 24 | 6.9 |
| C | 5 | 234 | 2719 | 701.14 | 9 | 9 | 3.9 |
| C | 2 | 53 | 126 | 30.27 | 9 | 9 | 3.9 |
| C | 13 | 61 | 82 | 18.89 | 9 | 9 | 3.9 |
| D | 9 | 66 | 2340 | 405.67 | 16 | 16 | 5.7 |
| D | 13 | 169 | 677 | 115.38 | 16 | 16 | 5.7 |
| D | 15 | 194 | 322 | 53.41 | 16 | 16 | 5.7 |
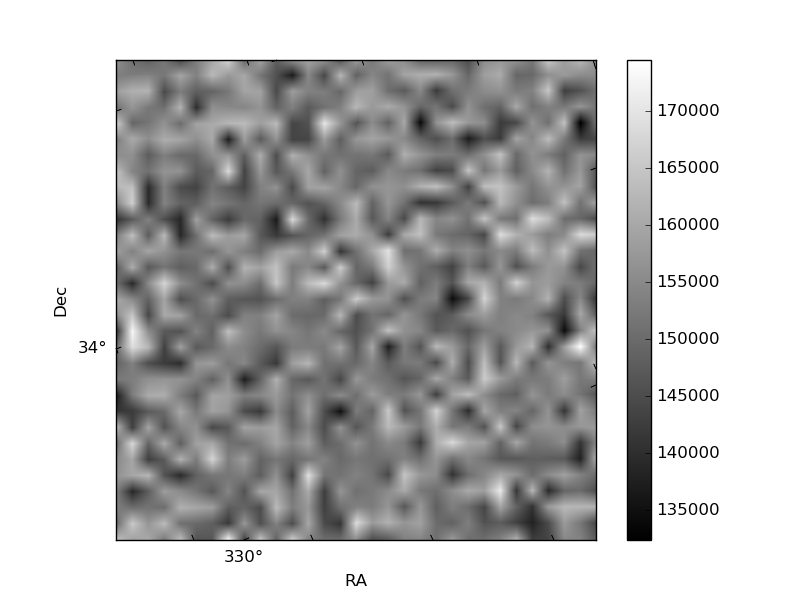
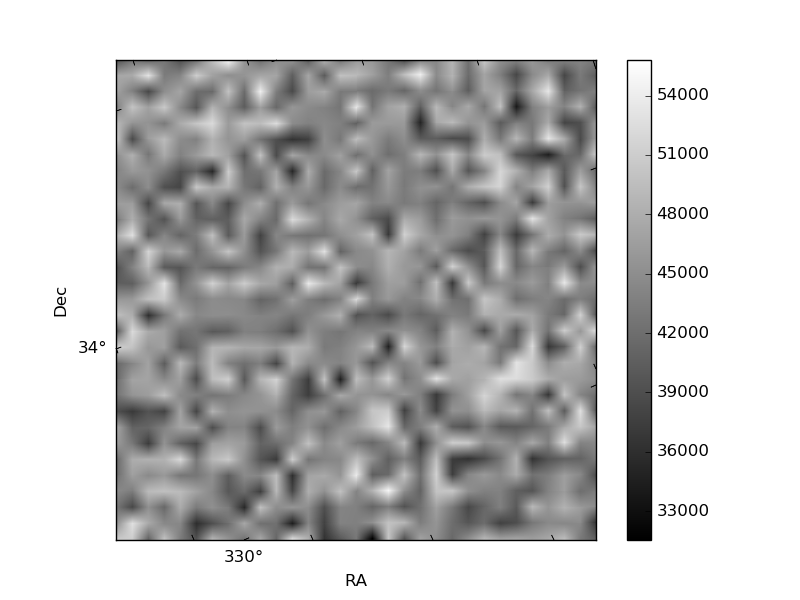
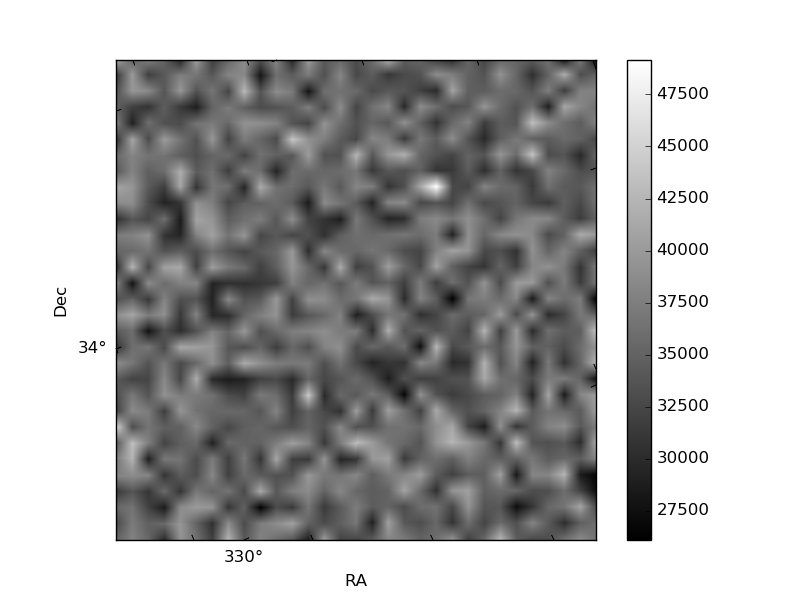
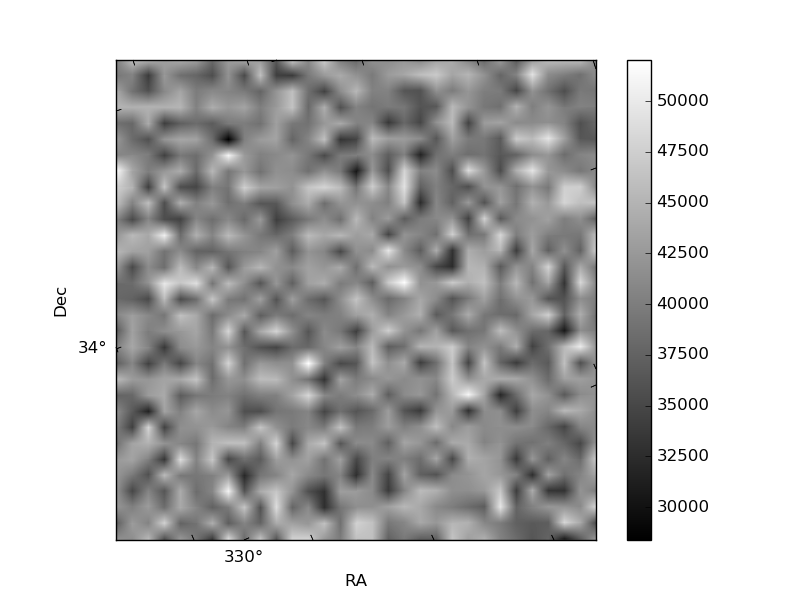
Histogram calculated using DETX and DETY for each event in the final _common_clean file
| Quadrant A | 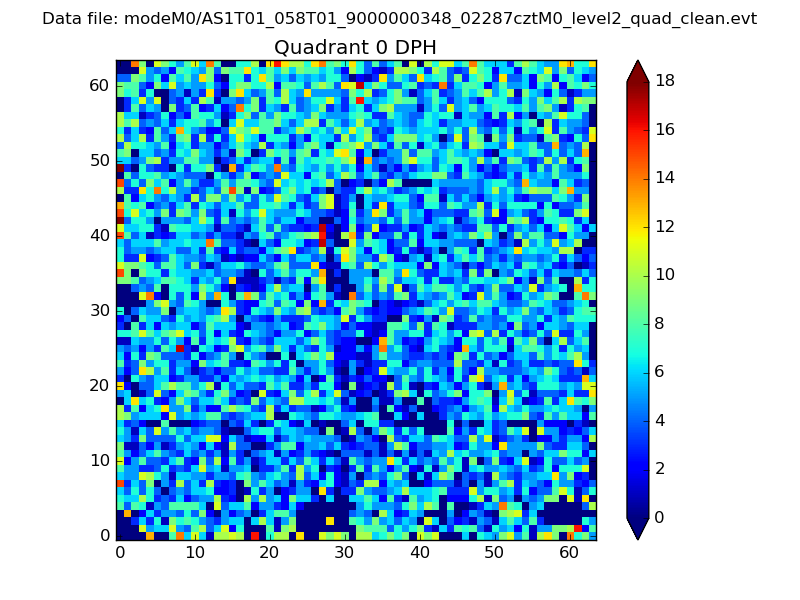 |
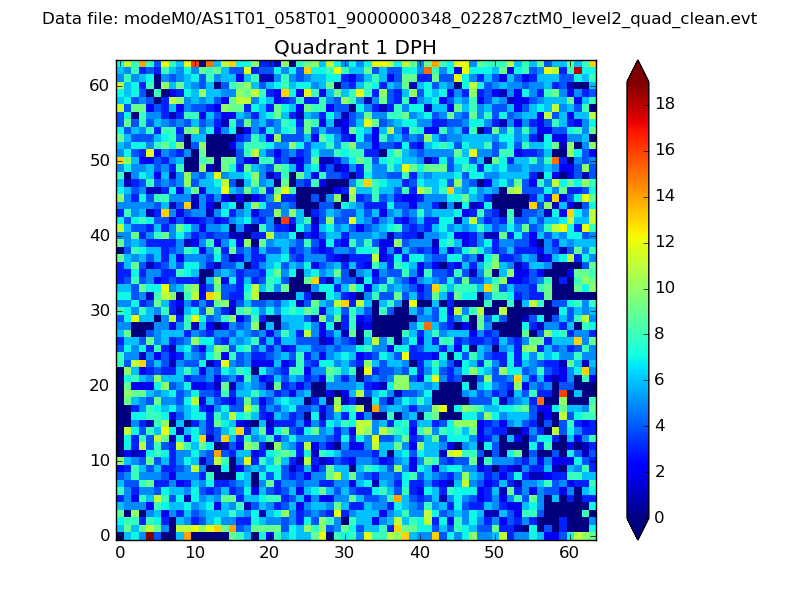 |
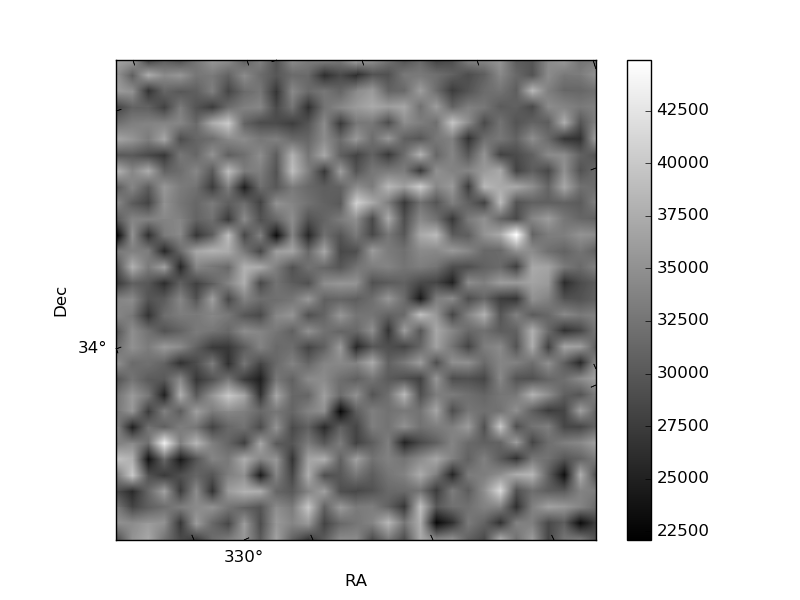
Quadrant B |
|---|---|---|---|
| Quadrant D | 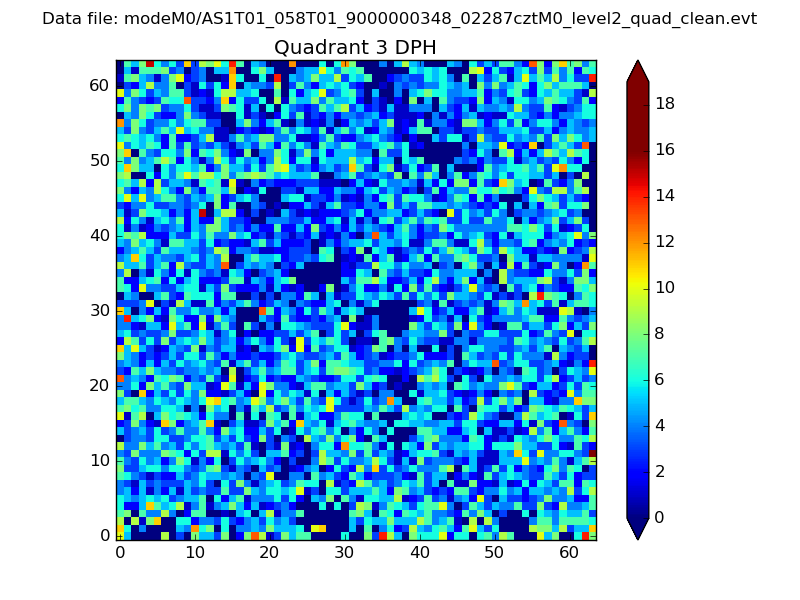 |
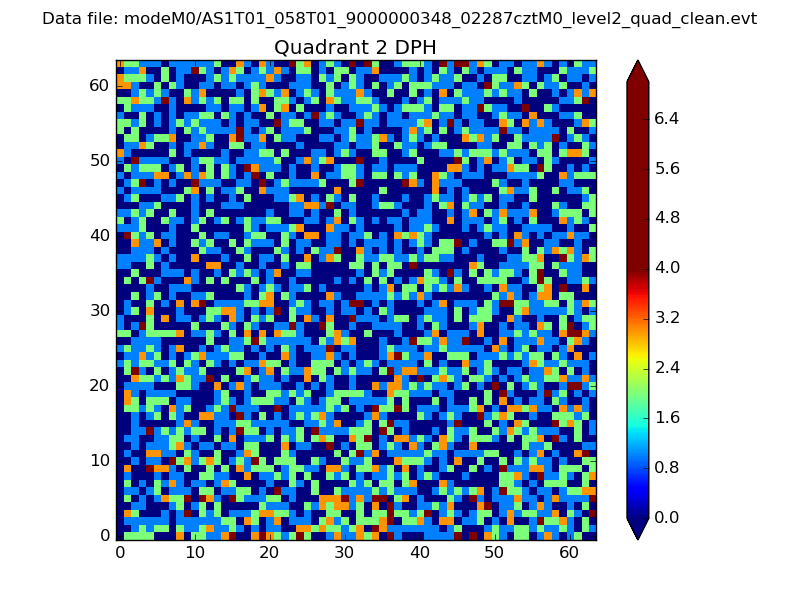 |
Quadrant C |
| Plot type | Count rate plots | Images |
|---|---|---|
| Comparison with Poisson distribution Blue bars denote a histogram of data divided into 1 sec bins. Red curve is a Poisson curve with rate = median count rate of data. |
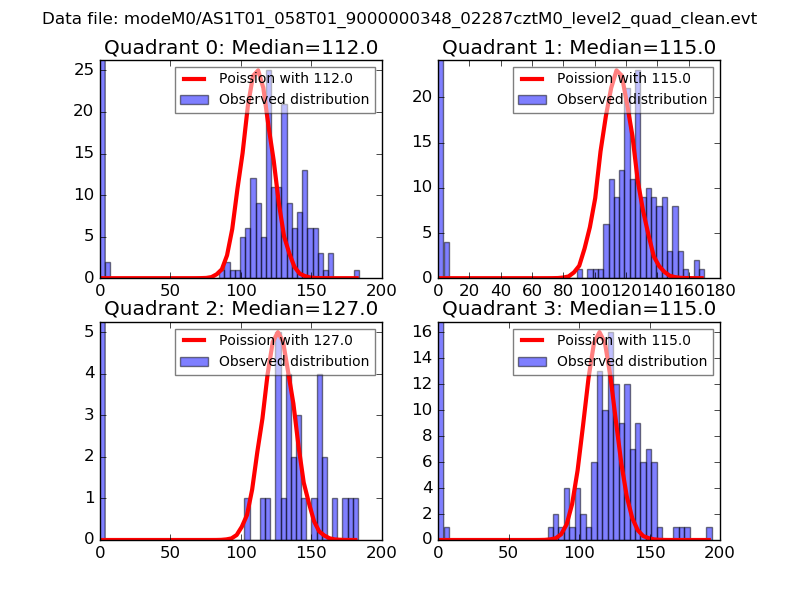 |
 |
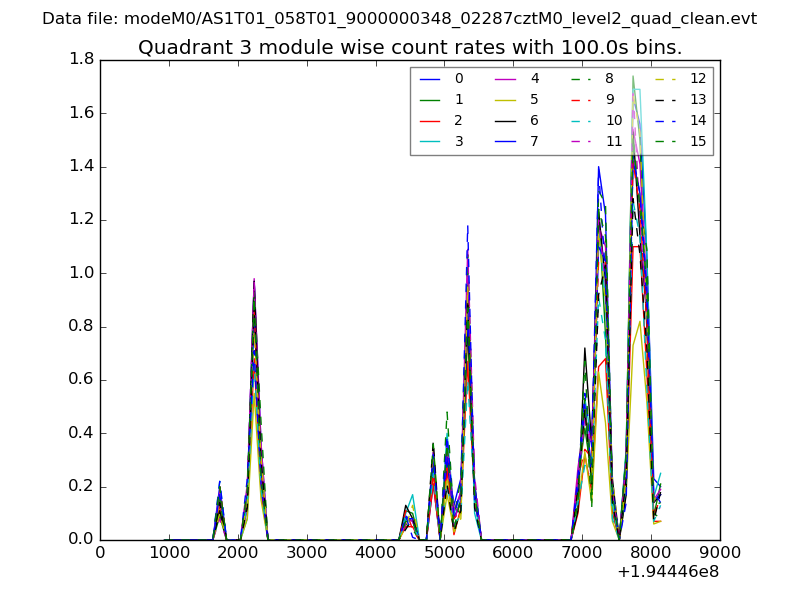
| Quadrant-wise count rates Data is divided into 100 sec bins |
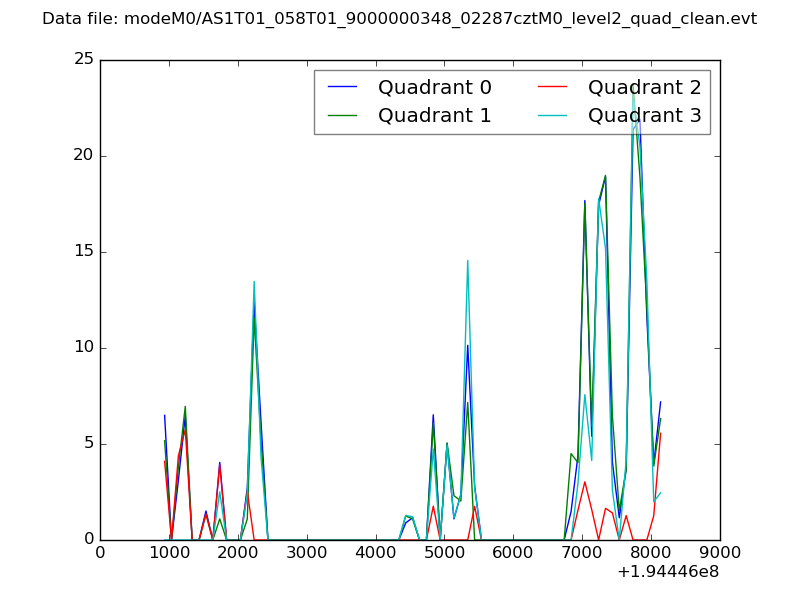 |
|
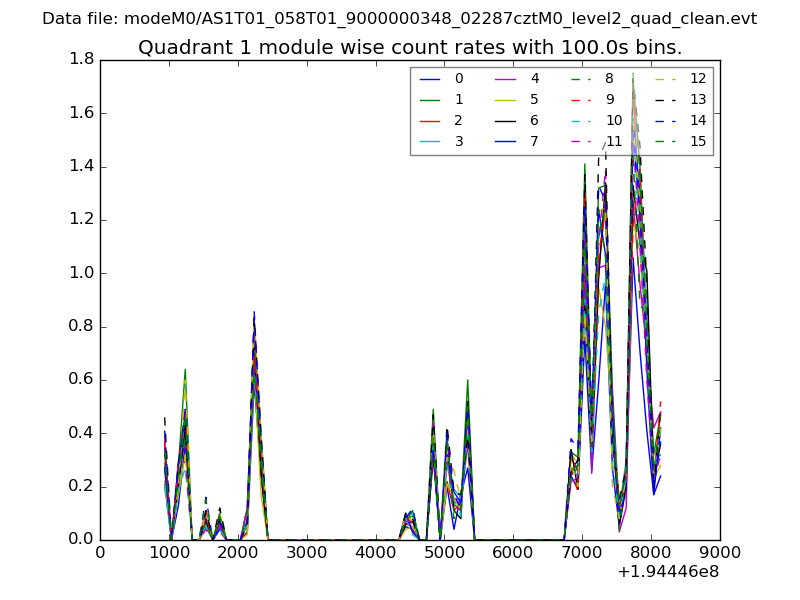
| Module-wise count rates for Quadrant A Data is divided into 100 sec bins |
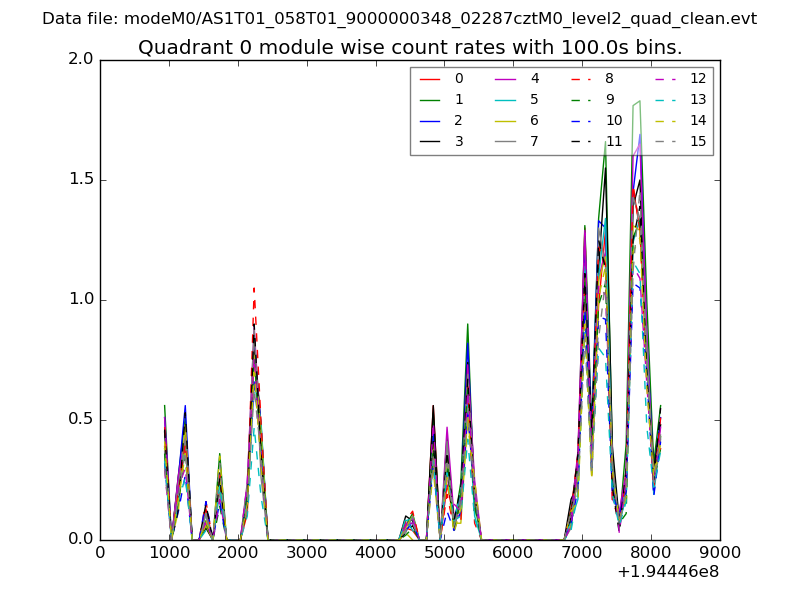 |
 |
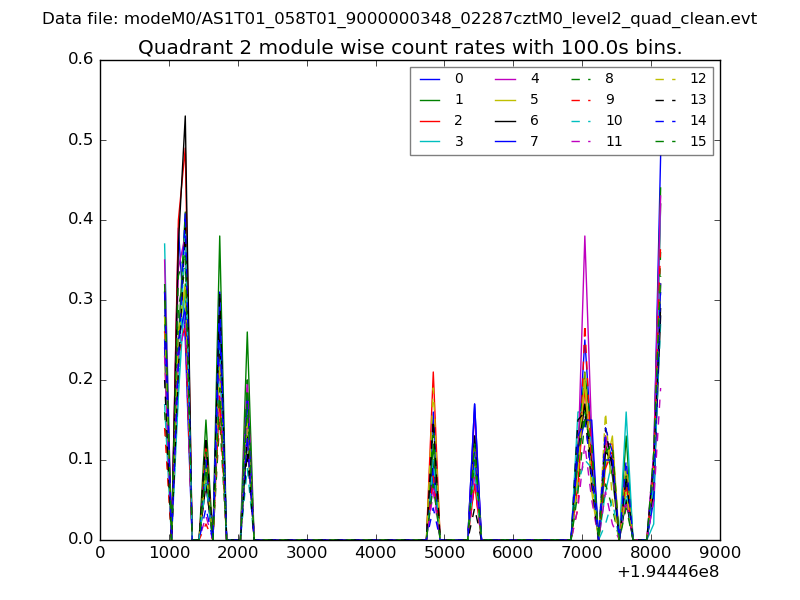
| Module-wise count rates for Quadrant B Data is divided into 100 sec bins |
 |
 |
| Module-wise count rates for Quadrant C Data is divided into 100 sec bins |
 |
 |
| Module-wise count rates for Quadrant D Data is divided into 100 sec bins |
 |
 |
| Parameter | Plot |
|---|---|
| CZT HV Monitor | 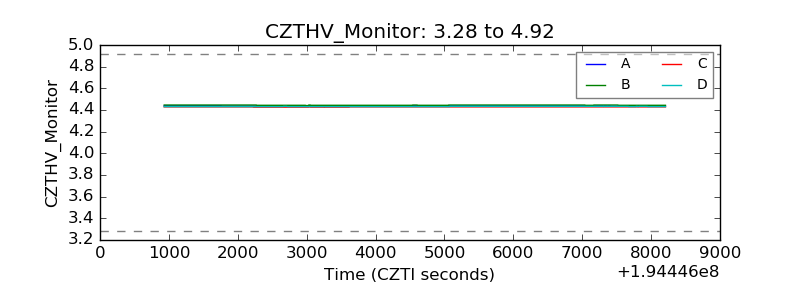 |
| D_VDD | 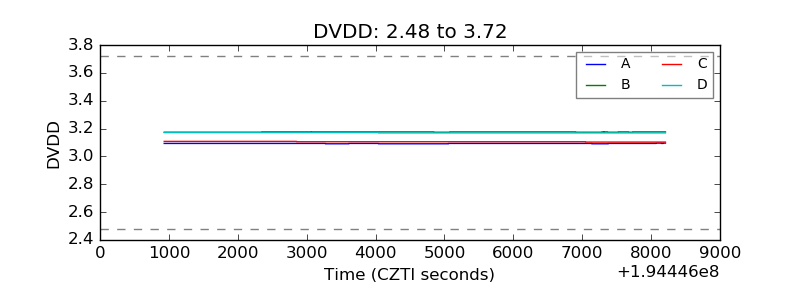 |
| Temperature 1 | 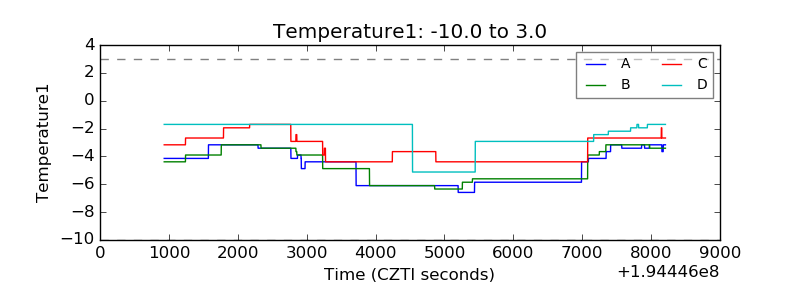 |
| Veto HV Monitor | 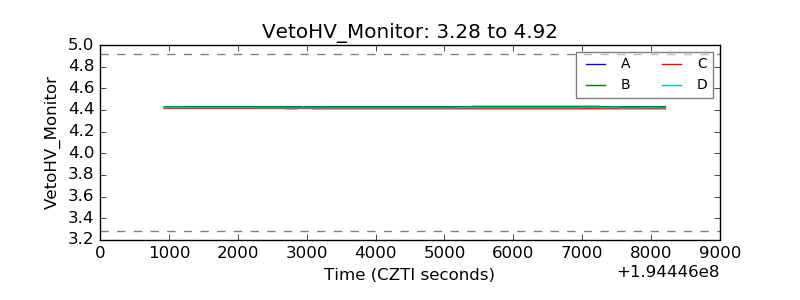 |
| Veto LLD | 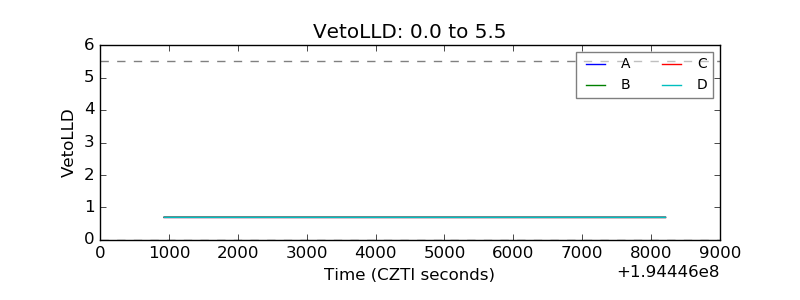 |
| Alpha Counter | 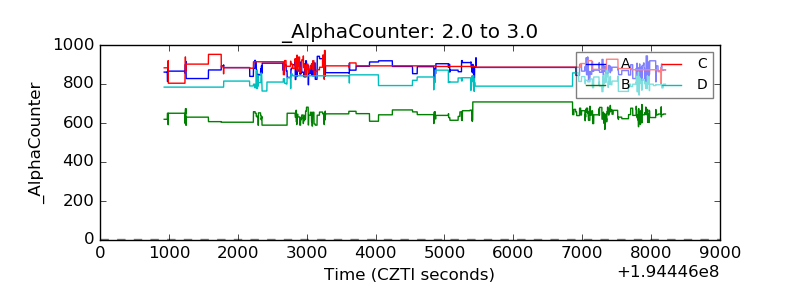 |
| _CPM_Rate | 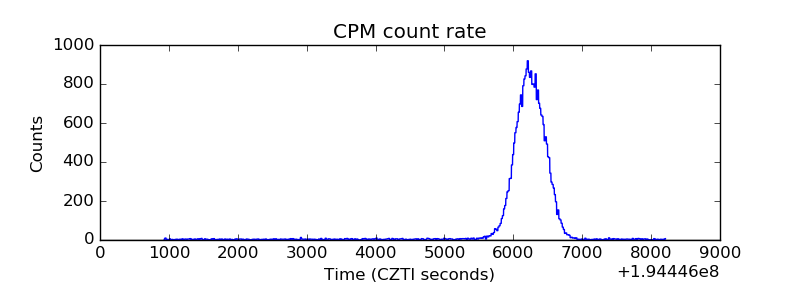 |
| CZT Counter | 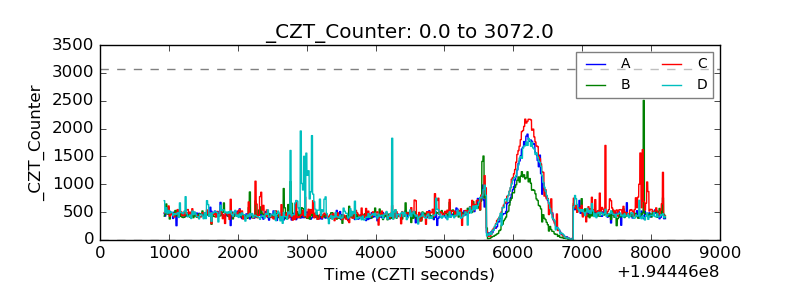 |
| +2.5 Volts monitor | 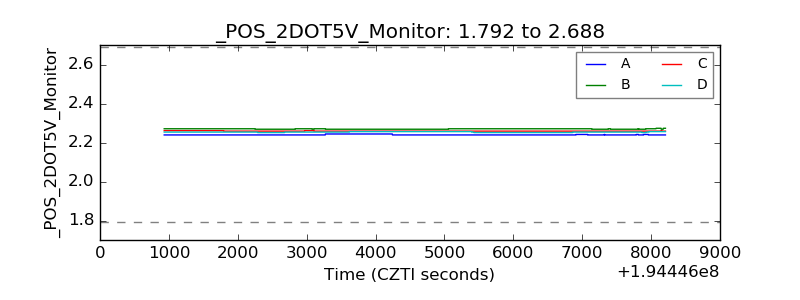 |
| +5 Volts monitor | 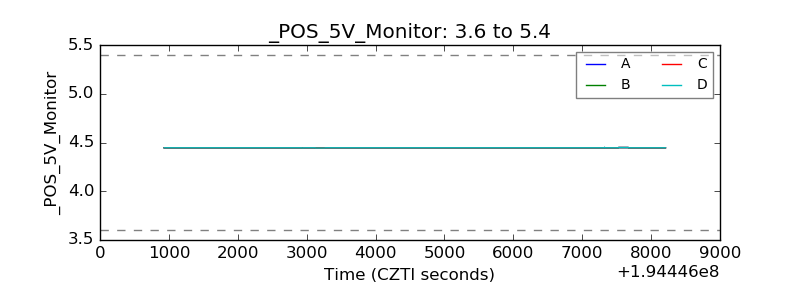 |
| _ROLL_ROT | 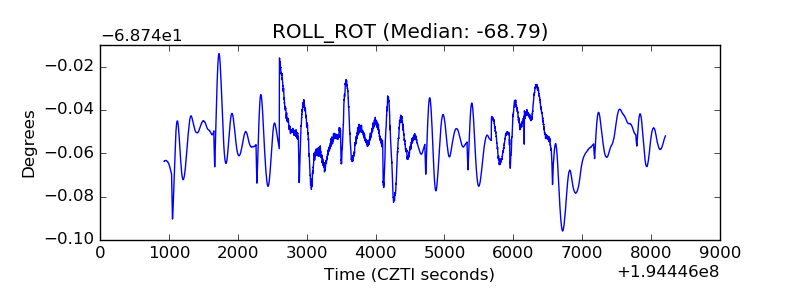 |
| _Roll_DEC | 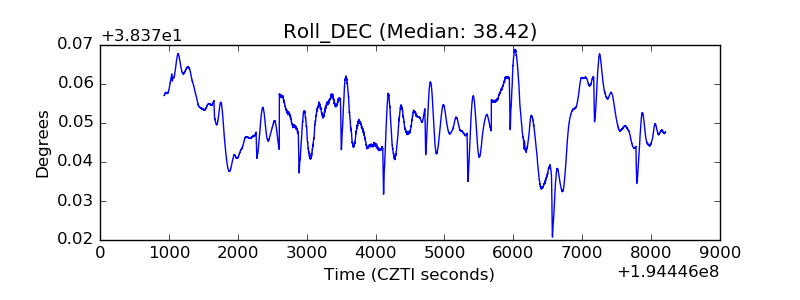 |
| _Roll_RA | 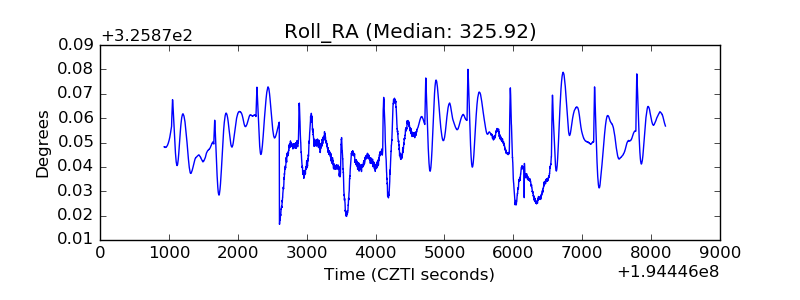 |
| Veto Counter | 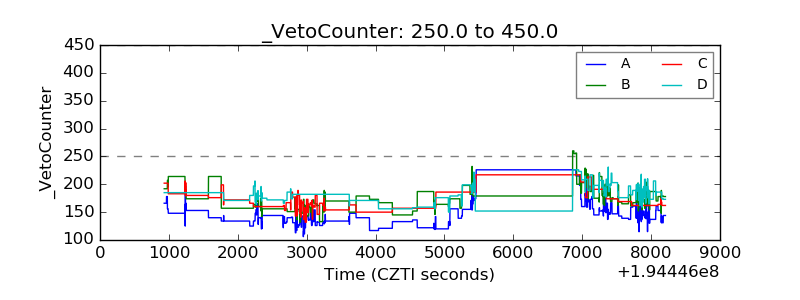 |