| Param | Original file | Final file |
|---|---|---|
| Filename | modeM0/AS1T01_058T01_9000000348_02290cztM0_level2.evt | modeM0/AS1T01_058T01_9000000348_02290cztM0_level2_quad_clean.evt |
| Size (bytes) | 17,170,560 | 2,799,360 |
| Size | 16.4 MB | 2.7 MB |
| Events in quadrant A | 161,472 | 15,595 |
| Events in quadrant B | 100,655 | 7,900 |
| Events in quadrant C | 151,145 | 12,532 |
| Events in quadrant D | 79,310 | 16,024 |
| Mode M9 | |||
|---|---|---|---|
| Quadrant | BADHDUFLAG | Total packets | Discarded packets |
| A | 0 | 1 | 0 |
| B | 1 | 1 | 0 |
| C | 1 | -1 | -1 |
| D | 1 | -1 | -1 |
| Mode SS | |||
|---|---|---|---|
| Quadrant | BADHDUFLAG | Total packets | Discarded packets |
| A | 0 | 273359709408 | 0 |
| B | 0 | -1 | -1 |
| C | 0 | -1 | -1 |
| D | 0 | -1 | -1 |
| Mode M0 | |||
|---|---|---|---|
| Quadrant | BADHDUFLAG | Total packets | Discarded packets |
| A | 0 | 6953 | 6204 |
| B | 0 | 7901 | 7440 |
| C | 0 | 7209 | 6532 |
| D | 0 | 9060 | 8688 |
| Quadrant | Total seconds | Saturated seconds | Saturation percentage |
|---|---|---|---|
| A | 375 | 1 | 0.266667% |
| B | 231 | 0 | 0.000000% |
| C | 339 | 0 | 0.000000% |
| D | 187 | 0 | 0.000000% |
Noise dominated data is calculated using 1-second bins in cleaned event files. If a bin has >2000 counts, and if more than 50% of those come from <1% of pixels, then it is considered to be noise-dominated and hence unusable.
| Quadrant | # 1 sec bins | Bins with >0 counts | Bins with >2000 counts | High rate bins dominated by noise | Noise dominated (total time) | Noise dominated (detector-on time) | Marked lightcurve |
|---|---|---|---|---|---|---|---|
| A | 7149 | 662 | 0 | 0 | 0.00% | 0.00% | 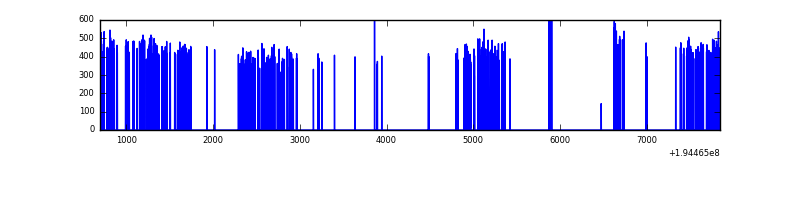 |
| B | 6639 | 411 | 0 | 0 | 0.00% | 0.00% | 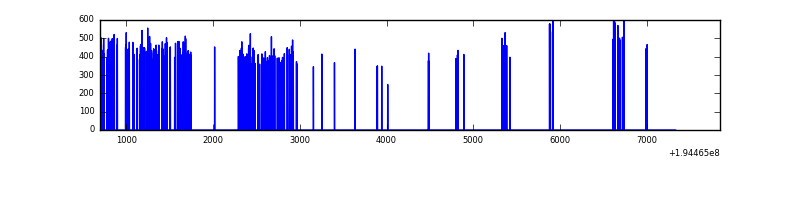 |
| C | 7149 | 607 | 0 | 0 | 0.00% | 0.00% | 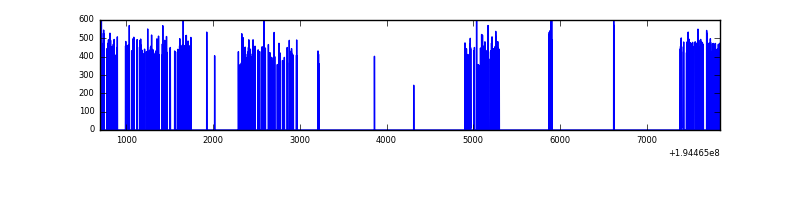 |
| D | 6187 | 321 | 0 | 0 | 0.00% | 0.00% | 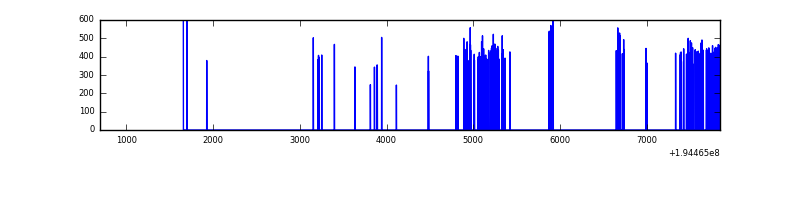 |
Top three noisy pixels from each quadrant. If the there are fewer than three noisy pixels in the level2.evt file, extra rows are filled as -1
| Pixel properties | Quadrant properties | ||||||
|---|---|---|---|---|---|---|---|
| Quadrant | DetID | PixID | Counts | Sigma | Mean | Median | Sigma |
| A | 0 | 226 | 471 | 40.27 | 41 | 40 | 10.7 |
| A | 12 | 194 | 449 | 38.22 | 41 | 40 | 10.7 |
| A | 12 | 133 | 214 | 16.26 | 41 | 40 | 10.7 |
| B | 12 | 111 | 404 | 52.87 | 25 | 25 | 7.2 |
| B | 11 | 111 | 355 | 46.03 | 25 | 25 | 7.2 |
| B | 8 | 61 | 292 | 37.25 | 25 | 25 | 7.2 |
| C | 5 | 234 | 5379 | 495.67 | 36 | 36 | 10.8 |
| C | 14 | 223 | 1079 | 96.76 | 36 | 36 | 10.8 |
| C | 13 | 61 | 325 | 26.81 | 36 | 36 | 10.8 |
| D | 15 | 194 | 441 | 63.2 | 20 | 19 | 6.7 |
| D | 9 | 66 | 286 | 39.99 | 20 | 19 | 6.7 |
| D | 14 | 226 | 264 | 36.69 | 20 | 19 | 6.7 |
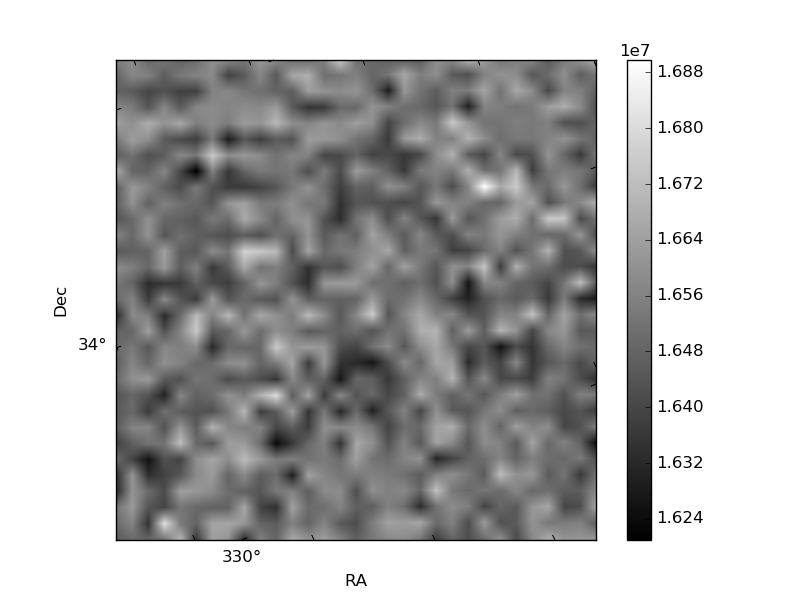
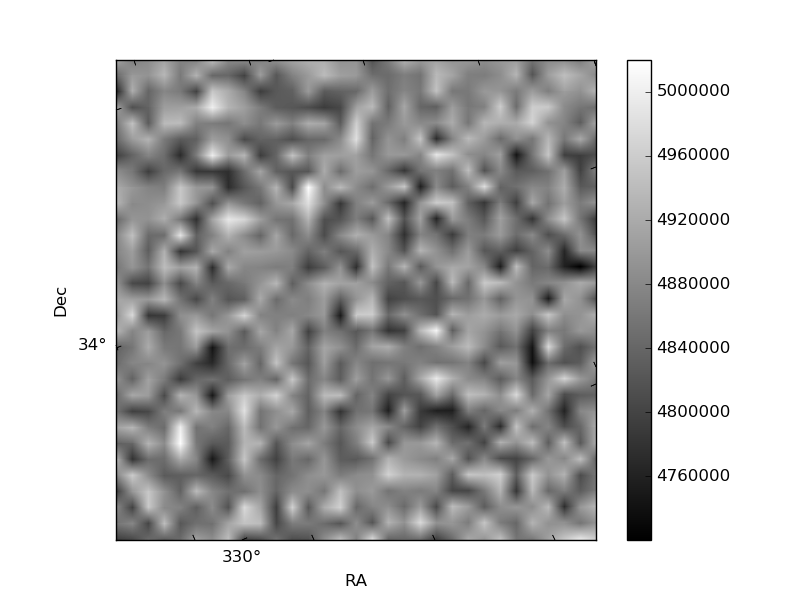
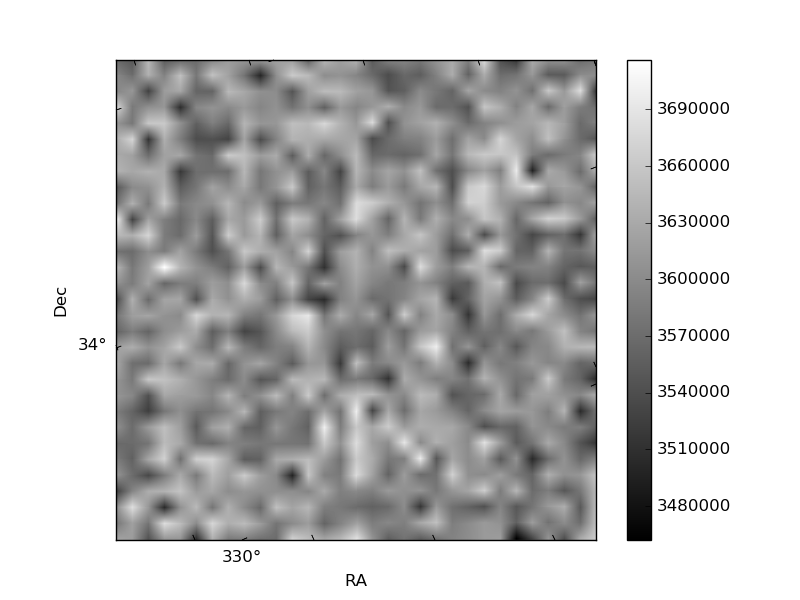
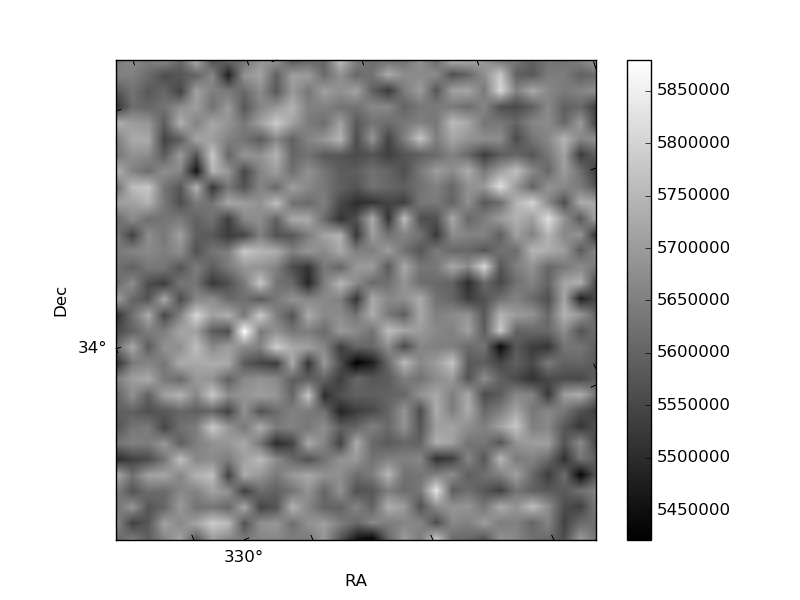
Histogram calculated using DETX and DETY for each event in the final _common_clean file
| Quadrant A | 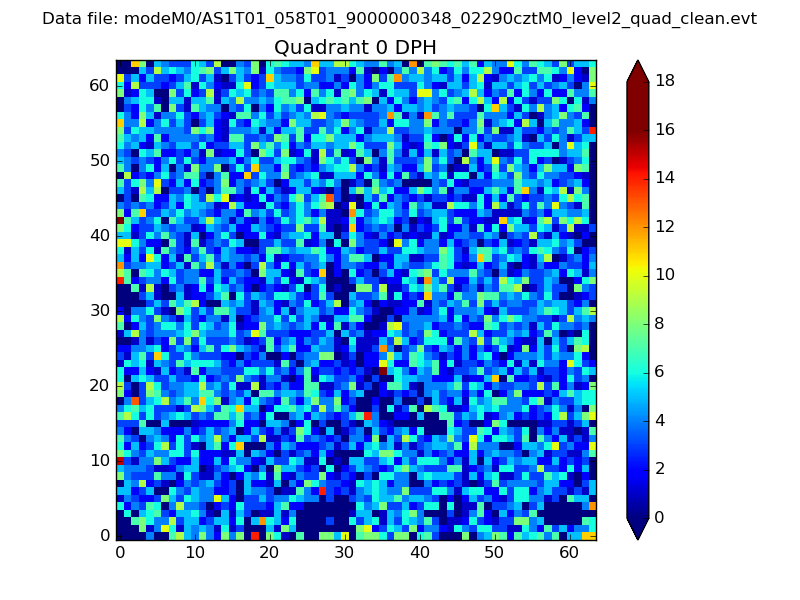 |
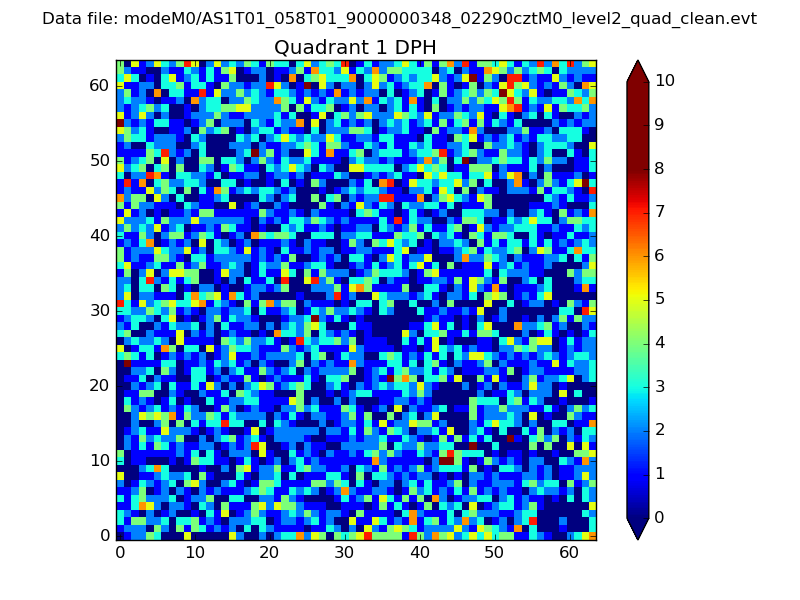 |
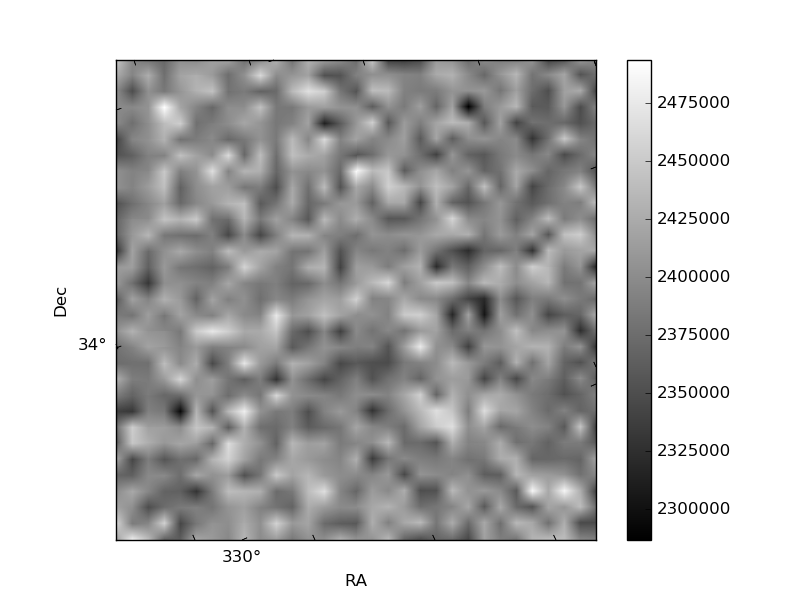
Quadrant B |
|---|---|---|---|
| Quadrant D | 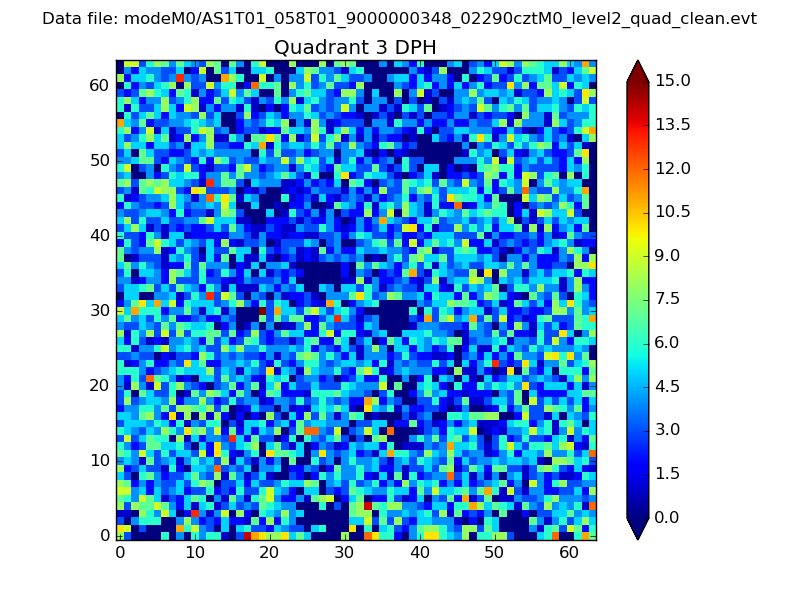 |
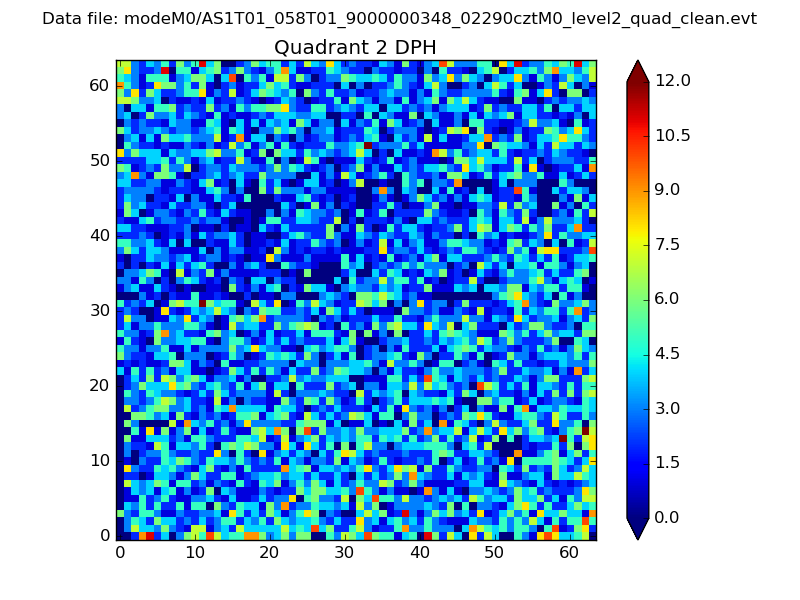 |
Quadrant C |
| Plot type | Count rate plots | Images |
|---|---|---|
| Comparison with Poisson distribution Blue bars denote a histogram of data divided into 1 sec bins. Red curve is a Poisson curve with rate = median count rate of data. |
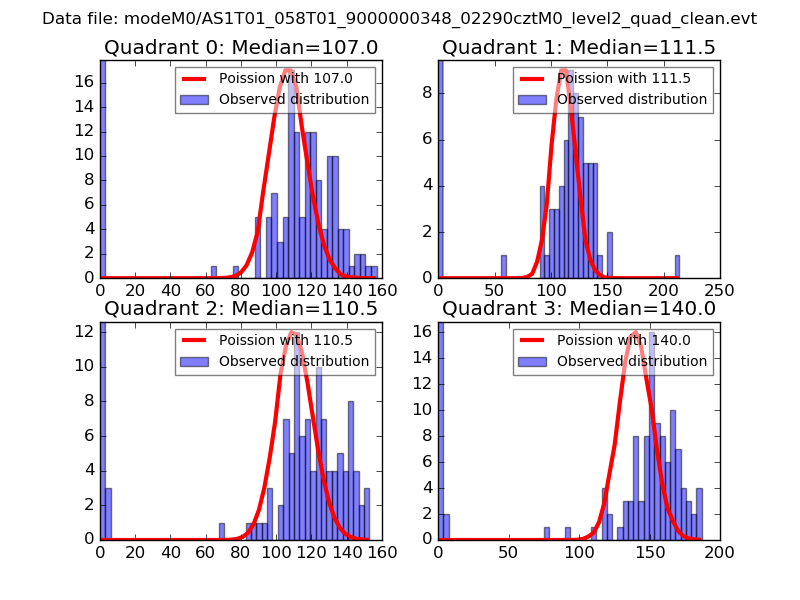 |
 |
| Quadrant-wise count rates Data is divided into 100 sec bins |
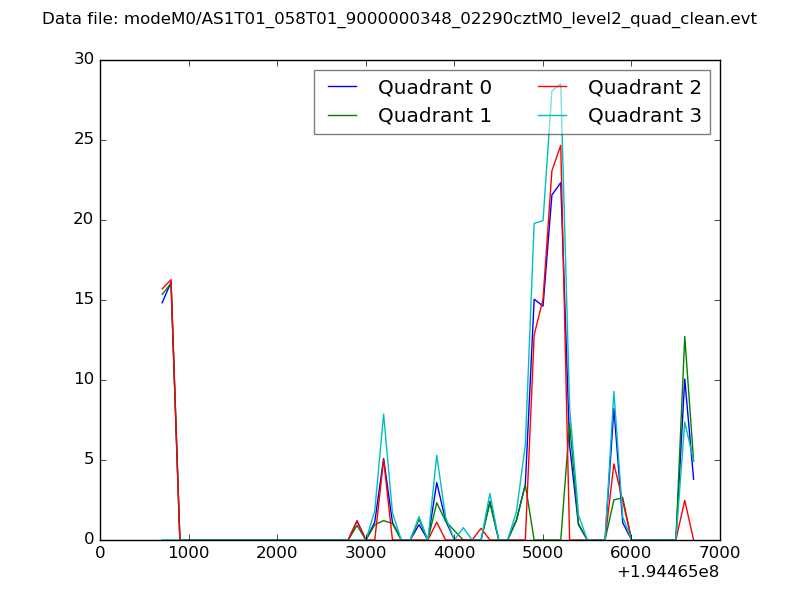 |
|
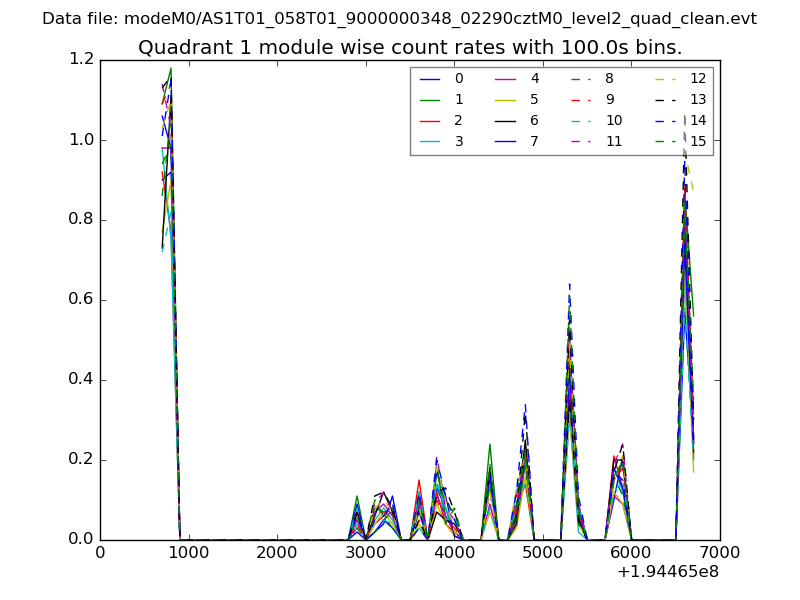
| Module-wise count rates for Quadrant A Data is divided into 100 sec bins |
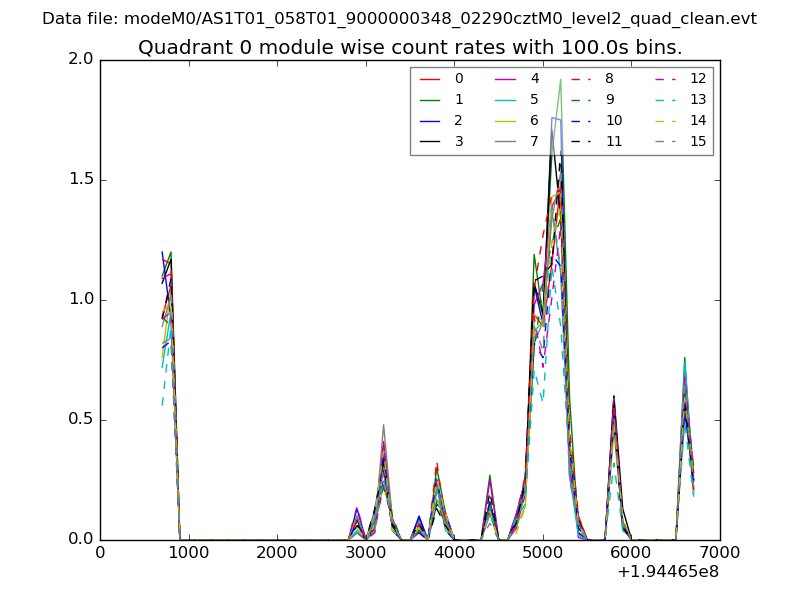 |
 |
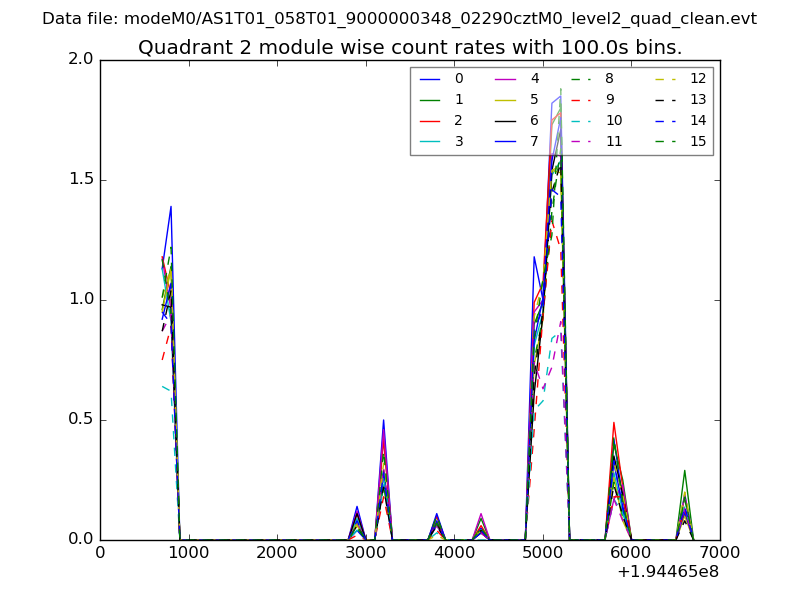
| Module-wise count rates for Quadrant B Data is divided into 100 sec bins |
 |
 |
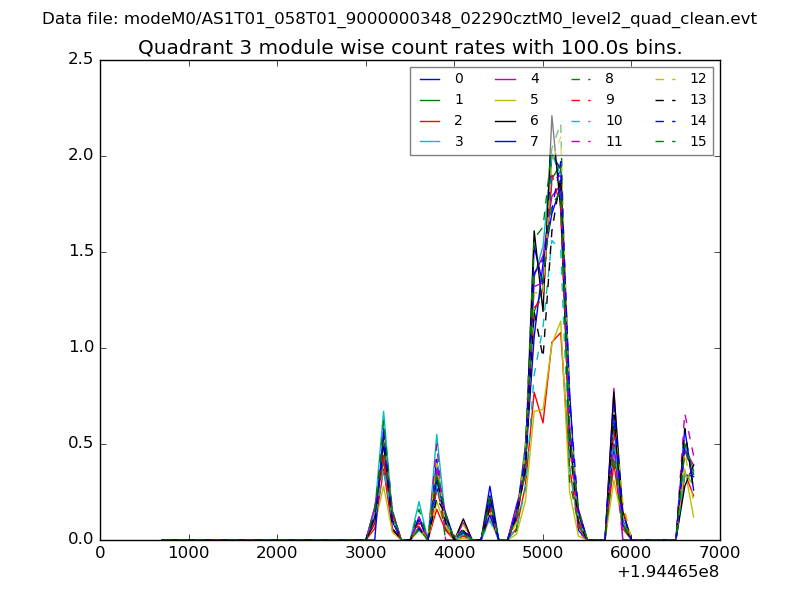
| Module-wise count rates for Quadrant C Data is divided into 100 sec bins |
 |
 |
| Module-wise count rates for Quadrant D Data is divided into 100 sec bins |
 |
 |
| Parameter | Plot |
|---|---|
| CZT HV Monitor | 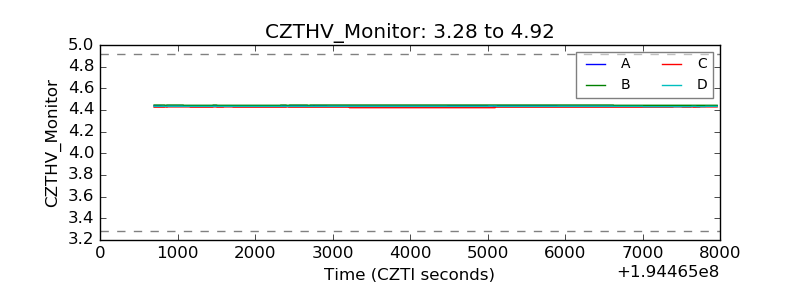 |
| D_VDD | 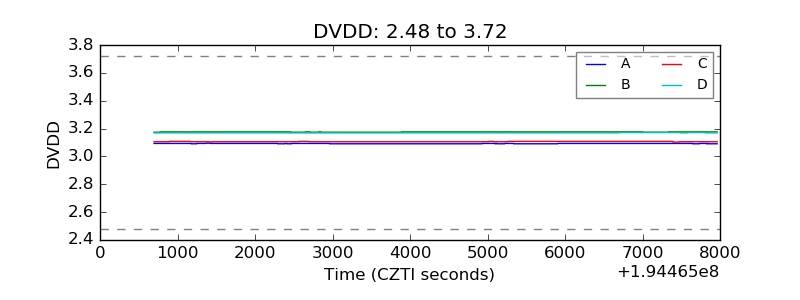 |
| Temperature 1 | 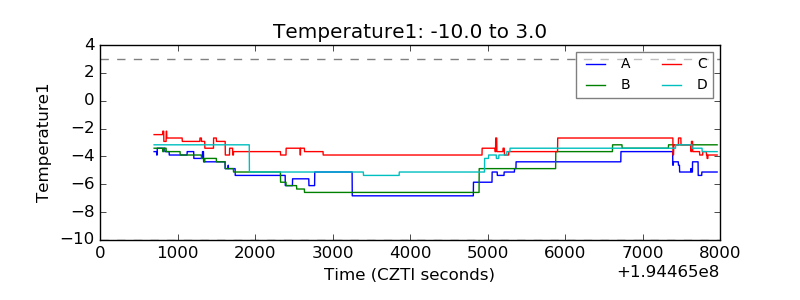 |
| Veto HV Monitor | 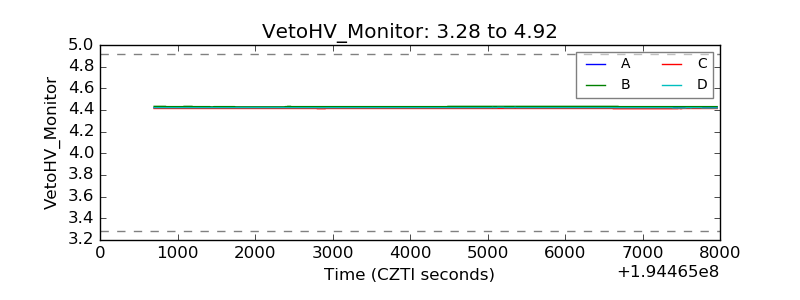 |
| Veto LLD | 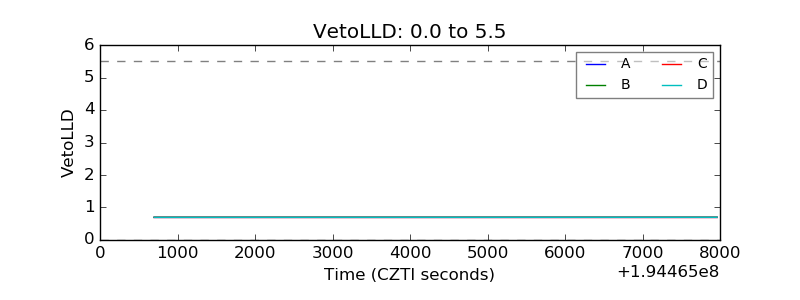 |
| Alpha Counter | 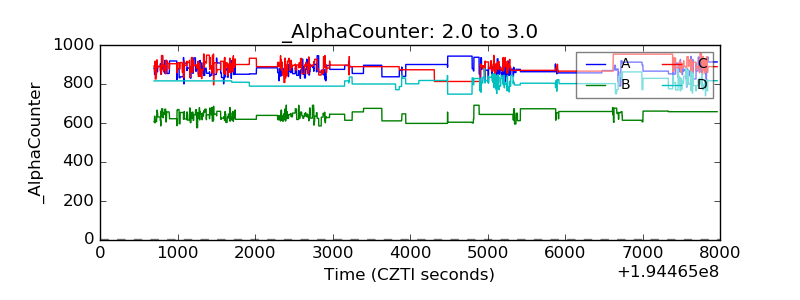 |
| _CPM_Rate | 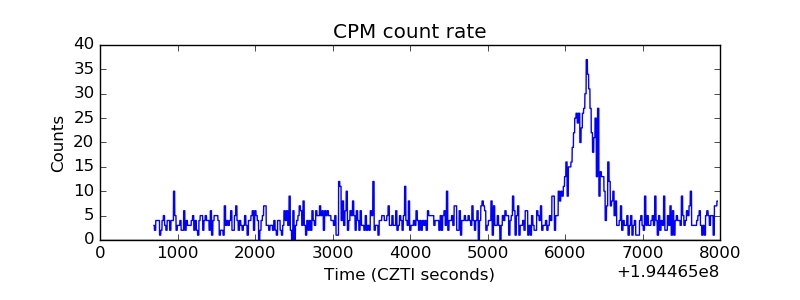 |
| CZT Counter | 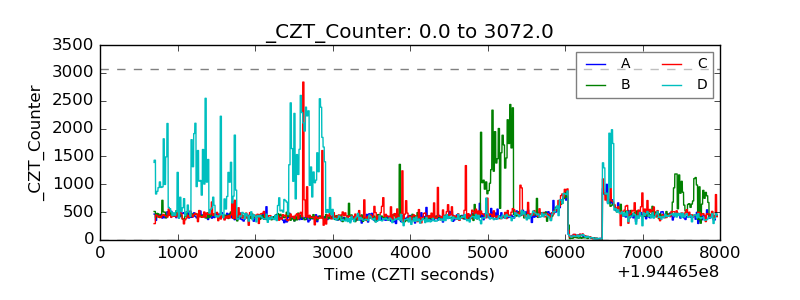 |
| +2.5 Volts monitor | 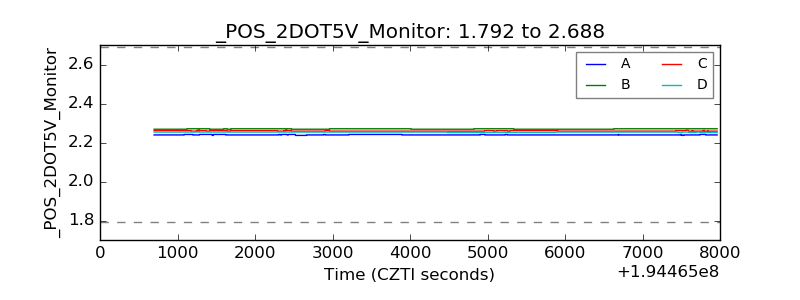 |
| +5 Volts monitor | 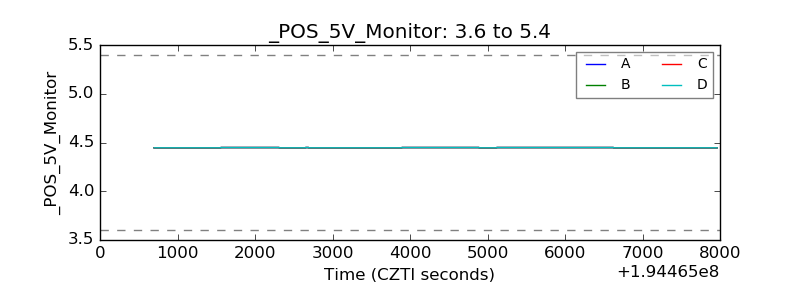 |
| _ROLL_ROT | 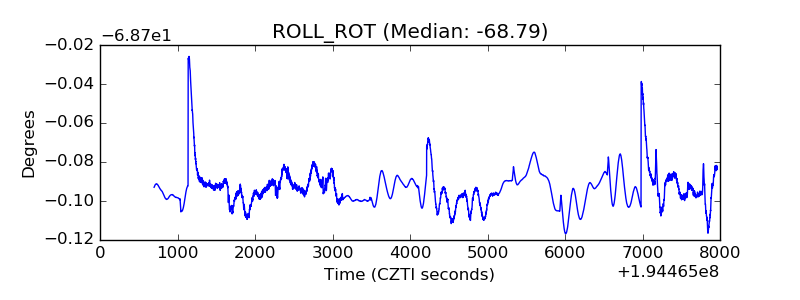 |
| _Roll_DEC | 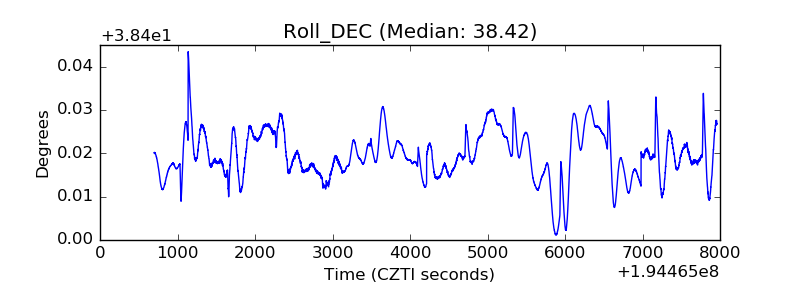 |
| _Roll_RA | 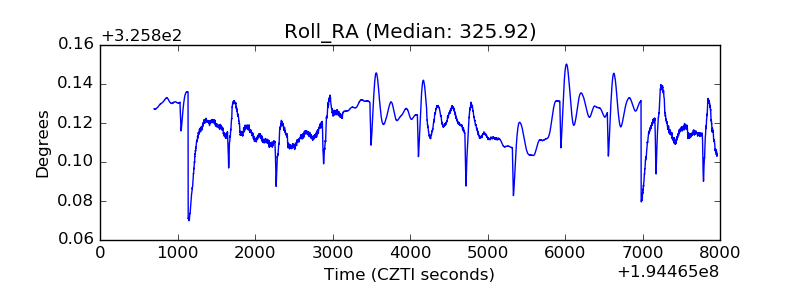 |
| Veto Counter | 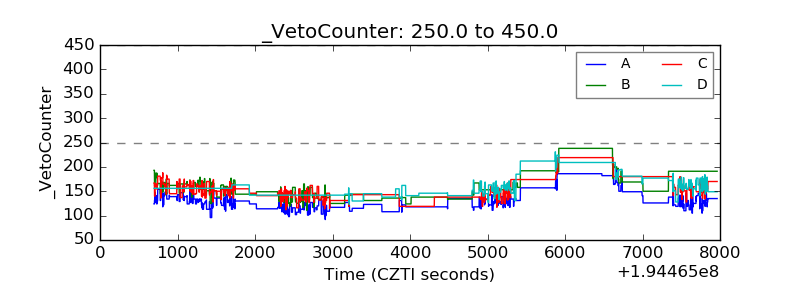 |