| Param | Original file | Final file |
|---|---|---|
| Filename | modeM0/AS1T01_058T01_9000000348_02291cztM0_level2.evt | modeM0/AS1T01_058T01_9000000348_02291cztM0_level2_quad_clean.evt |
| Size (bytes) | 502,329,600 | 80,665,920 |
| Size | 479.1 MB | 76.9 MB |
| Events in quadrant A | 3,484,706 | 469,044 |
| Events in quadrant B | 3,880,506 | 478,196 |
| Events in quadrant C | 3,820,711 | 484,949 |
| Events in quadrant D | 3,496,692 | 467,594 |
| Mode M9 | |||
|---|---|---|---|
| Quadrant | BADHDUFLAG | Total packets | Discarded packets |
| A | 1 | 273359709408 | 0 |
| B | 1 | -1 | -1 |
| C | 1 | -1 | -1 |
| D | 1 | -1 | -1 |
| Mode SS | |||
|---|---|---|---|
| Quadrant | BADHDUFLAG | Total packets | Discarded packets |
| A | 0 | 158 | 0 |
| B | 0 | 158 | 0 |
| C | 0 | 158 | 0 |
| D | 0 | 158 | 0 |
| Mode M0 | |||
|---|---|---|---|
| Quadrant | BADHDUFLAG | Total packets | Discarded packets |
| A | 0 | 16187 | 3 |
| B | 0 | 17077 | 2 |
| C | 0 | 16681 | 2 |
| D | 0 | 16473 | 2 |
| Quadrant | Total seconds | Saturated seconds | Saturation percentage |
|---|---|---|---|
| A | 7799 | 101 | 1.295038% |
| B | 7799 | 119 | 1.525837% |
| C | 7799 | 73 | 0.936017% |
| D | 7799 | 129 | 1.654058% |
Noise dominated data is calculated using 1-second bins in cleaned event files. If a bin has >2000 counts, and if more than 50% of those come from <1% of pixels, then it is considered to be noise-dominated and hence unusable.
| Quadrant | # 1 sec bins | Bins with >0 counts | Bins with >2000 counts | High rate bins dominated by noise | Noise dominated (total time) | Noise dominated (detector-on time) | Marked lightcurve |
|---|---|---|---|---|---|---|---|
| A | 7874 | 7799 | 0 | 0 | 0.00% | 0.00% | 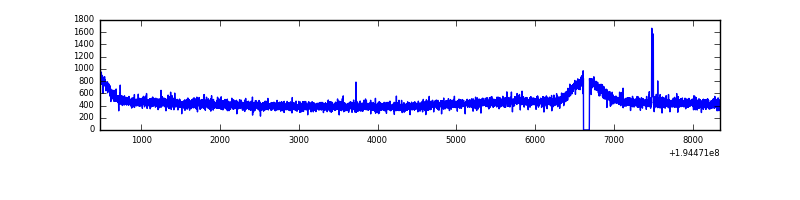 |
| B | 7874 | 7799 | 6 | 6 | 0.08% | 0.08% | 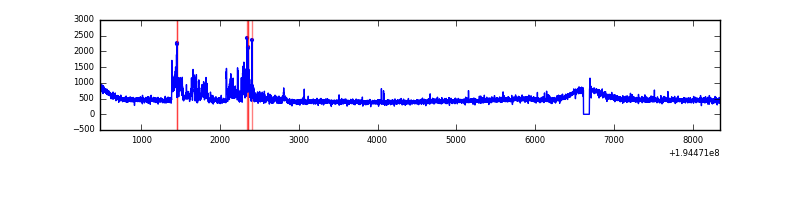 |
| C | 7874 | 7799 | 4 | 4 | 0.05% | 0.05% | 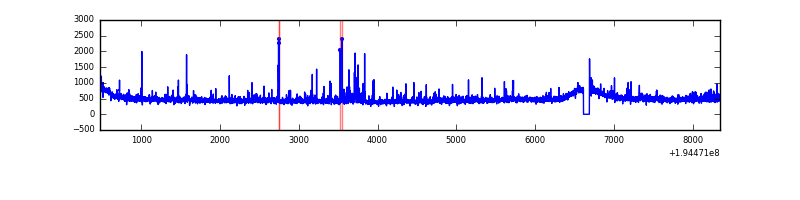 |
| D | 7873 | 7798 | 23 | 23 | 0.29% | 0.29% | 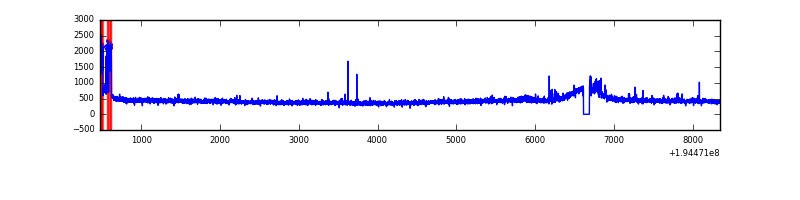 |
Top three noisy pixels from each quadrant. If the there are fewer than three noisy pixels in the level2.evt file, extra rows are filled as -1
| Pixel properties | Quadrant properties | ||||||
|---|---|---|---|---|---|---|---|
| Quadrant | DetID | PixID | Counts | Sigma | Mean | Median | Sigma |
| A | 12 | 133 | 14564 | 73.3 | 902 | 877 | 186.7 |
| A | 12 | 194 | 10099 | 49.39 | 902 | 877 | 186.7 |
| A | 0 | 226 | 9779 | 47.68 | 902 | 877 | 186.7 |
| B | 4 | 48 | 333086 | 1904.47 | 911 | 887 | 174.4 |
| B | 4 | 200 | 13801 | 74.03 | 911 | 887 | 174.4 |
| B | 12 | 111 | 13721 | 73.58 | 911 | 887 | 174.4 |
| C | 5 | 234 | 326240 | 1566.9 | 887 | 892 | 207.6 |
| C | 8 | 112 | 8951 | 38.81 | 887 | 892 | 207.6 |
| C | 10 | 65 | 8755 | 37.87 | 887 | 892 | 207.6 |
| D | 9 | 66 | 143854 | 684.19 | 878 | 856 | 209.0 |
| D | 15 | 194 | 17021 | 77.34 | 878 | 856 | 209.0 |
| D | 13 | 169 | 14225 | 63.97 | 878 | 856 | 209.0 |
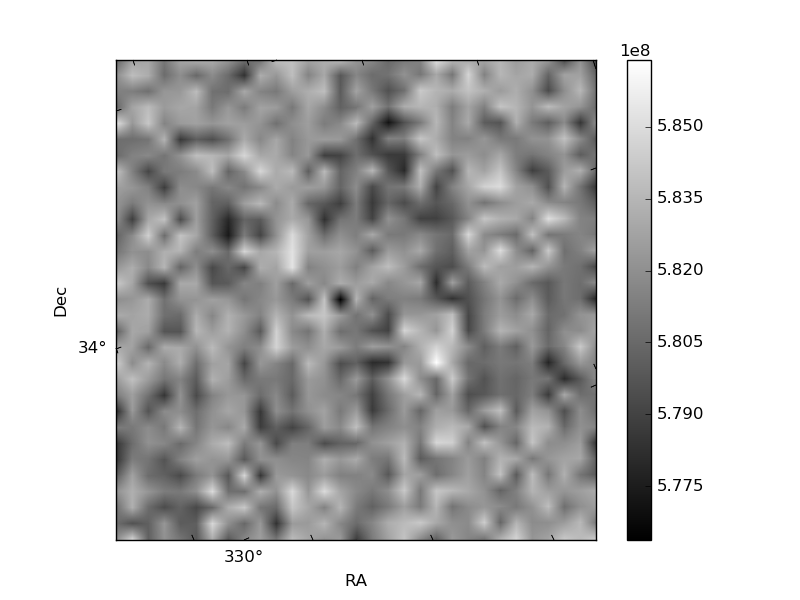
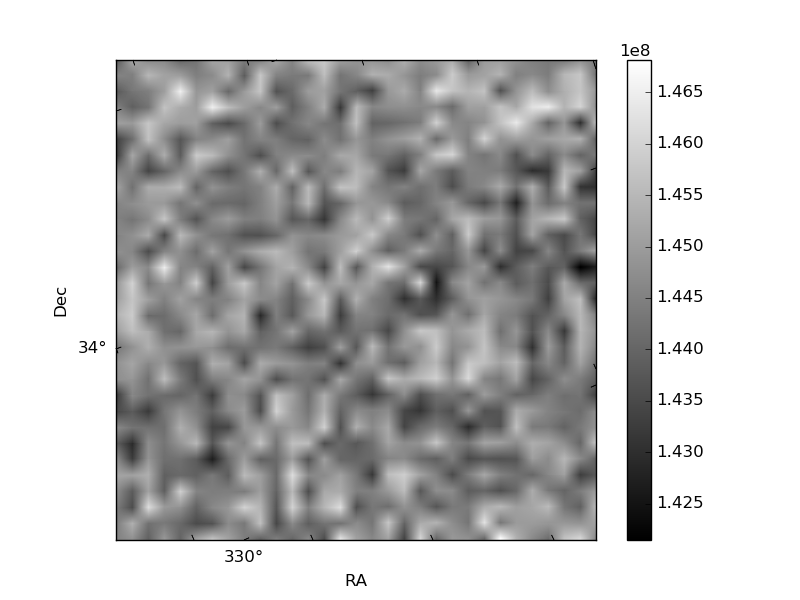
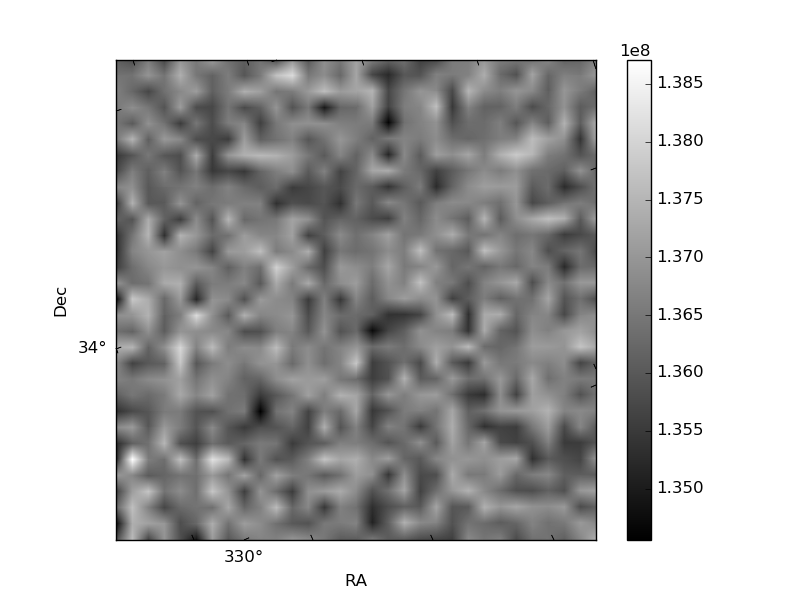
Histogram calculated using DETX and DETY for each event in the final _common_clean file
| Quadrant A | 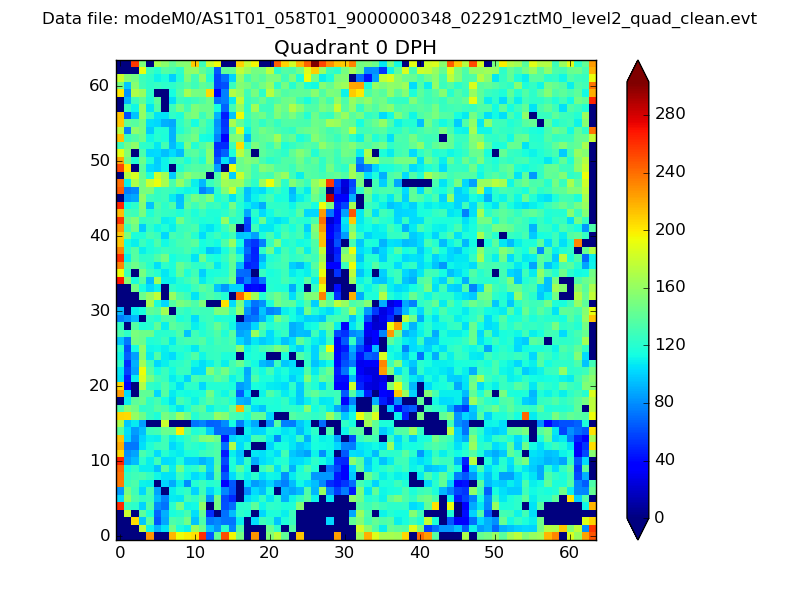 |
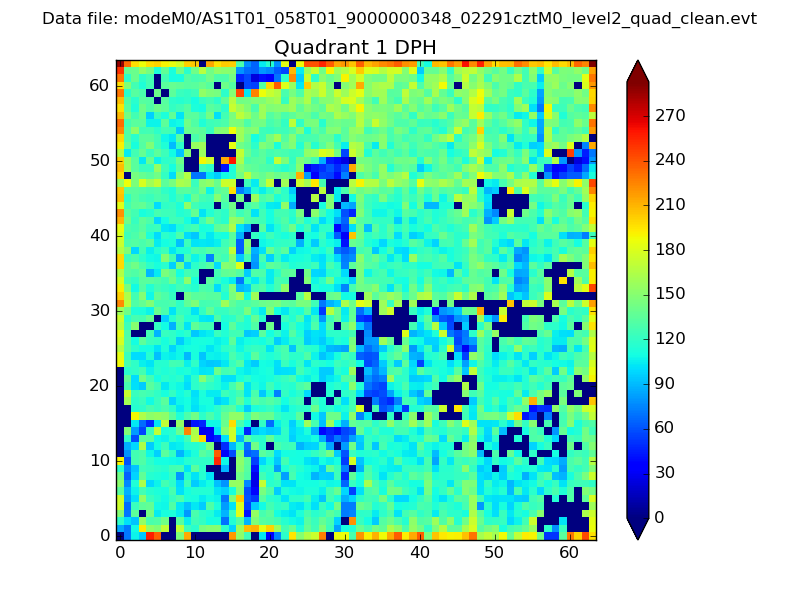 |
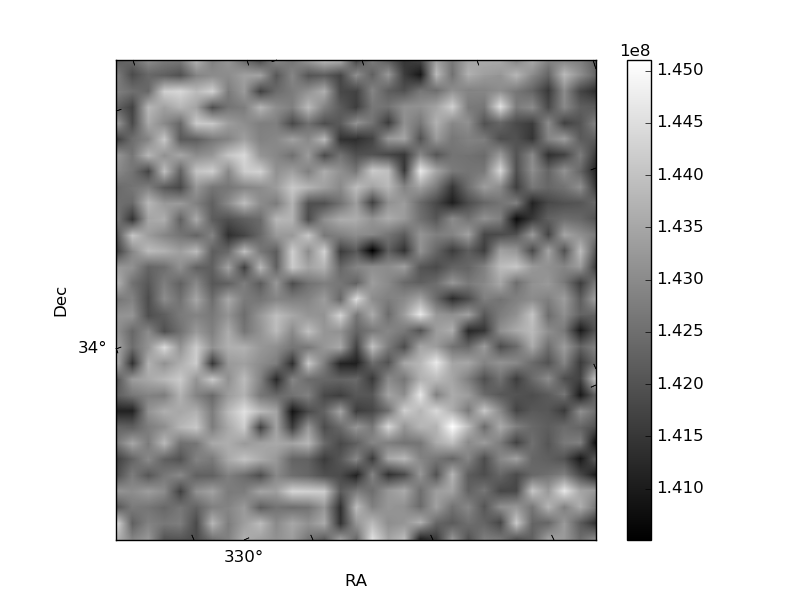
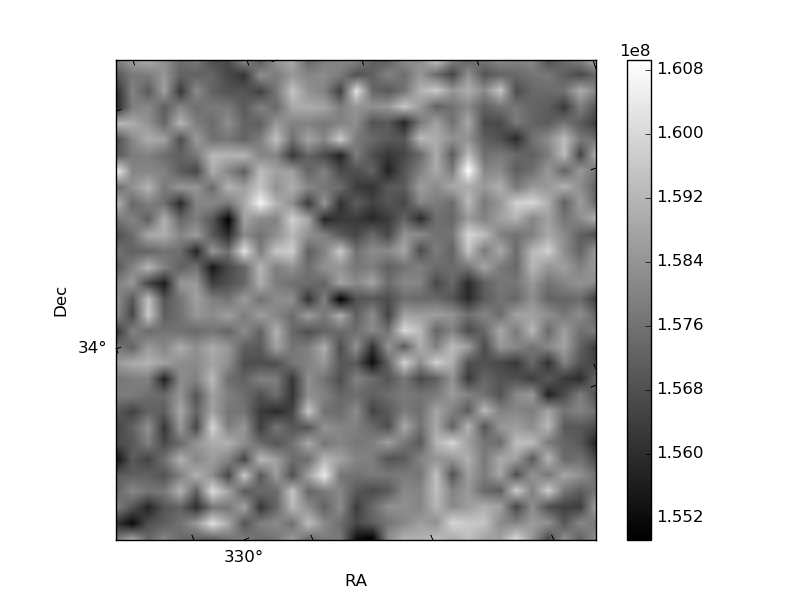
Quadrant B |
|---|---|---|---|
| Quadrant D | 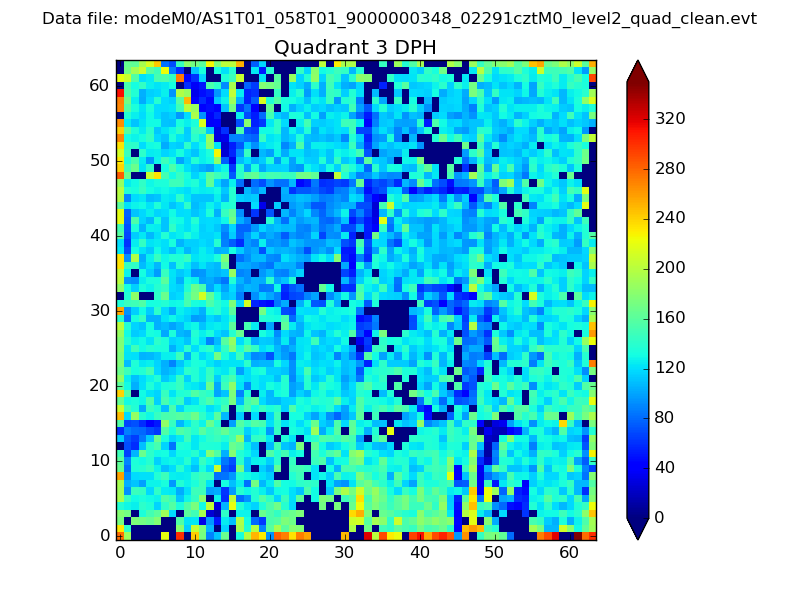 |
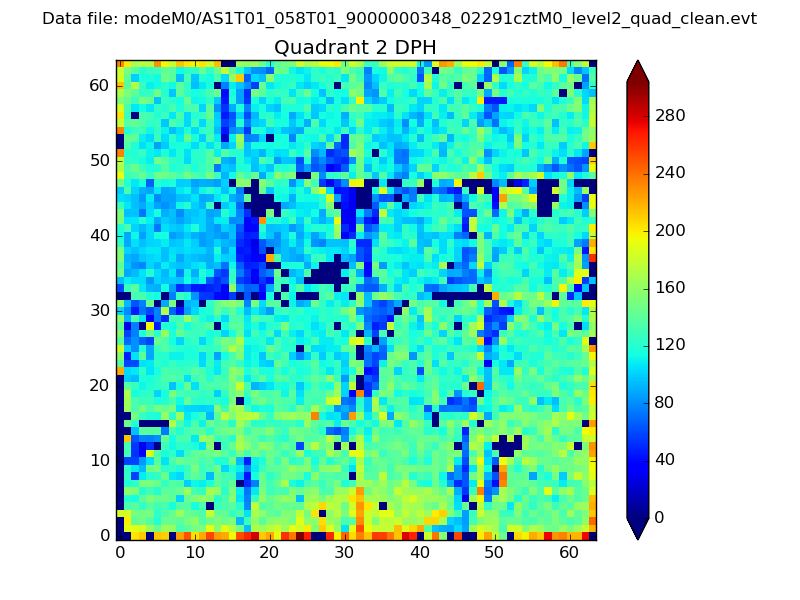 |
Quadrant C |
| Plot type | Count rate plots | Images |
|---|---|---|
| Comparison with Poisson distribution Blue bars denote a histogram of data divided into 1 sec bins. Red curve is a Poisson curve with rate = median count rate of data. |
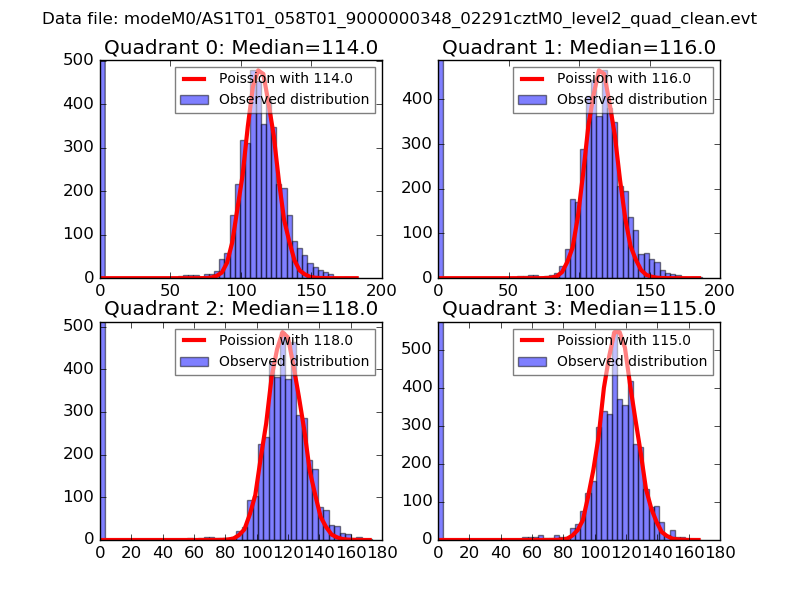 |
 |
| Quadrant-wise count rates Data is divided into 100 sec bins |
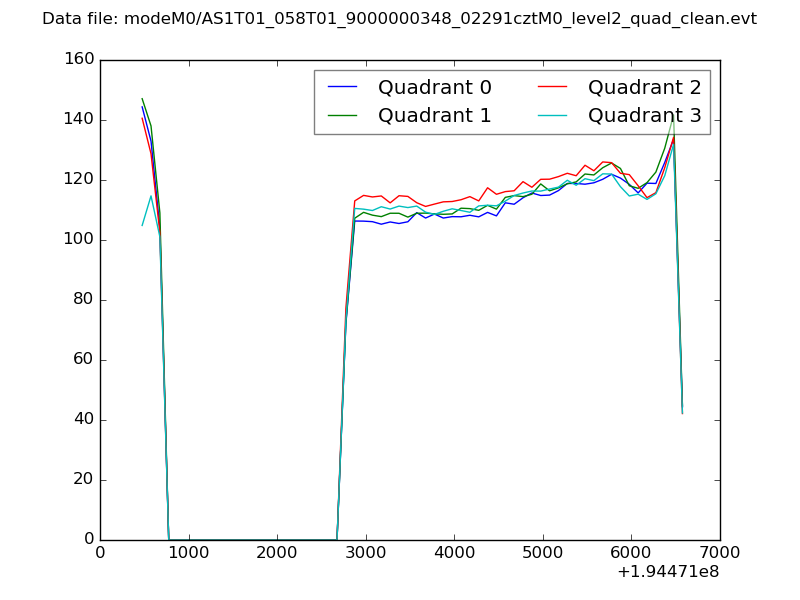 |
|
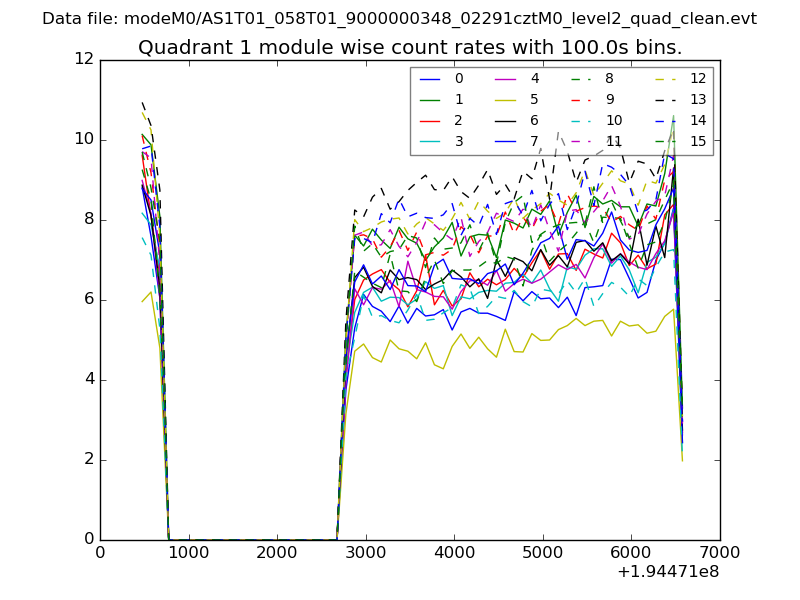
| Module-wise count rates for Quadrant A Data is divided into 100 sec bins |
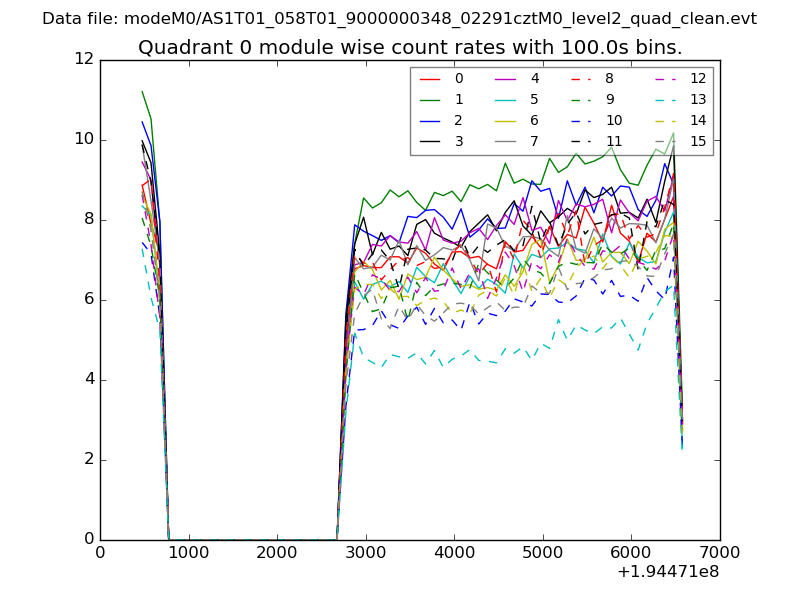 |
 |
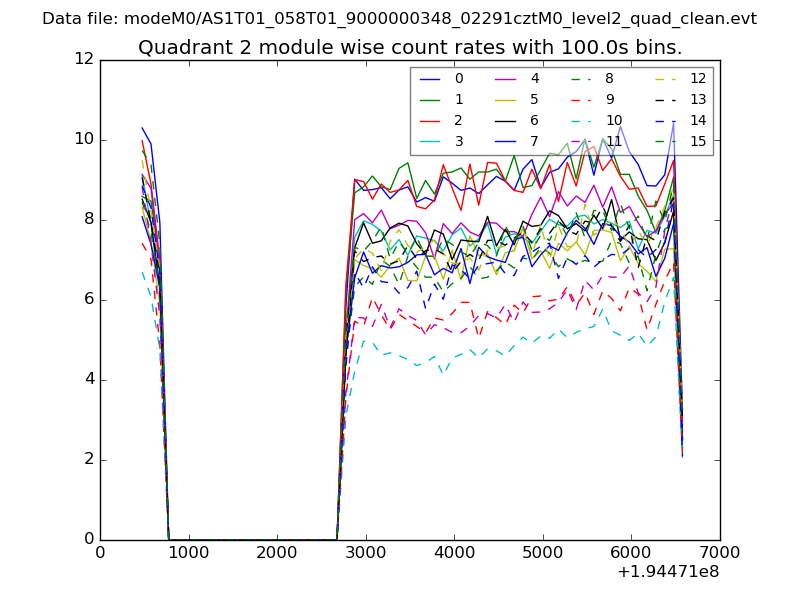
| Module-wise count rates for Quadrant B Data is divided into 100 sec bins |
 |
 |
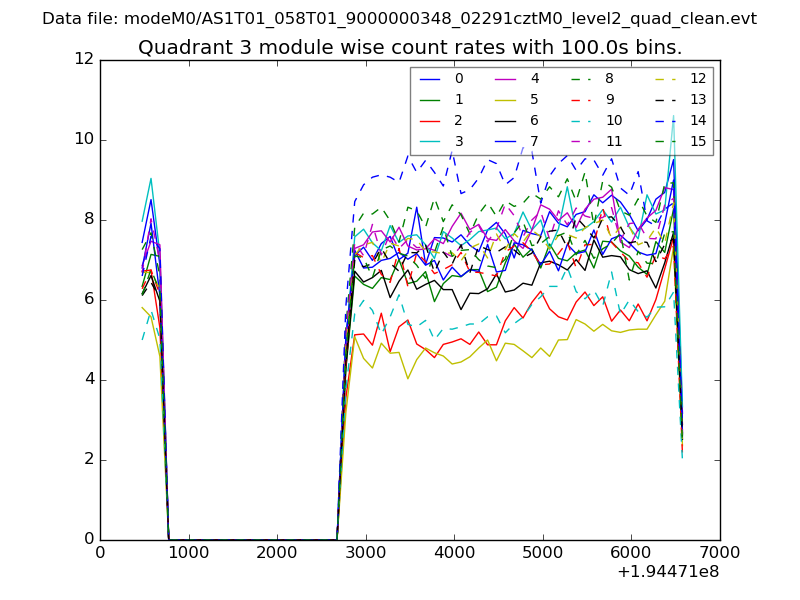
| Module-wise count rates for Quadrant C Data is divided into 100 sec bins |
 |
 |
| Module-wise count rates for Quadrant D Data is divided into 100 sec bins |
 |
 |
| Parameter | Plot |
|---|---|
| CZT HV Monitor | 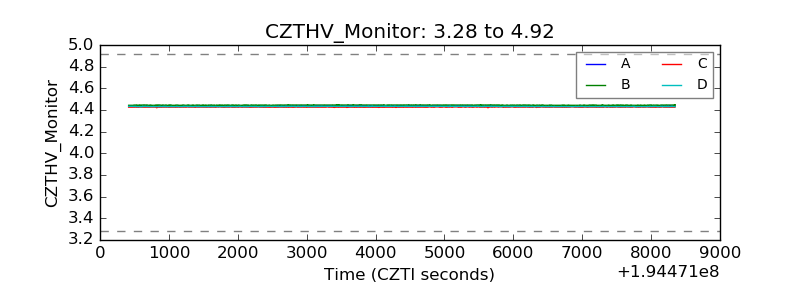 |
| D_VDD | 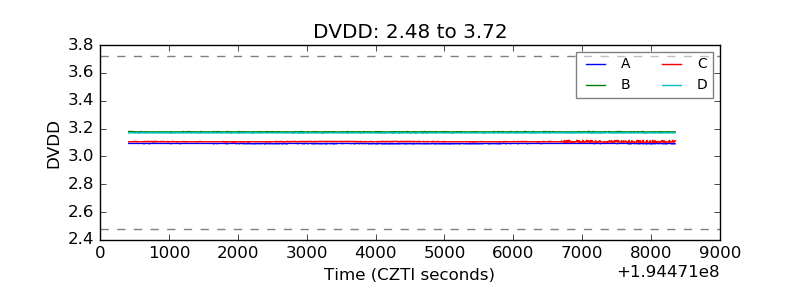 |
| Temperature 1 | 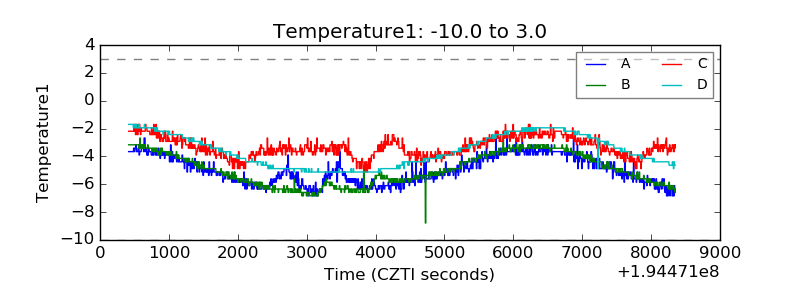 |
| Veto HV Monitor | 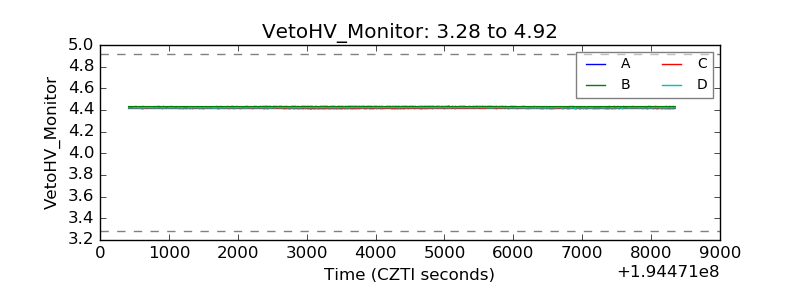 |
| Veto LLD | 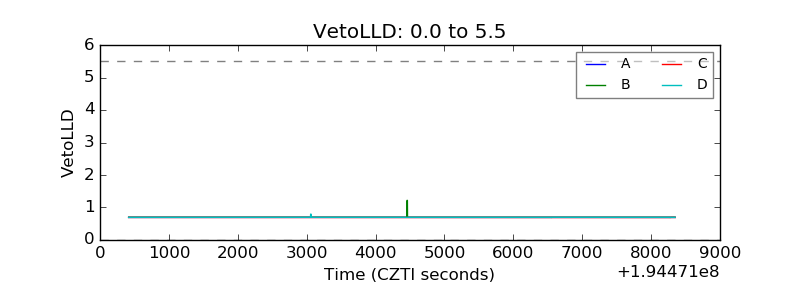 |
| Alpha Counter | 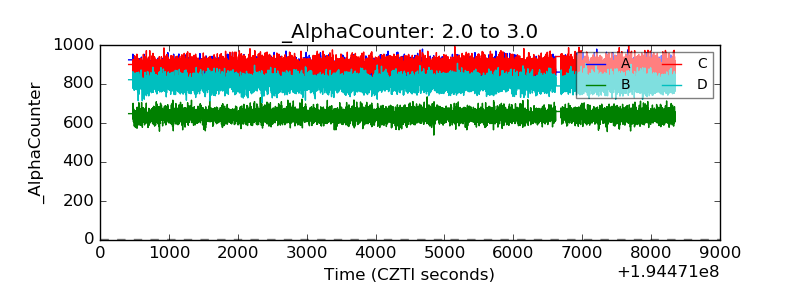 |
| _CPM_Rate | 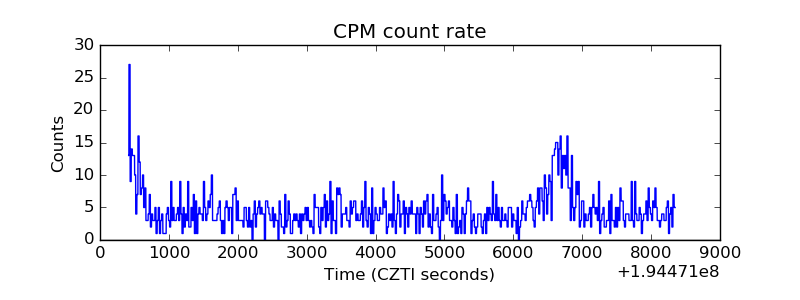 |
| CZT Counter | 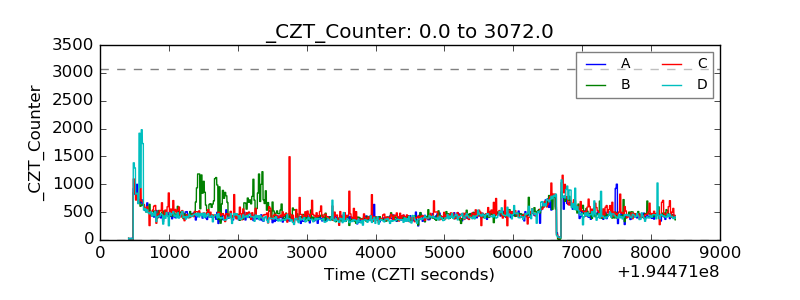 |
| +2.5 Volts monitor |  |
| +5 Volts monitor |  |
| _ROLL_ROT | 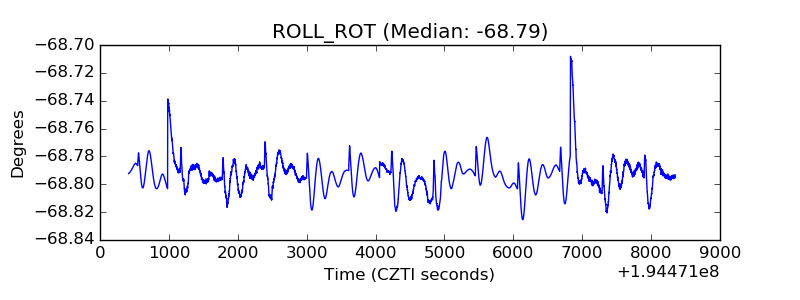 |
| _Roll_DEC | 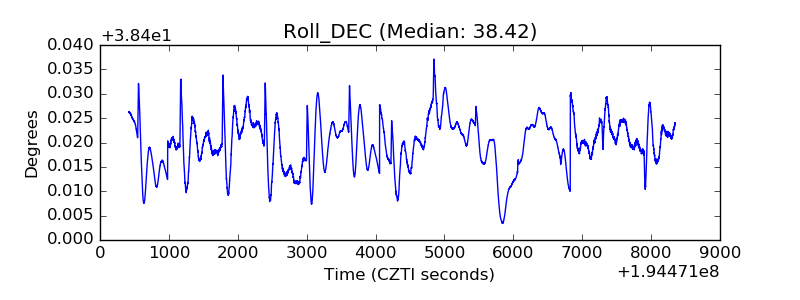 |
| _Roll_RA | 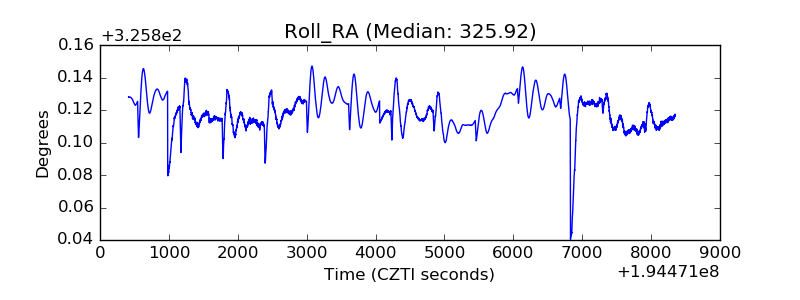 |
| Veto Counter | 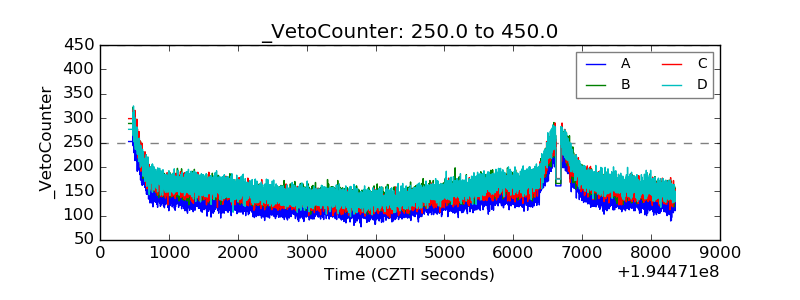 |