| Param | Original file | Final file |
|---|---|---|
| Filename | modeM0/AS1T01_058T01_9000000348_02293cztM0_level2.evt | modeM0/AS1T01_058T01_9000000348_02293cztM0_level2_quad_clean.evt |
| Size (bytes) | 508,158,720 | 87,166,080 |
| Size | 484.6 MB | 83.1 MB |
| Events in quadrant A | 3,604,964 | 508,575 |
| Events in quadrant B | 3,740,501 | 517,564 |
| Events in quadrant C | 3,958,609 | 529,691 |
| Events in quadrant D | 3,531,885 | 517,483 |
| Mode M9 | |||
|---|---|---|---|
| Quadrant | BADHDUFLAG | Total packets | Discarded packets |
| A | 0 | 6 | 0 |
| B | 0 | 6 | 0 |
| C | 0 | 6 | 0 |
| D | 0 | 6 | 0 |
| Mode SS | |||
|---|---|---|---|
| Quadrant | BADHDUFLAG | Total packets | Discarded packets |
| A | 0 | 166 | 0 |
| B | 0 | 166 | 0 |
| C | 0 | 166 | 0 |
| D | 0 | 166 | 0 |
| Mode M0 | |||
|---|---|---|---|
| Quadrant | BADHDUFLAG | Total packets | Discarded packets |
| A | 0 | 16755 | 5 |
| B | 0 | 16913 | 3 |
| C | 0 | 17321 | 2 |
| D | 0 | 16739 | 5 |
| Quadrant | Total seconds | Saturated seconds | Saturation percentage |
|---|---|---|---|
| A | 8150 | 92 | 1.128834% |
| B | 8150 | 134 | 1.644172% |
| C | 8150 | 74 | 0.907975% |
| D | 8149 | 36 | 0.441772% |
Noise dominated data is calculated using 1-second bins in cleaned event files. If a bin has >2000 counts, and if more than 50% of those come from <1% of pixels, then it is considered to be noise-dominated and hence unusable.
| Quadrant | # 1 sec bins | Bins with >0 counts | Bins with >2000 counts | High rate bins dominated by noise | Noise dominated (total time) | Noise dominated (detector-on time) | Marked lightcurve |
|---|---|---|---|---|---|---|---|
| A | 8714 | 8150 | 0 | 0 | 0.00% | 0.00% | 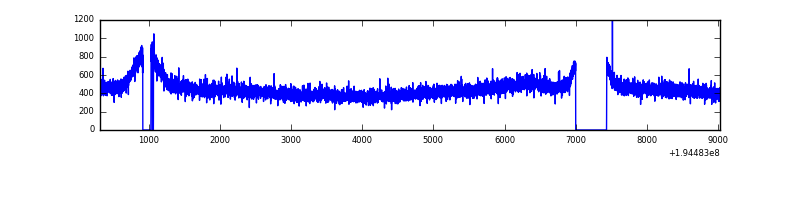 |
| B | 8714 | 8151 | 5 | 5 | 0.06% | 0.06% | 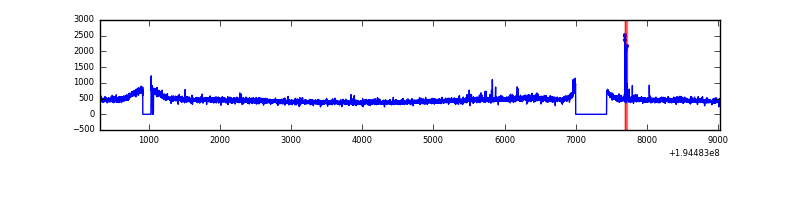 |
| C | 8715 | 8151 | 3 | 3 | 0.03% | 0.04% | 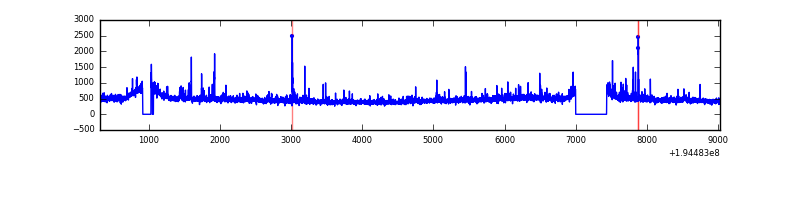 |
| D | 8715 | 8152 | 2 | 2 | 0.02% | 0.02% | 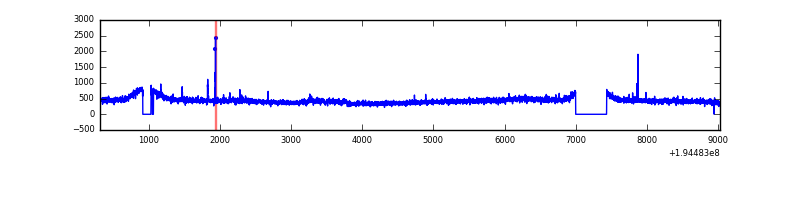 |
Top three noisy pixels from each quadrant. If the there are fewer than three noisy pixels in the level2.evt file, extra rows are filled as -1
| Pixel properties | Quadrant properties | ||||||
|---|---|---|---|---|---|---|---|
| Quadrant | DetID | PixID | Counts | Sigma | Mean | Median | Sigma |
| A | 12 | 194 | 10478 | 49.61 | 936 | 913 | 192.8 |
| A | 0 | 226 | 9973 | 46.99 | 936 | 913 | 192.8 |
| A | 12 | 133 | 3122 | 11.46 | 936 | 913 | 192.8 |
| B | 4 | 48 | 32548 | 173.15 | 947 | 922 | 182.6 |
| B | 15 | 85 | 29206 | 154.85 | 947 | 922 | 182.6 |
| B | 7 | 205 | 21144 | 110.71 | 947 | 922 | 182.6 |
| C | 5 | 234 | 264377 | 1215.16 | 924 | 927 | 216.8 |
| C | 8 | 112 | 33099 | 148.39 | 924 | 927 | 216.8 |
| C | 8 | 128 | 14783 | 63.91 | 924 | 927 | 216.8 |
| D | 1 | 20 | 40520 | 183.09 | 914 | 889 | 216.5 |
| D | 15 | 194 | 16956 | 74.23 | 914 | 889 | 216.5 |
| D | 9 | 66 | 12406 | 53.21 | 914 | 889 | 216.5 |
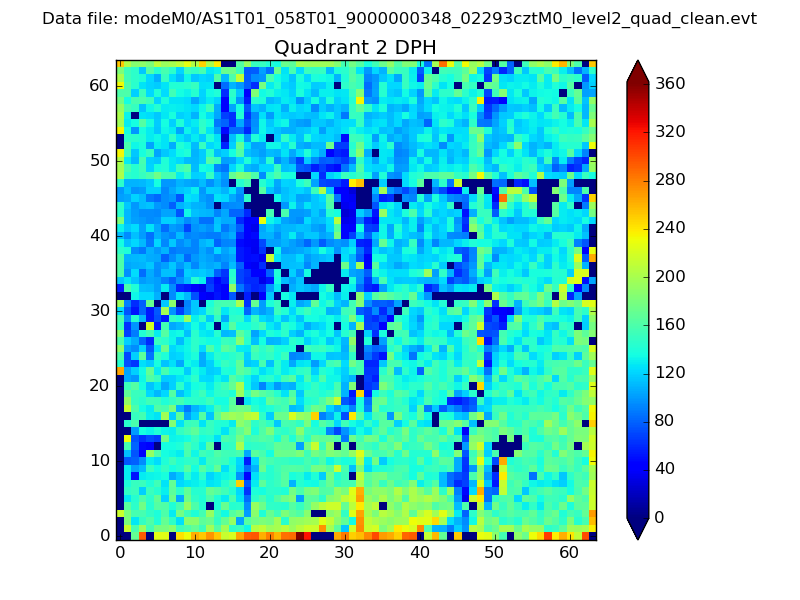
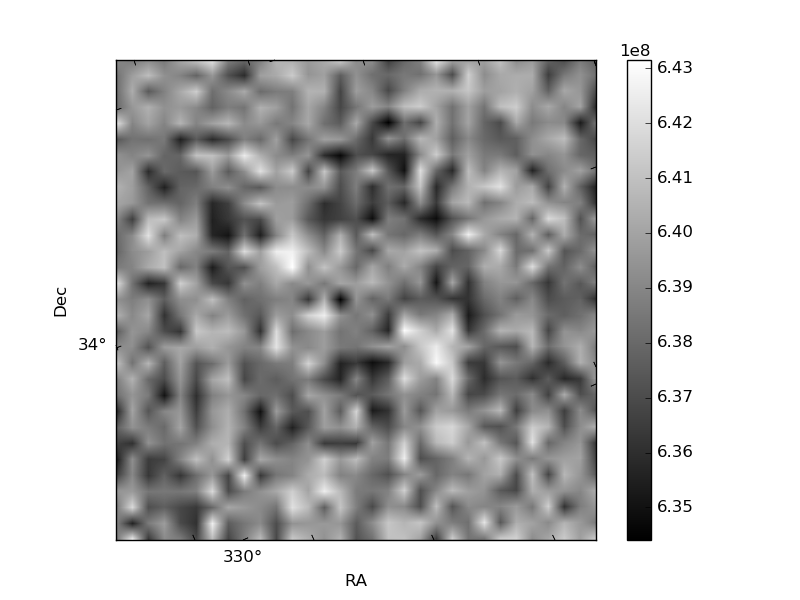
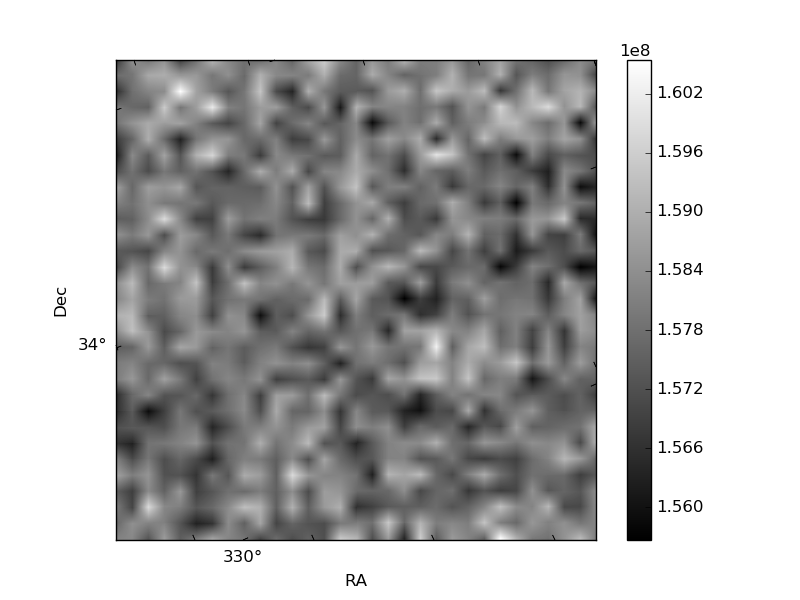
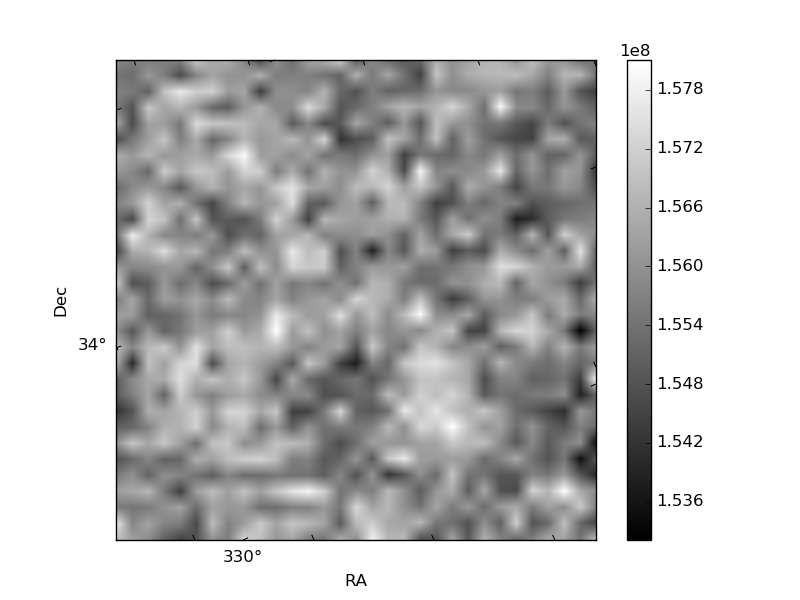
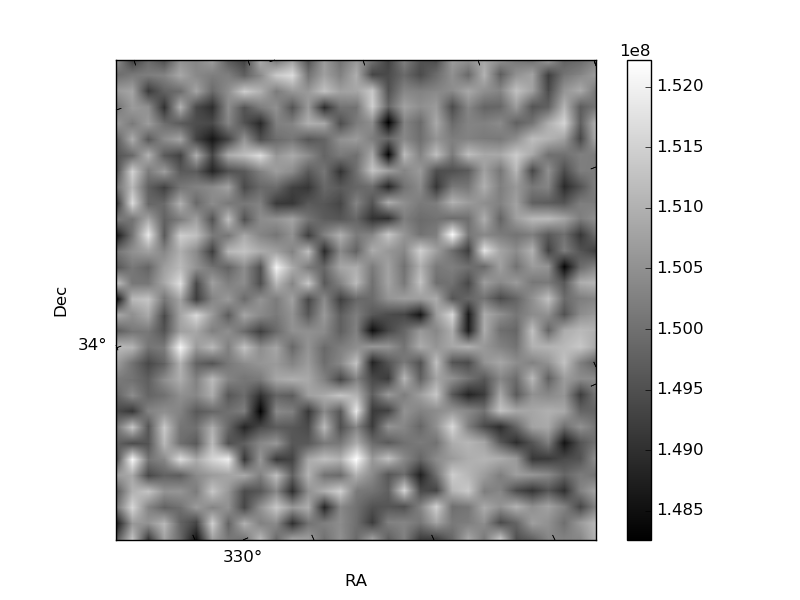
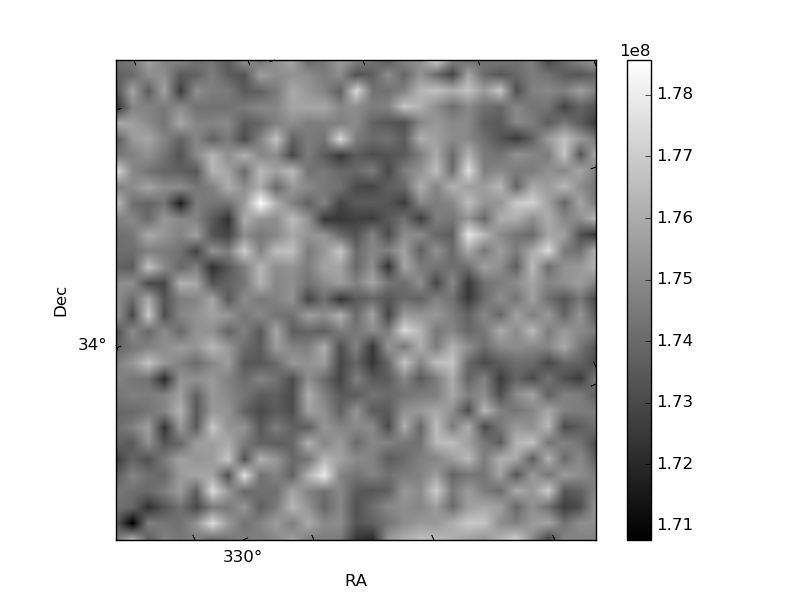
Histogram calculated using DETX and DETY for each event in the final _common_clean file
| Quadrant A | 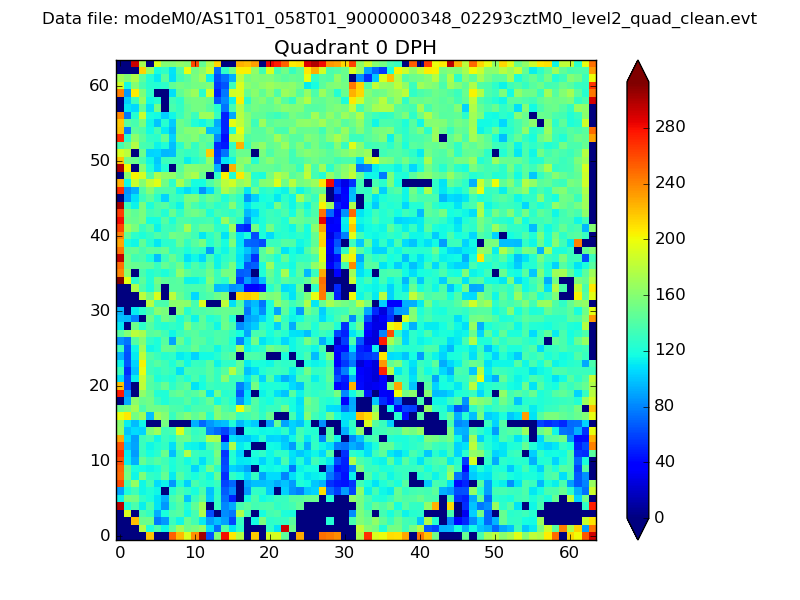 |
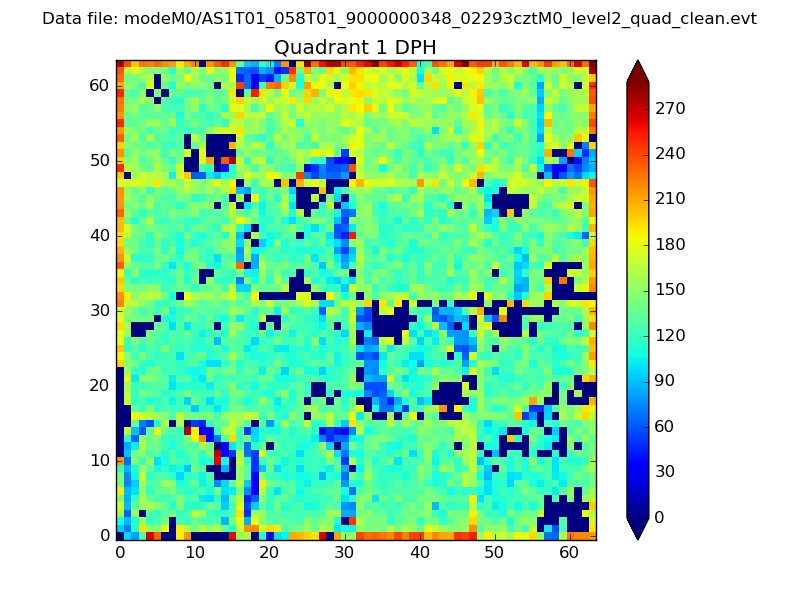 |
Quadrant B |
|---|---|---|---|
| Quadrant D | 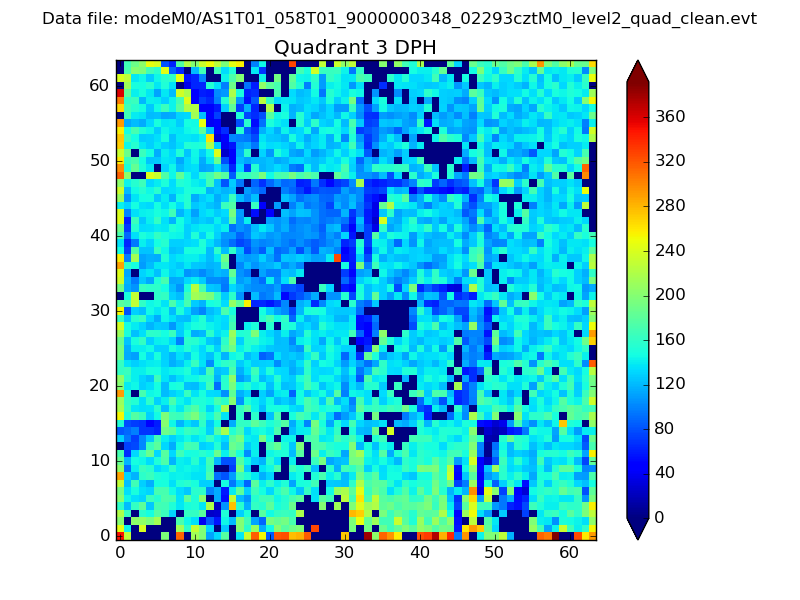 |
 |
Quadrant C |
| Plot type | Count rate plots | Images |
|---|---|---|
| Comparison with Poisson distribution Blue bars denote a histogram of data divided into 1 sec bins. Red curve is a Poisson curve with rate = median count rate of data. |
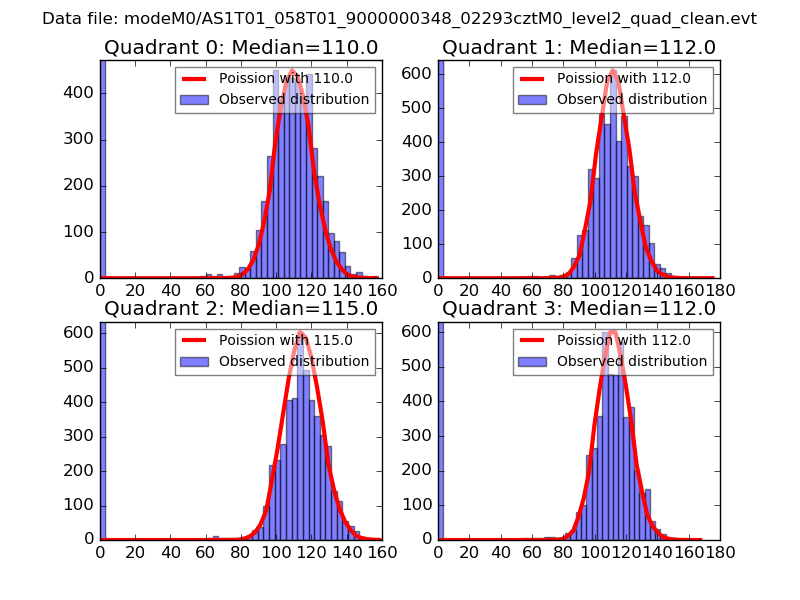 |
 |
| Quadrant-wise count rates Data is divided into 100 sec bins |
 |
|
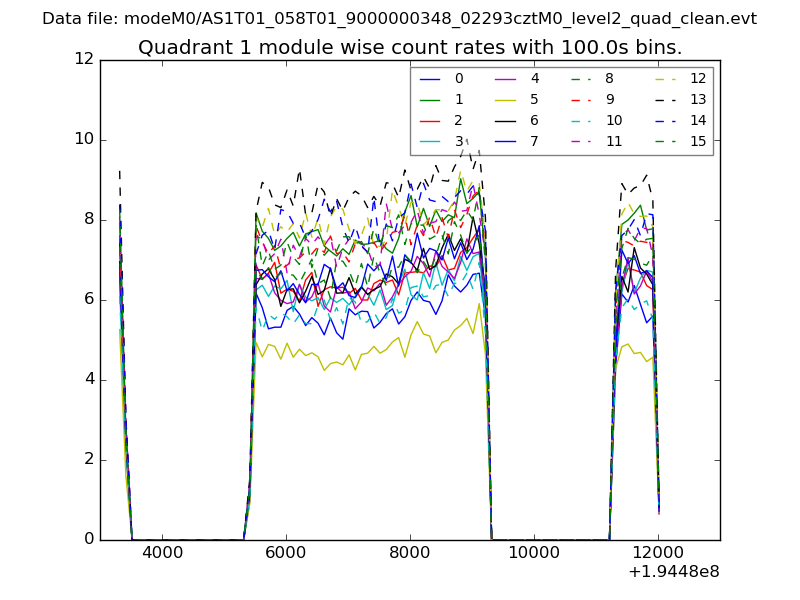
| Module-wise count rates for Quadrant A Data is divided into 100 sec bins |
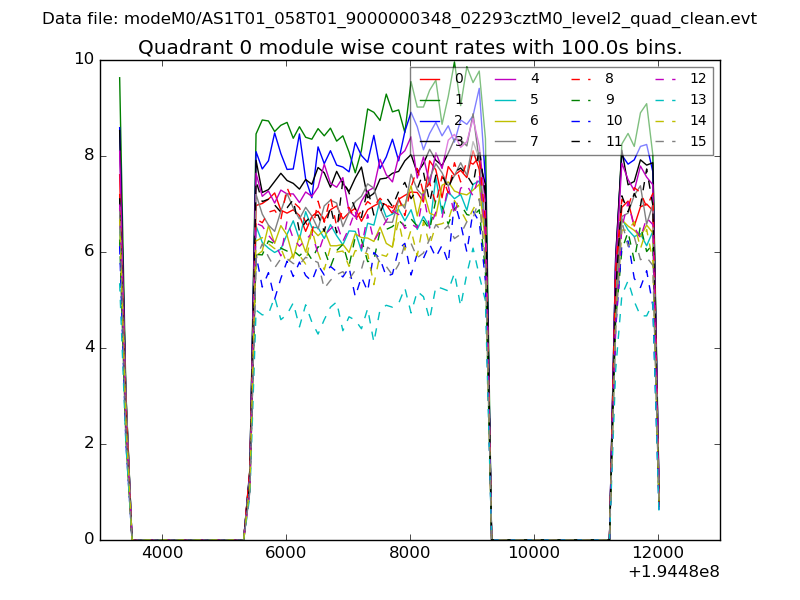 |
 |
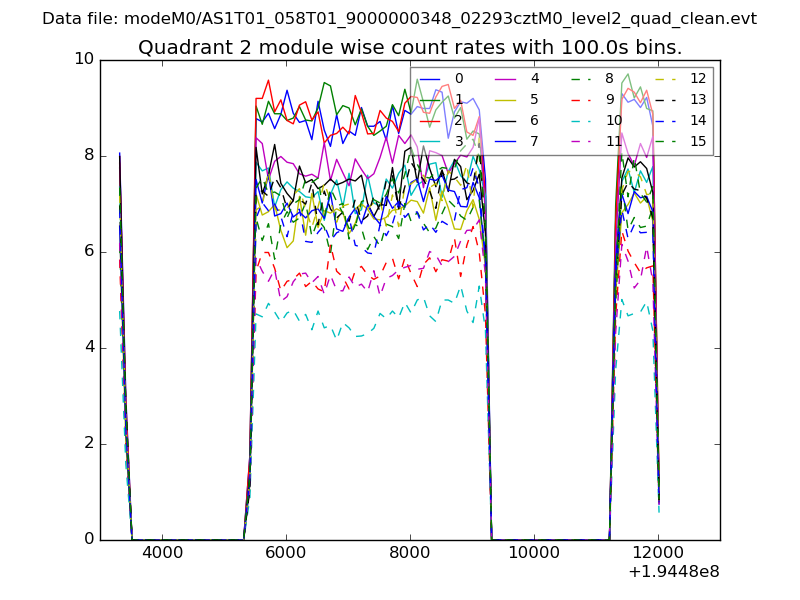
| Module-wise count rates for Quadrant B Data is divided into 100 sec bins |
 |
 |
| Module-wise count rates for Quadrant C Data is divided into 100 sec bins |
 |
 |
| Module-wise count rates for Quadrant D Data is divided into 100 sec bins |
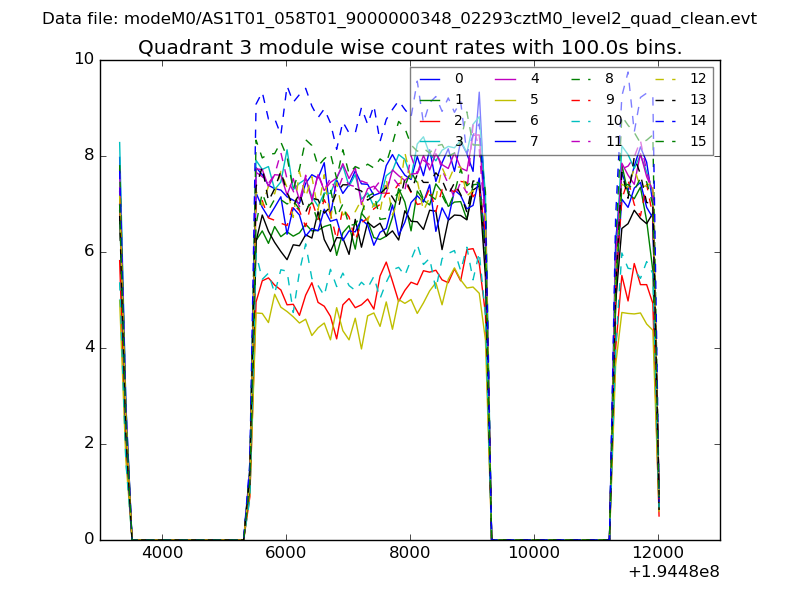 |
 |
| Parameter | Plot |
|---|---|
| CZT HV Monitor | 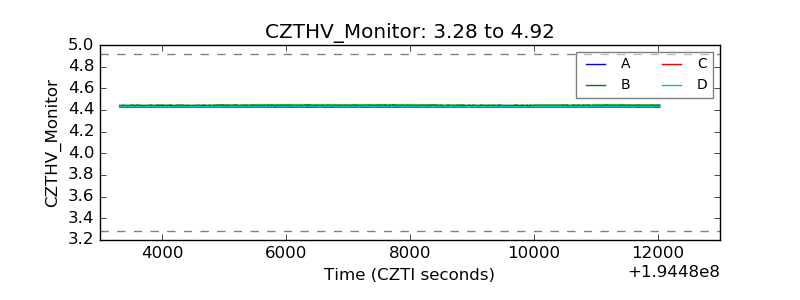 |
| D_VDD | 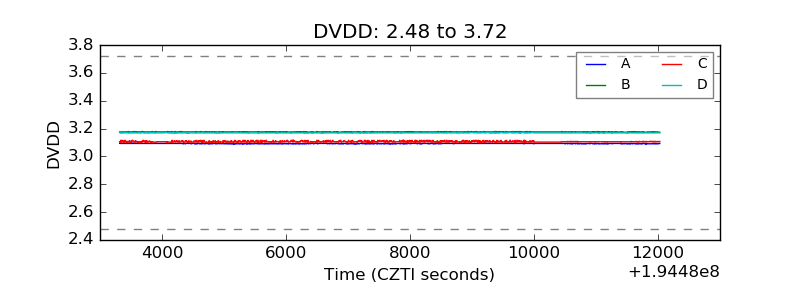 |
| Temperature 1 | 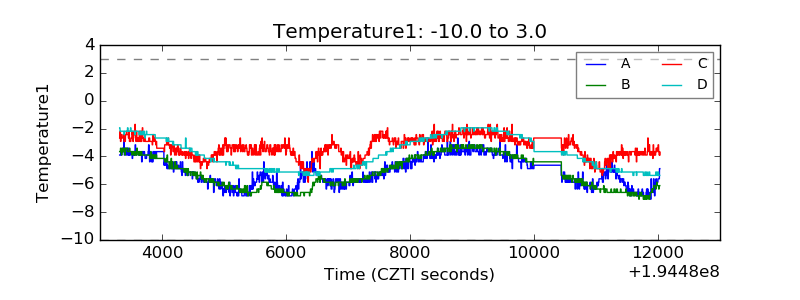 |
| Veto HV Monitor | 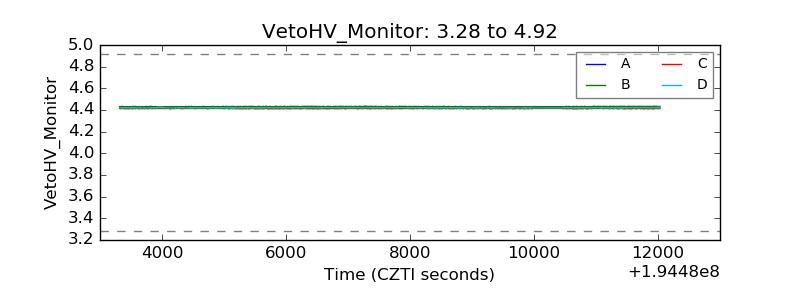 |
| Veto LLD | 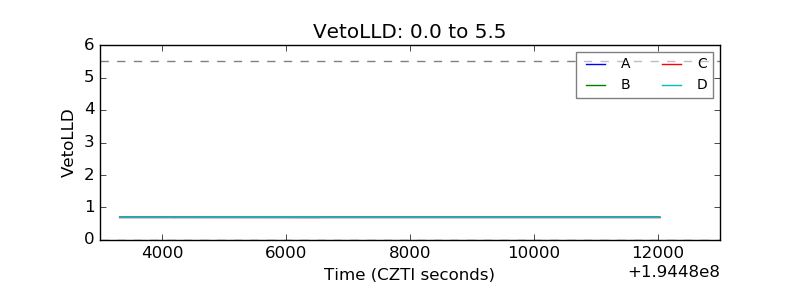 |
| Alpha Counter | 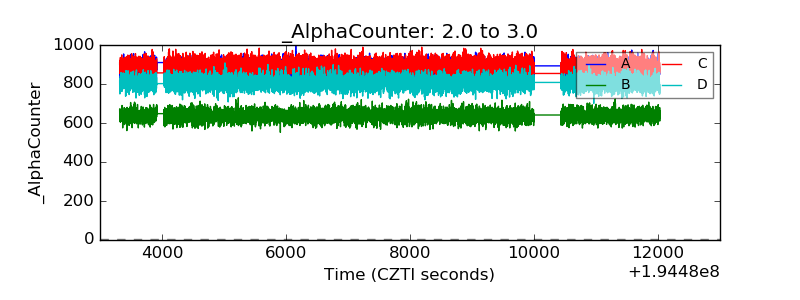 |
| _CPM_Rate | 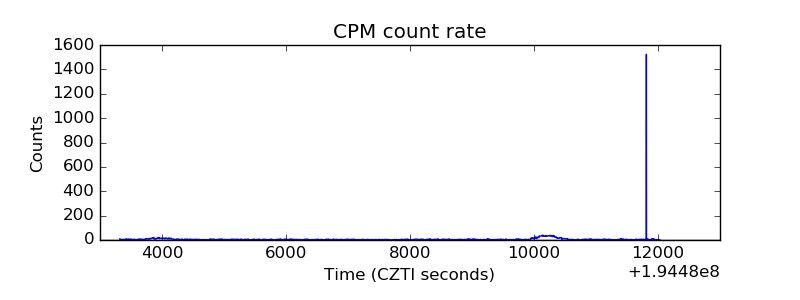 |
| CZT Counter | 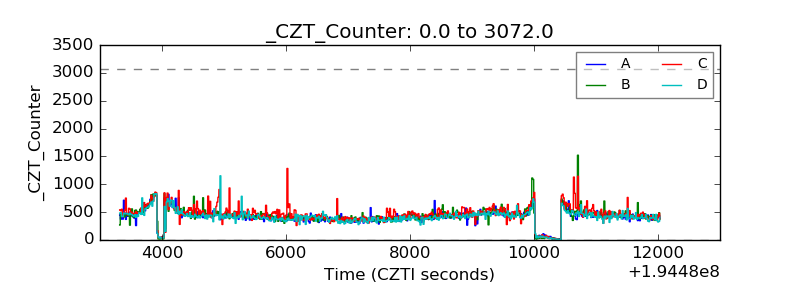 |
| +2.5 Volts monitor |  |
| +5 Volts monitor |  |
| _ROLL_ROT | 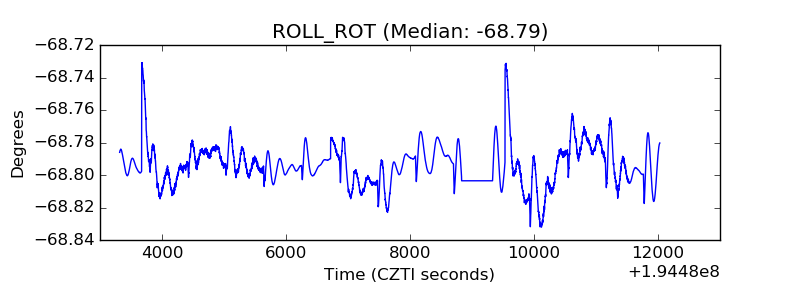 |
| _Roll_DEC | 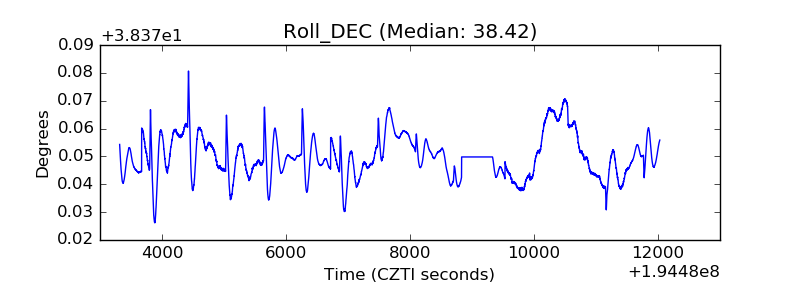 |
| _Roll_RA | 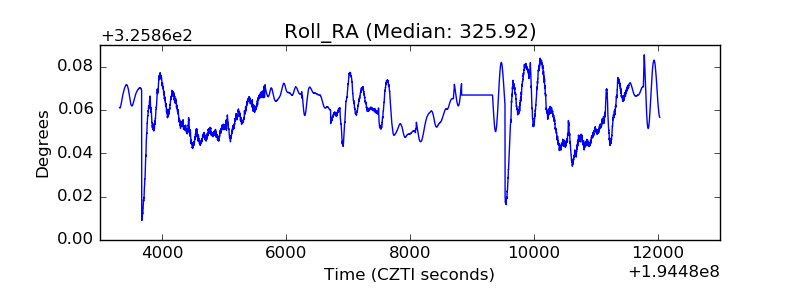 |
| Veto Counter | 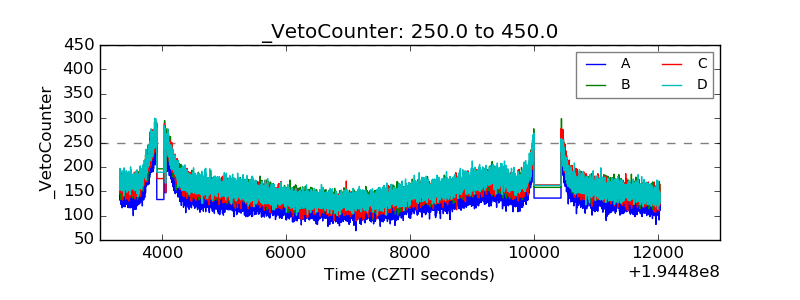 |