| Param | Original file | Final file |
|---|---|---|
| Filename | modeM0/AS1T01_058T01_9000000348_02295cztM0_level2.evt | modeM0/AS1T01_058T01_9000000348_02295cztM0_level2_quad_clean.evt |
| Size (bytes) | 8,801,280 | 2,615,040 |
| Size | 8.4 MB | 2.5 MB |
| Events in quadrant A | 78,691 | 17,034 |
| Events in quadrant B | 83,668 | 21,552 |
| Events in quadrant C | 7,686 | 680 |
| Events in quadrant D | 80,058 | 18,264 |
| Mode M9 | |||
|---|---|---|---|
| Quadrant | BADHDUFLAG | Total packets | Discarded packets |
| A | 1 | 273359709408 | 0 |
| B | 1 | -1 | -1 |
| C | 1 | -1 | -1 |
| D | 1 | -1 | -1 |
| Mode SS | |||
|---|---|---|---|
| Quadrant | BADHDUFLAG | Total packets | Discarded packets |
| A | 0 | 273359709408 | 0 |
| B | 0 | -1 | -1 |
| C | 0 | -1 | -1 |
| D | 0 | -1 | -1 |
| Mode M0 | |||
|---|---|---|---|
| Quadrant | BADHDUFLAG | Total packets | Discarded packets |
| A | 0 | 6474 | 6117 |
| B | 0 | 6547 | 6193 |
| C | 0 | 7126 | 7094 |
| D | 0 | 6482 | 6108 |
| Quadrant | Total seconds | Saturated seconds | Saturation percentage |
|---|---|---|---|
| A | 181 | 0 | 0.000000% |
| B | 179 | 1 | 0.558659% |
| C | 17 | 0 | 0.000000% |
| D | 191 | 1 | 0.523560% |
Noise dominated data is calculated using 1-second bins in cleaned event files. If a bin has >2000 counts, and if more than 50% of those come from <1% of pixels, then it is considered to be noise-dominated and hence unusable.
| Quadrant | # 1 sec bins | Bins with >0 counts | Bins with >2000 counts | High rate bins dominated by noise | Noise dominated (total time) | Noise dominated (detector-on time) | Marked lightcurve |
|---|---|---|---|---|---|---|---|
| A | 6876 | 330 | 0 | 0 | 0.00% | 0.00% | 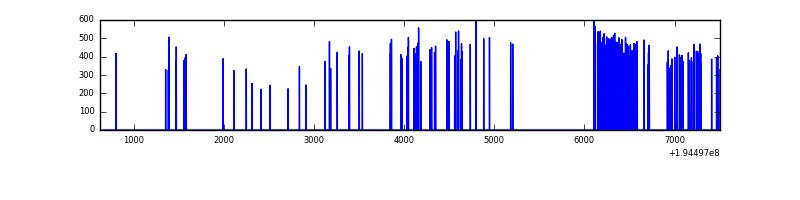 |
| B | 6876 | 324 | 0 | 0 | 0.00% | 0.00% | 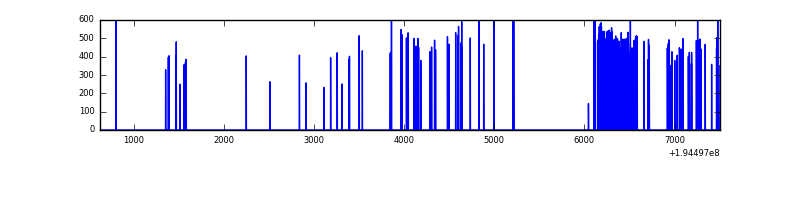 |
| C | 4415 | 25 | 0 | 0 | 0.00% | 0.00% | 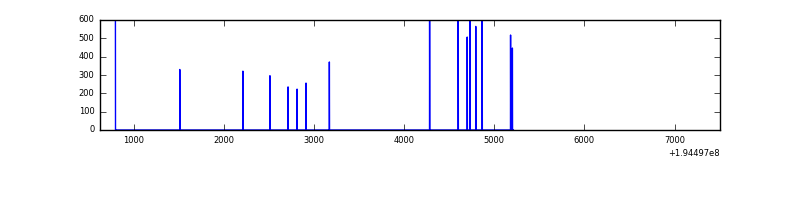 |
| D | 6875 | 346 | 0 | 0 | 0.00% | 0.00% | 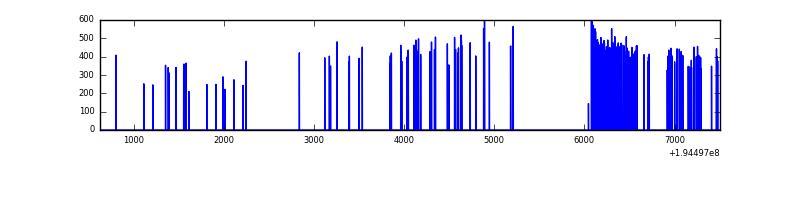 |
Top three noisy pixels from each quadrant. If the there are fewer than three noisy pixels in the level2.evt file, extra rows are filled as -1
| Pixel properties | Quadrant properties | ||||||
|---|---|---|---|---|---|---|---|
| Quadrant | DetID | PixID | Counts | Sigma | Mean | Median | Sigma |
| A | 12 | 194 | 242 | 36.84 | 20 | 19 | 6.1 |
| A | 0 | 226 | 228 | 34.53 | 20 | 19 | 6.1 |
| A | 14 | 188 | 56 | 6.11 | 20 | 19 | 6.1 |
| B | 4 | 48 | 1323 | 211.24 | 21 | 20 | 6.2 |
| B | 8 | 3 | 1000 | 158.88 | 21 | 20 | 6.2 |
| B | 12 | 111 | 305 | 46.2 | 21 | 20 | 6.2 |
| C | 5 | 234 | 850 | 798.52 | 1 | 1 | 1.1 |
| C | 10 | 82 | 160 | 149.55 | 1 | 1 | 1.1 |
| C | 13 | 61 | 20 | 17.87 | 1 | 1 | 1.1 |
| D | 15 | 194 | 397 | 55.03 | 20 | 20 | 6.9 |
| D | 14 | 226 | 249 | 33.43 | 20 | 20 | 6.9 |
| D | 13 | 169 | 118 | 14.31 | 20 | 20 | 6.9 |
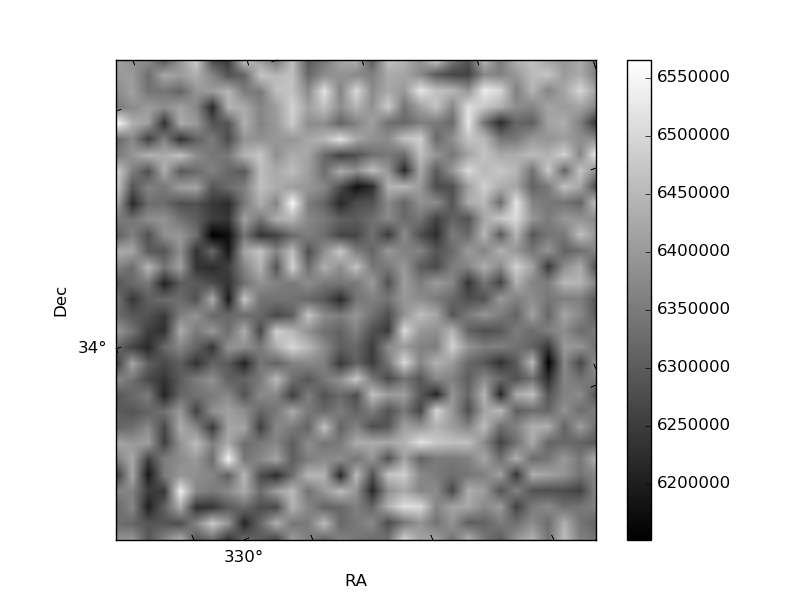
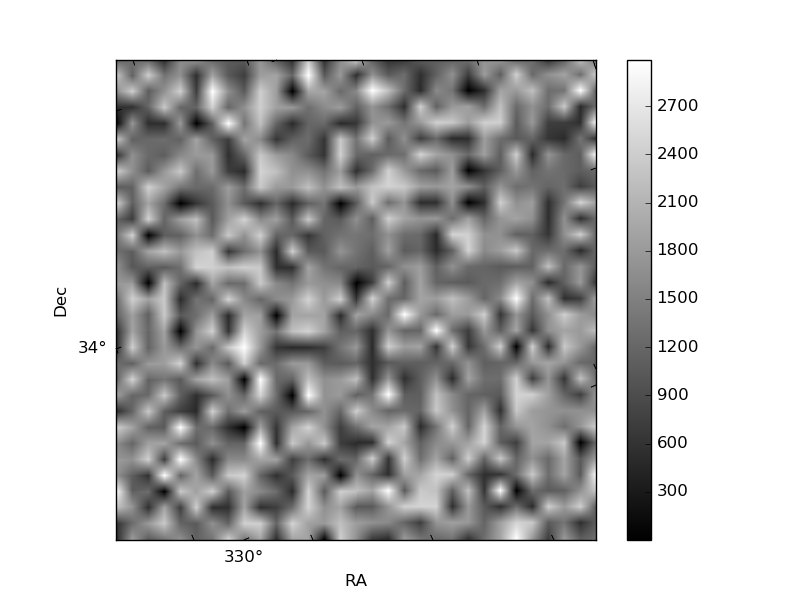
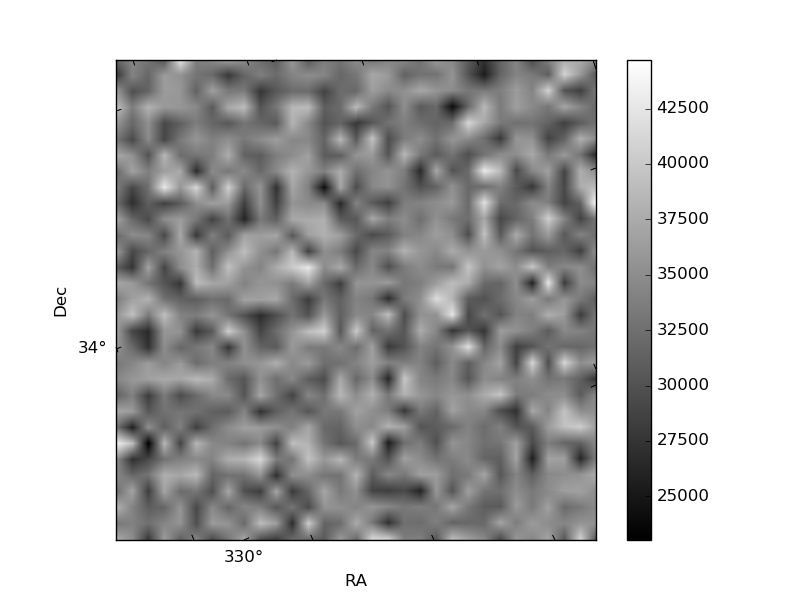
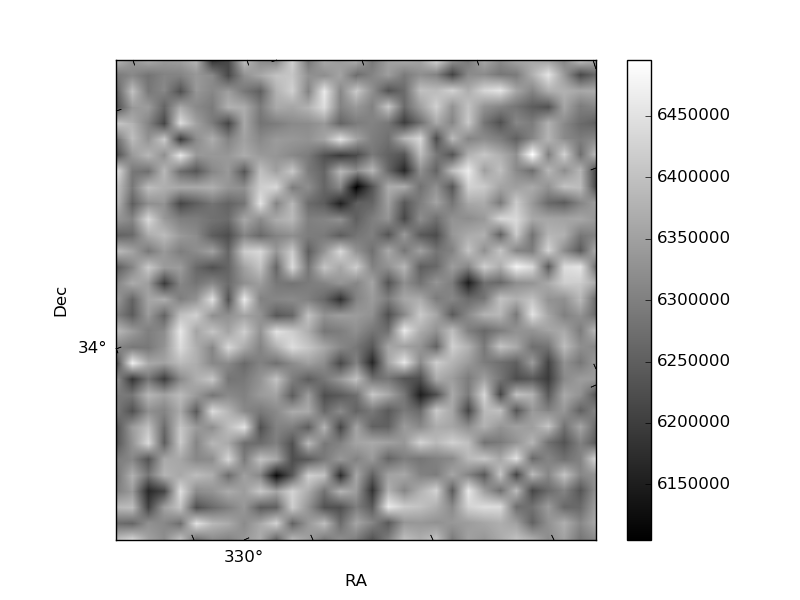
Histogram calculated using DETX and DETY for each event in the final _common_clean file
| Quadrant A | 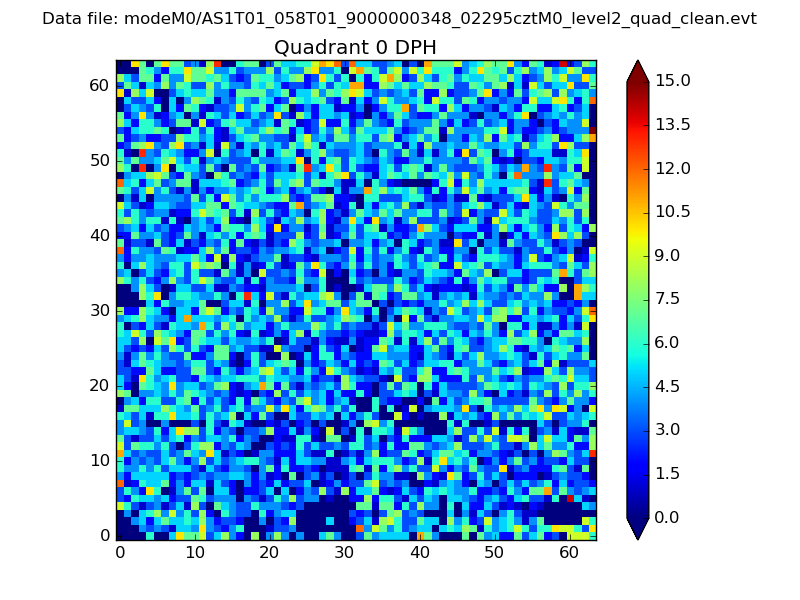 |
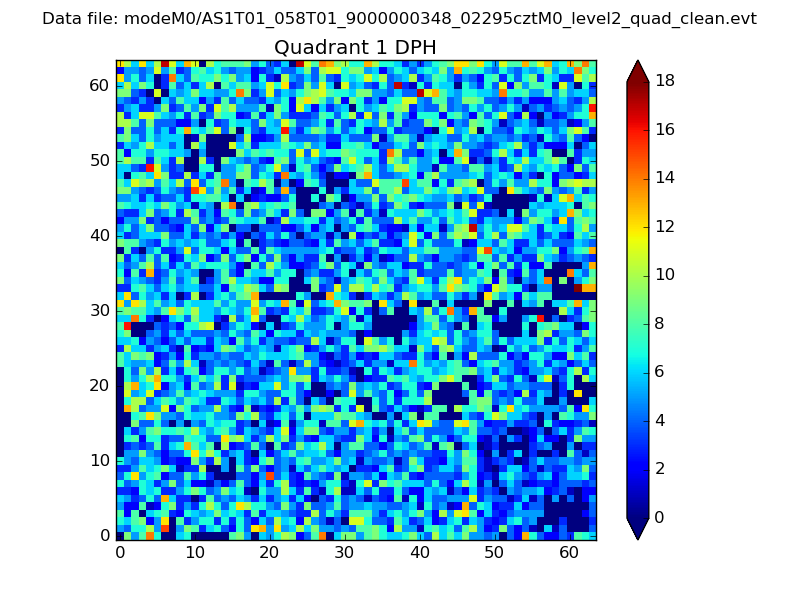 |
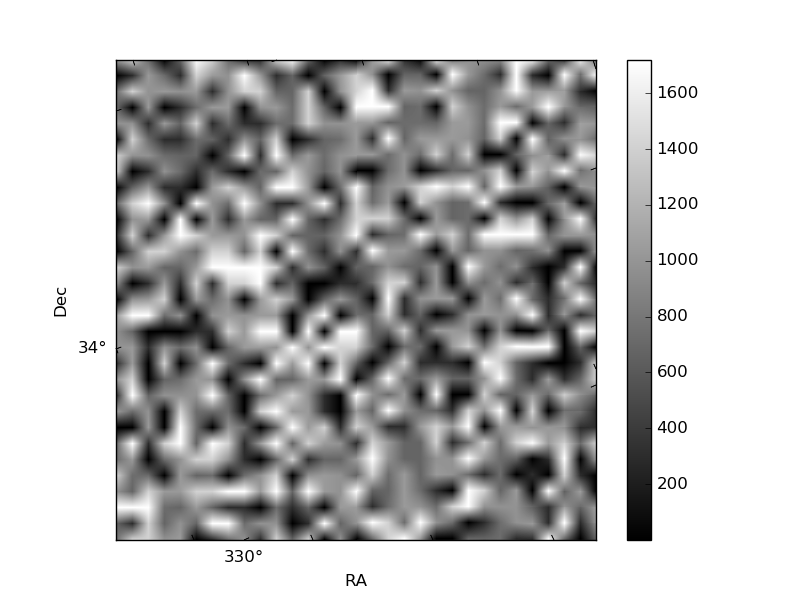
Quadrant B |
|---|---|---|---|
| Quadrant D | 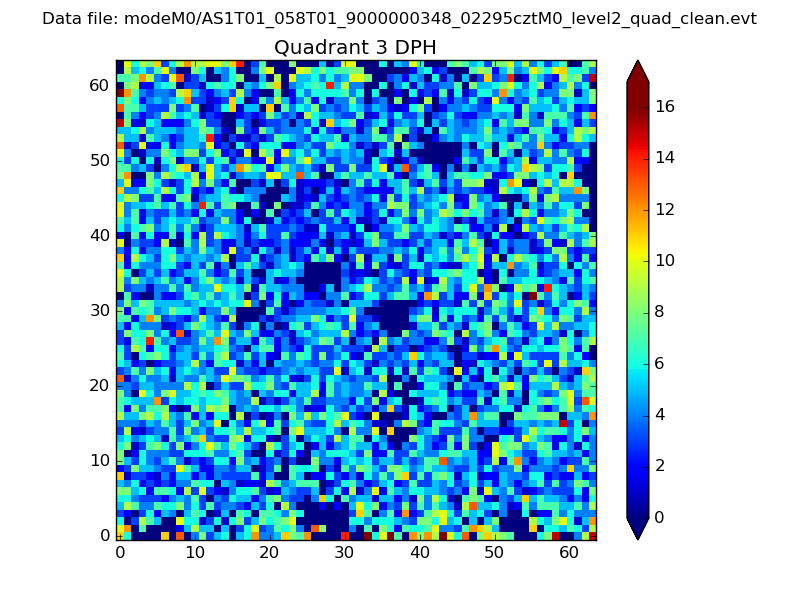 |
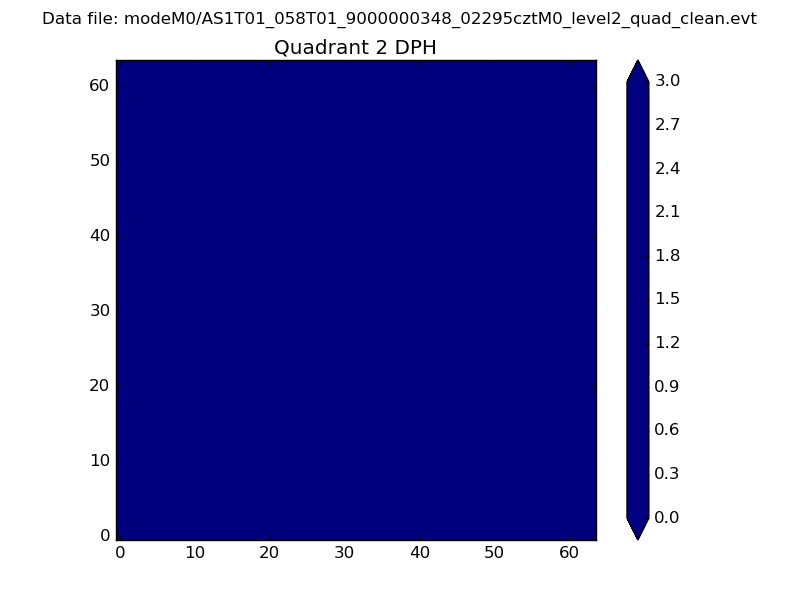 |
Quadrant C |
| Plot type | Count rate plots | Images |
|---|---|---|
| Comparison with Poisson distribution Blue bars denote a histogram of data divided into 1 sec bins. Red curve is a Poisson curve with rate = median count rate of data. |
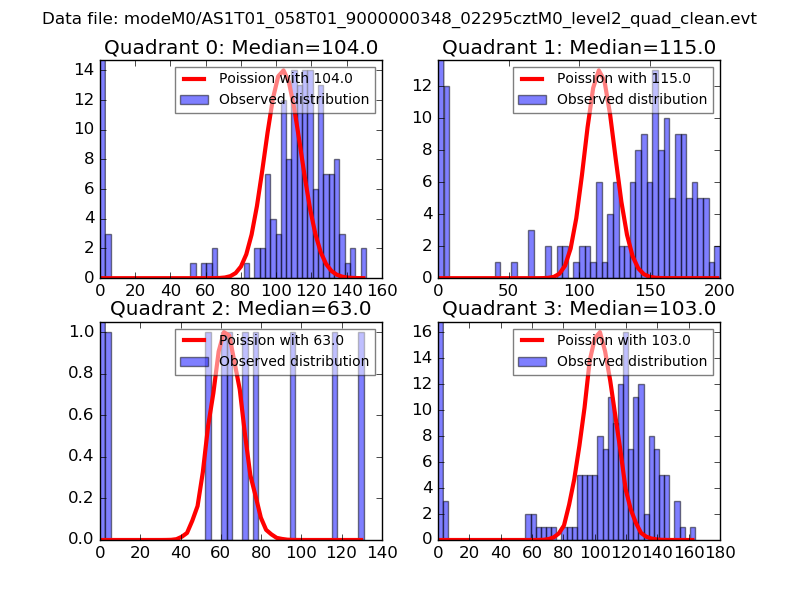 |
 |
| Quadrant-wise count rates Data is divided into 100 sec bins |
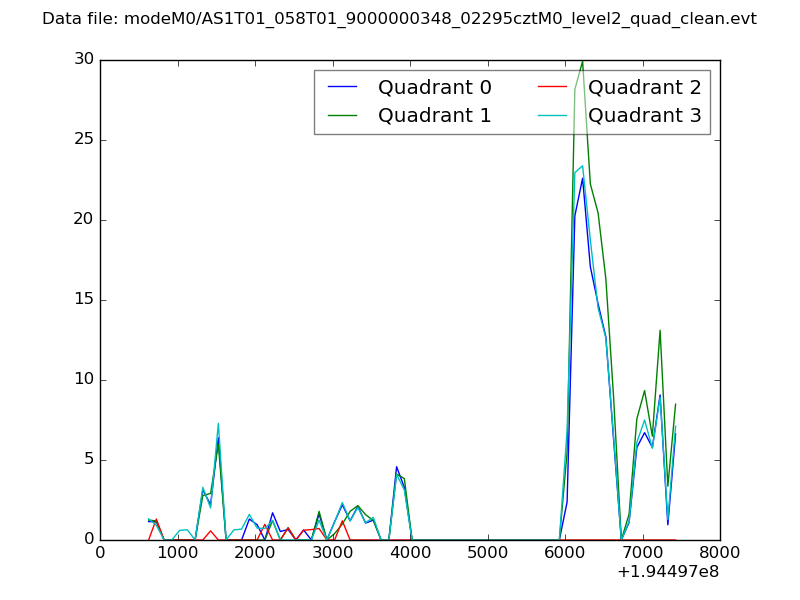 |
|
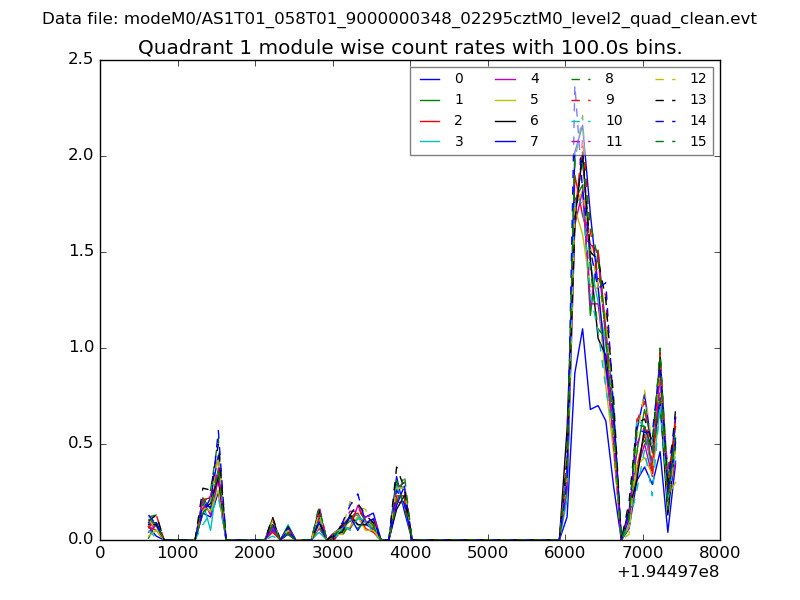
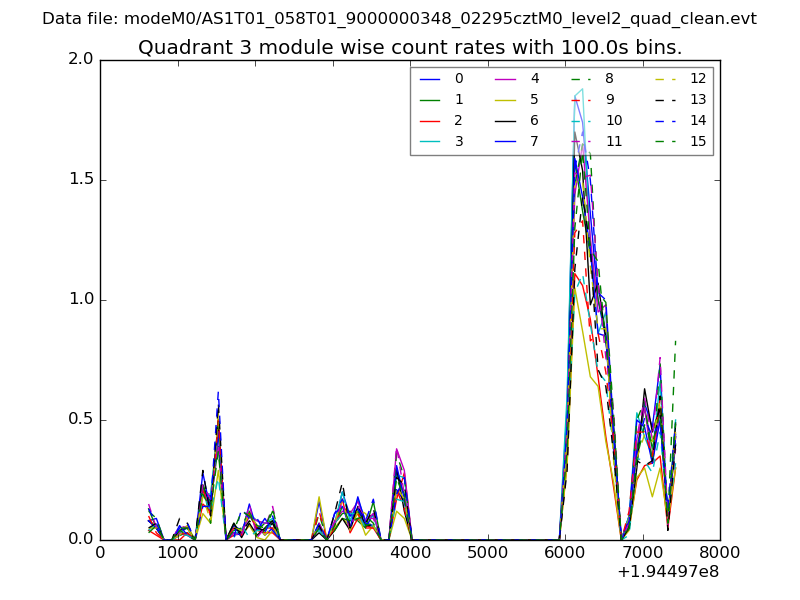
| Module-wise count rates for Quadrant A Data is divided into 100 sec bins |
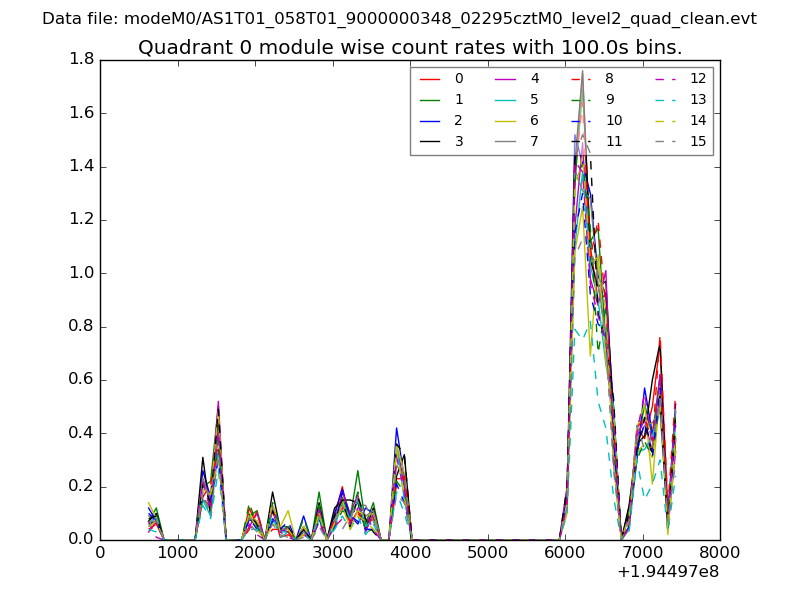 |
 |
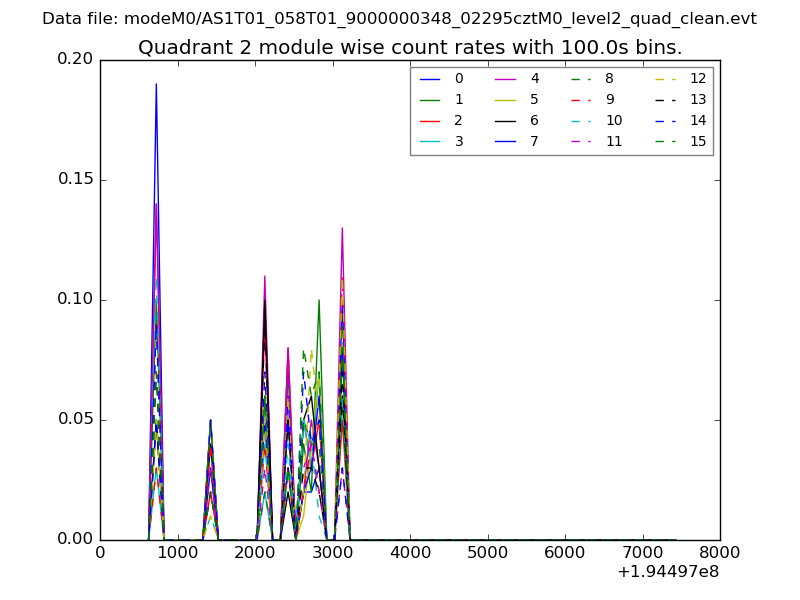
| Module-wise count rates for Quadrant B Data is divided into 100 sec bins |
 |
 |
| Module-wise count rates for Quadrant C Data is divided into 100 sec bins |
 |
 |
| Module-wise count rates for Quadrant D Data is divided into 100 sec bins |
 |
 |
| Parameter | Plot |
|---|---|
| CZT HV Monitor | 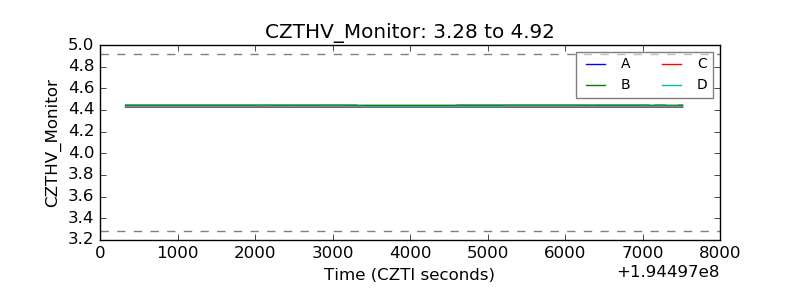 |
| D_VDD | 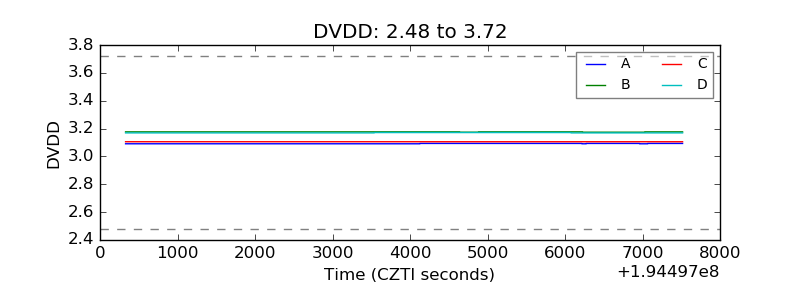 |
| Temperature 1 | 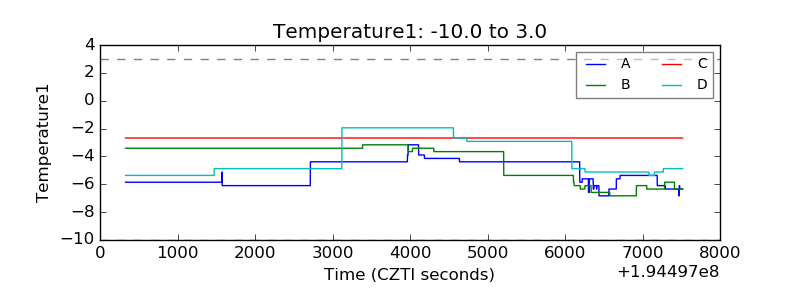 |
| Veto HV Monitor | 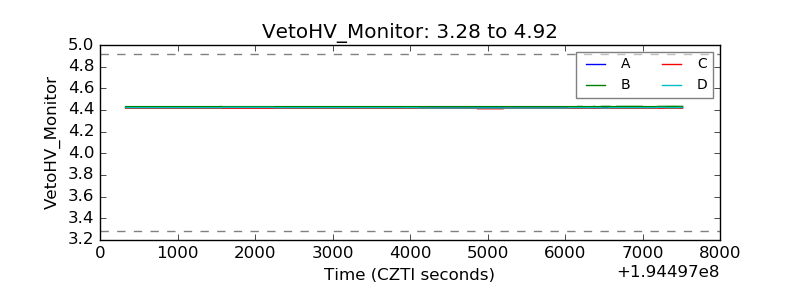 |
| Veto LLD | 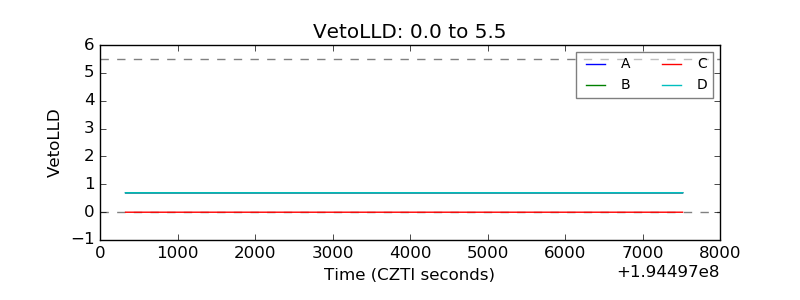 |
| Alpha Counter | 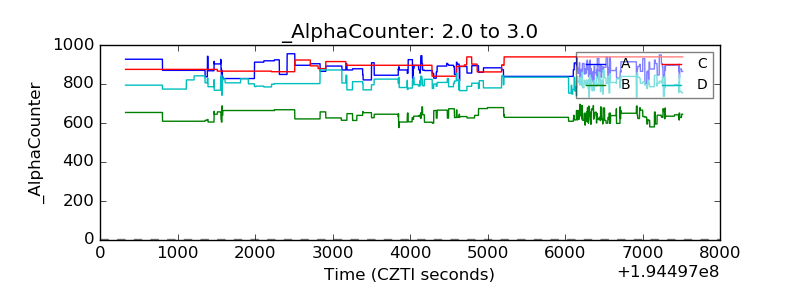 |
| _CPM_Rate | 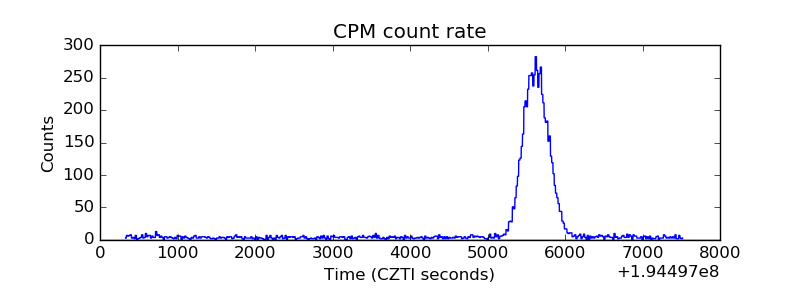 |
| CZT Counter | 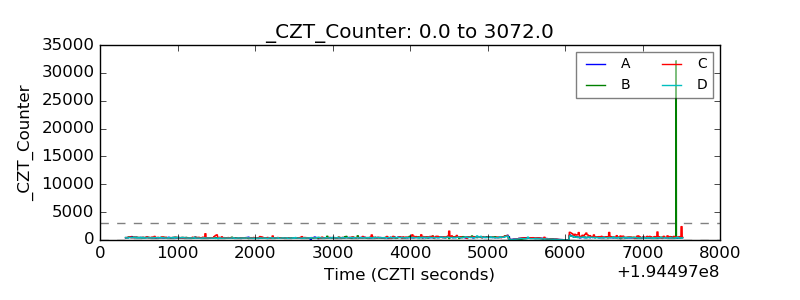 |
| +2.5 Volts monitor |  |
| +5 Volts monitor |  |
| _ROLL_ROT | 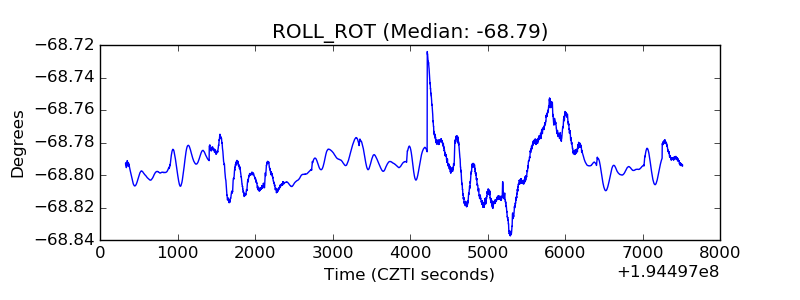 |
| _Roll_DEC | 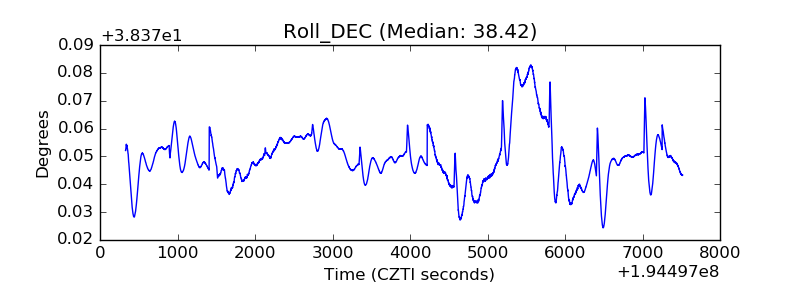 |
| _Roll_RA | 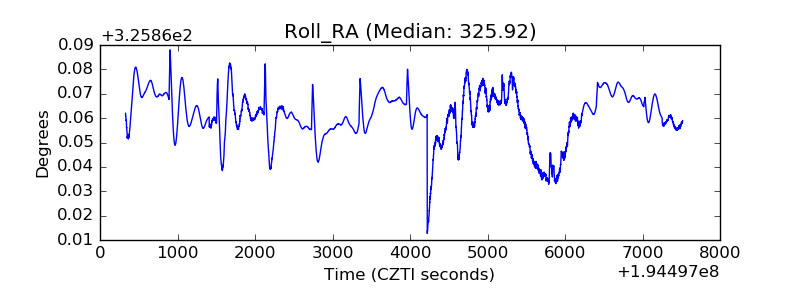 |
| Veto Counter | 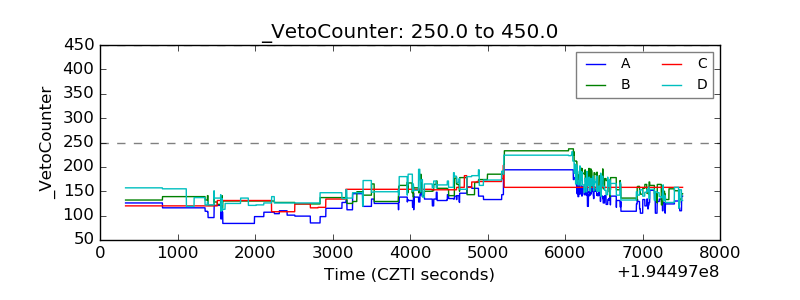 |