| Param | Original file | Final file |
|---|---|---|
| Filename | modeM0/AS1T01_058T01_9000000348_02296cztM0_level2.evt | modeM0/AS1T01_058T01_9000000348_02296cztM0_level2_quad_clean.evt |
| Size (bytes) | 432,558,720 | 89,432,640 |
| Size | 412.5 MB | 85.3 MB |
| Events in quadrant A | 2,790,552 | 557,487 |
| Events in quadrant B | 3,079,519 | 572,018 |
| Events in quadrant C | 3,351,753 | 573,089 |
| Events in quadrant D | 3,433,145 | 549,418 |
| Mode M9 | |||
|---|---|---|---|
| Quadrant | BADHDUFLAG | Total packets | Discarded packets |
| A | 0 | 10 | 0 |
| B | 0 | 10 | 0 |
| C | 0 | 10 | 0 |
| D | 0 | 10 | 0 |
| Mode SS | |||
|---|---|---|---|
| Quadrant | BADHDUFLAG | Total packets | Discarded packets |
| A | 0 | 132 | 0 |
| B | 0 | 132 | 0 |
| C | 0 | 132 | 0 |
| D | 0 | 132 | 0 |
| Mode M0 | |||
|---|---|---|---|
| Quadrant | BADHDUFLAG | Total packets | Discarded packets |
| A | 0 | 13272 | 2 |
| B | 0 | 13567 | 1 |
| C | 0 | 14509 | 1 |
| D | 0 | 15334 | 1 |
| Quadrant | Total seconds | Saturated seconds | Saturation percentage |
|---|---|---|---|
| A | 6544 | 37 | 0.565403% |
| B | 6544 | 40 | 0.611247% |
| C | 6544 | 46 | 0.702934% |
| D | 6544 | 140 | 2.139364% |
Noise dominated data is calculated using 1-second bins in cleaned event files. If a bin has >2000 counts, and if more than 50% of those come from <1% of pixels, then it is considered to be noise-dominated and hence unusable.
| Quadrant | # 1 sec bins | Bins with >0 counts | Bins with >2000 counts | High rate bins dominated by noise | Noise dominated (total time) | Noise dominated (detector-on time) | Marked lightcurve |
|---|---|---|---|---|---|---|---|
| A | 7468 | 6543 | 0 | 0 | 0.00% | 0.00% | 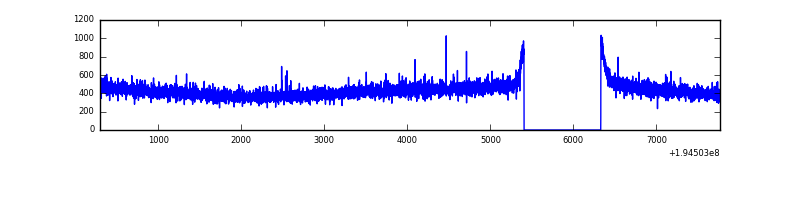 |
| B | 7469 | 6544 | 0 | 0 | 0.00% | 0.00% | 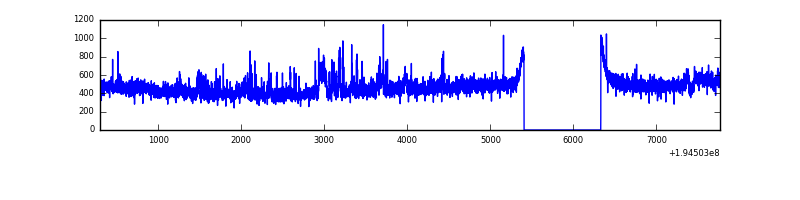 |
| C | 7468 | 6543 | 16 | 16 | 0.21% | 0.24% | 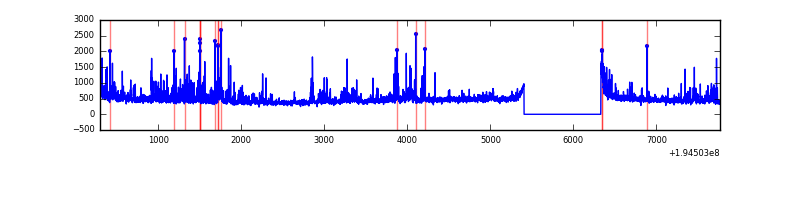 |
| D | 7469 | 6545 | 136 | 136 | 1.82% | 2.08% | 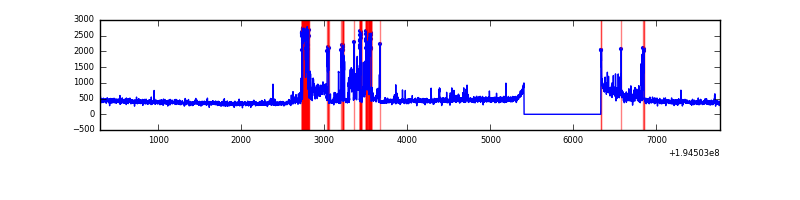 |
Top three noisy pixels from each quadrant. If the there are fewer than three noisy pixels in the level2.evt file, extra rows are filled as -1
| Pixel properties | Quadrant properties | ||||||
|---|---|---|---|---|---|---|---|
| Quadrant | DetID | PixID | Counts | Sigma | Mean | Median | Sigma |
| A | 12 | 194 | 7981 | 49.07 | 724 | 706 | 148.3 |
| A | 0 | 226 | 7829 | 48.05 | 724 | 706 | 148.3 |
| A | 14 | 63 | 1913 | 8.14 | 724 | 706 | 148.3 |
| B | 4 | 48 | 226578 | 1593.26 | 734 | 716 | 141.8 |
| B | 8 | 3 | 14209 | 95.18 | 734 | 716 | 141.8 |
| B | 15 | 85 | 13018 | 86.78 | 734 | 716 | 141.8 |
| C | 5 | 234 | 508742 | 3056.89 | 704 | 708 | 166.2 |
| C | 14 | 223 | 43519 | 257.6 | 704 | 708 | 166.2 |
| C | 9 | 247 | 28900 | 169.63 | 704 | 708 | 166.2 |
| D | 9 | 66 | 795108 | 4813.05 | 691 | 673 | 165.1 |
| D | 15 | 194 | 12610 | 72.32 | 691 | 673 | 165.1 |
| D | 1 | 84 | 9588 | 54.01 | 691 | 673 | 165.1 |
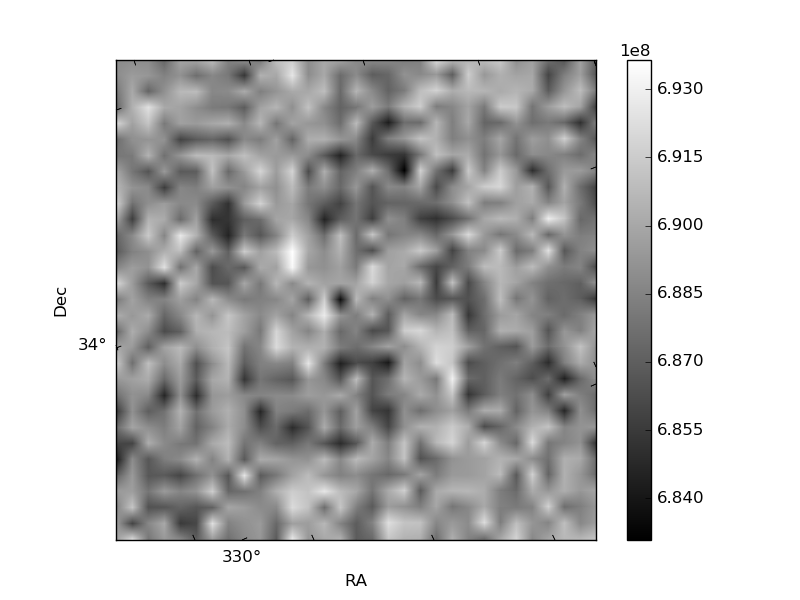
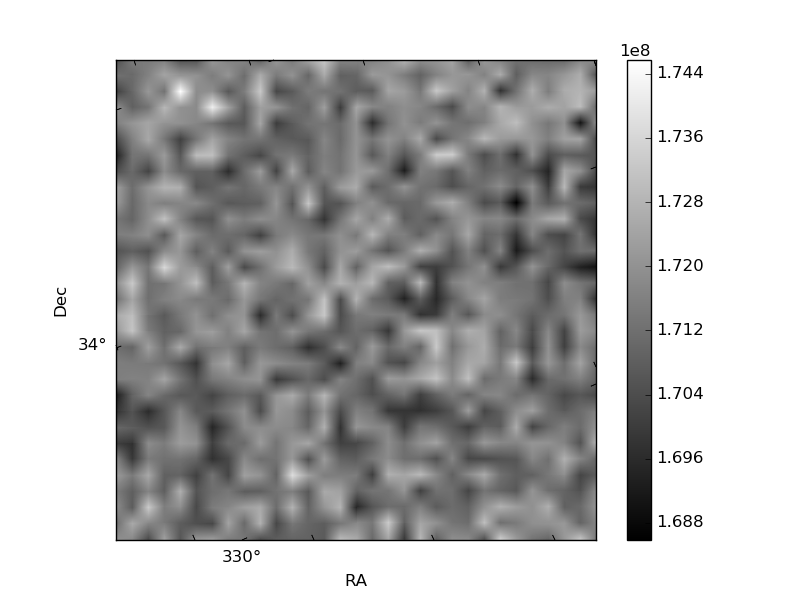
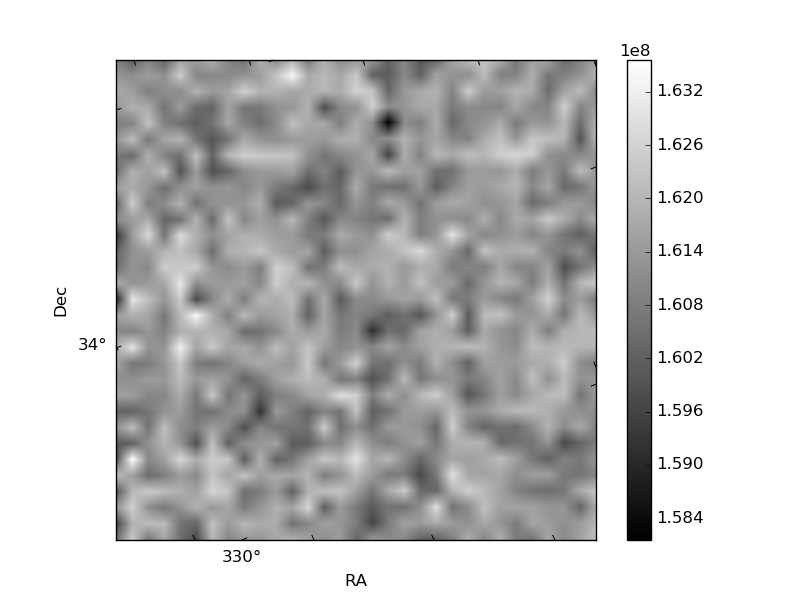
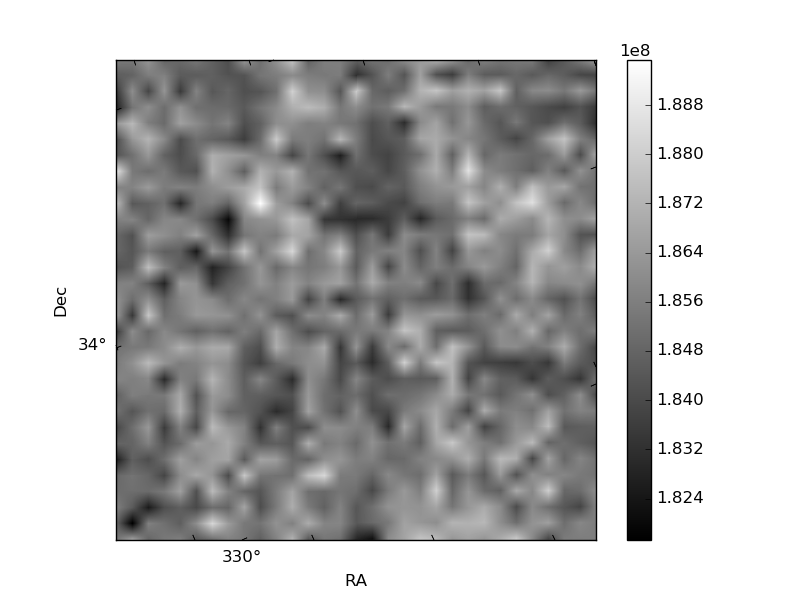
Histogram calculated using DETX and DETY for each event in the final _common_clean file
| Quadrant A | 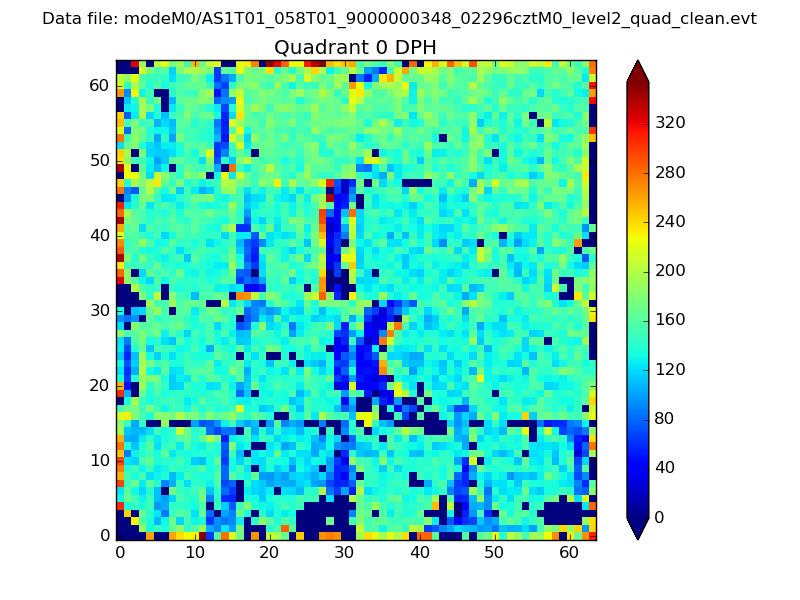 |
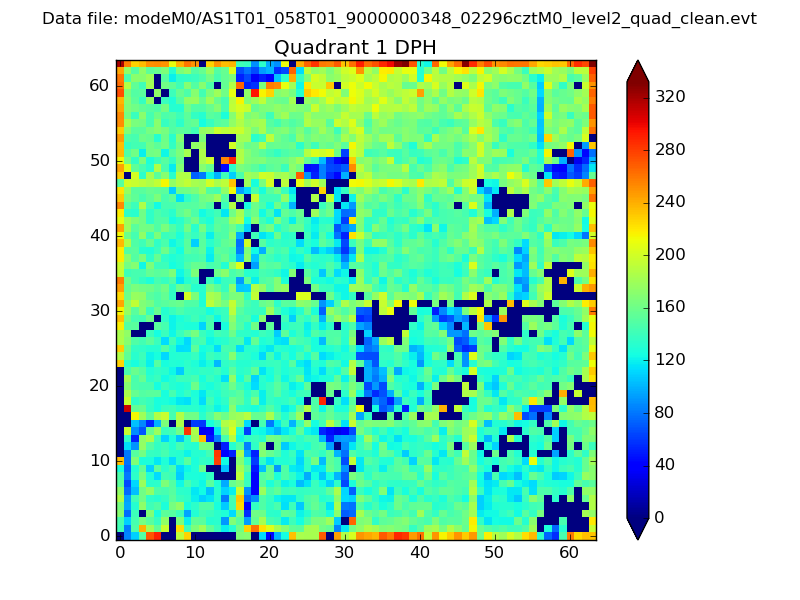 |
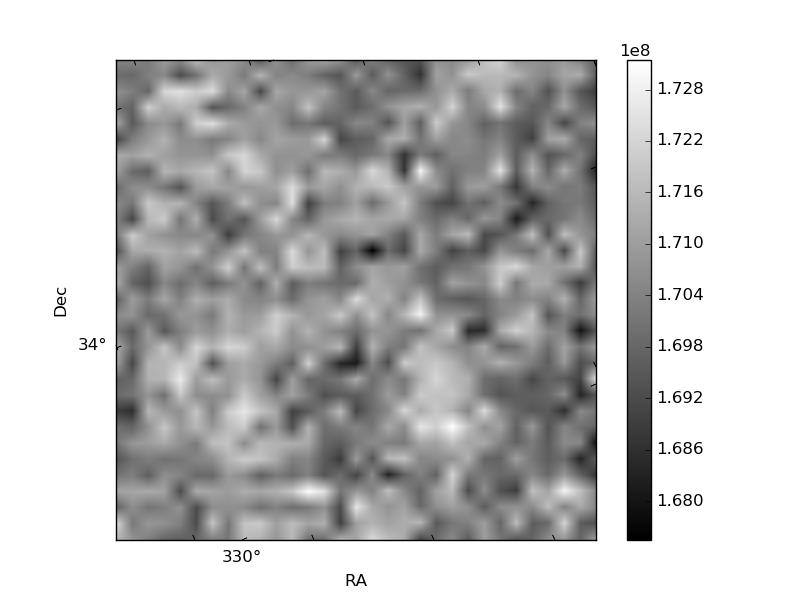
Quadrant B |
|---|---|---|---|
| Quadrant D | 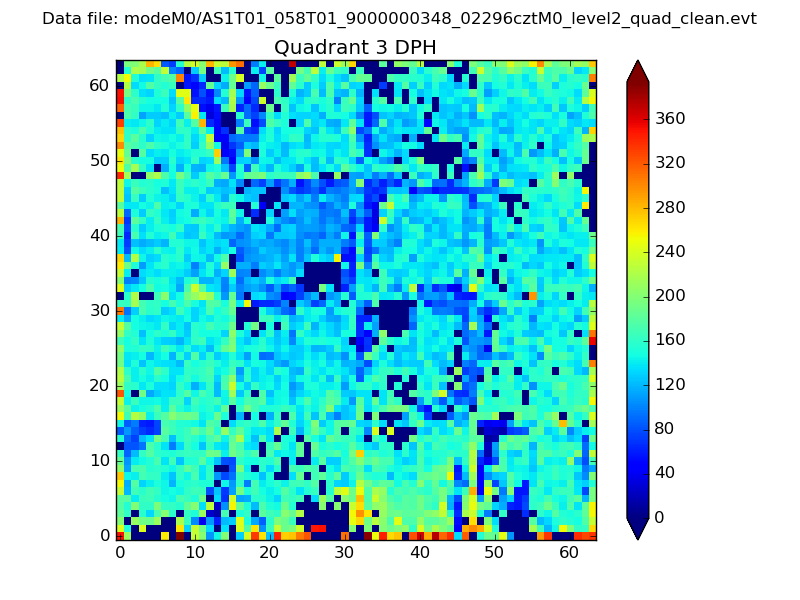 |
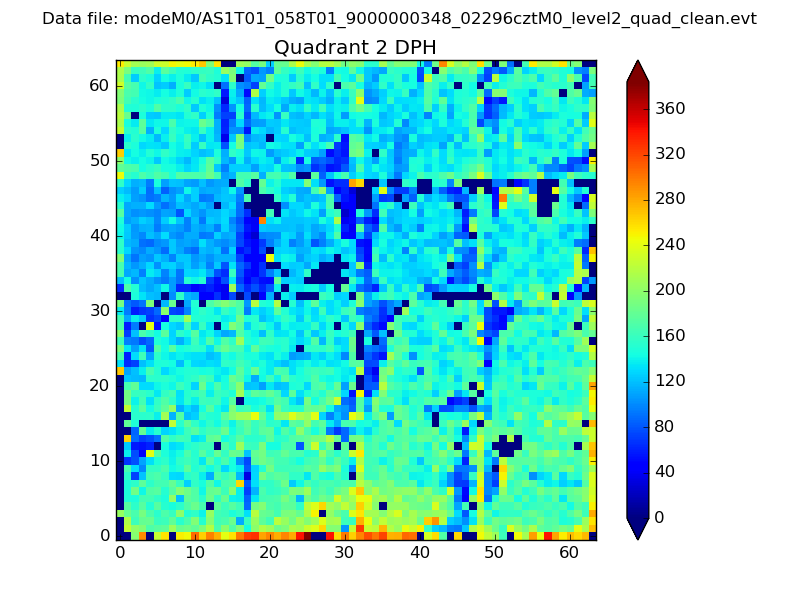 |
Quadrant C |
| Plot type | Count rate plots | Images |
|---|---|---|
| Comparison with Poisson distribution Blue bars denote a histogram of data divided into 1 sec bins. Red curve is a Poisson curve with rate = median count rate of data. |
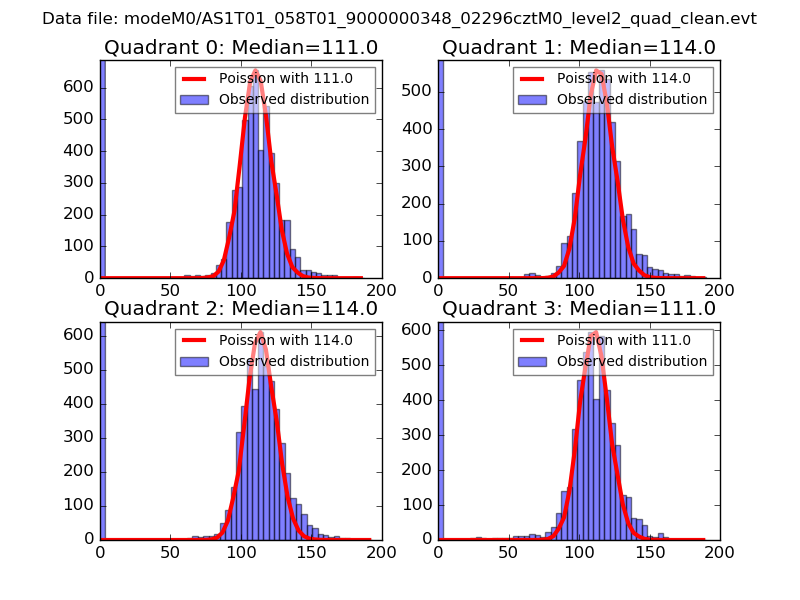 |
 |
| Quadrant-wise count rates Data is divided into 100 sec bins |
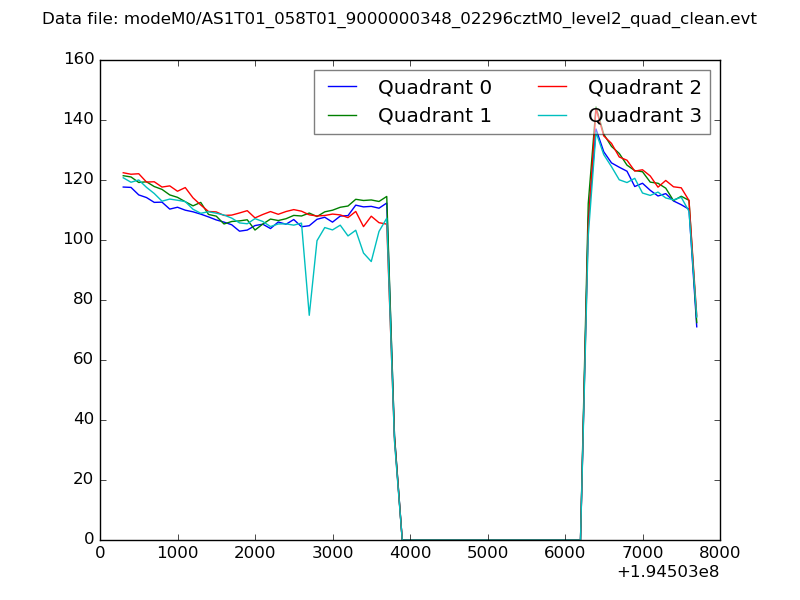 |
|
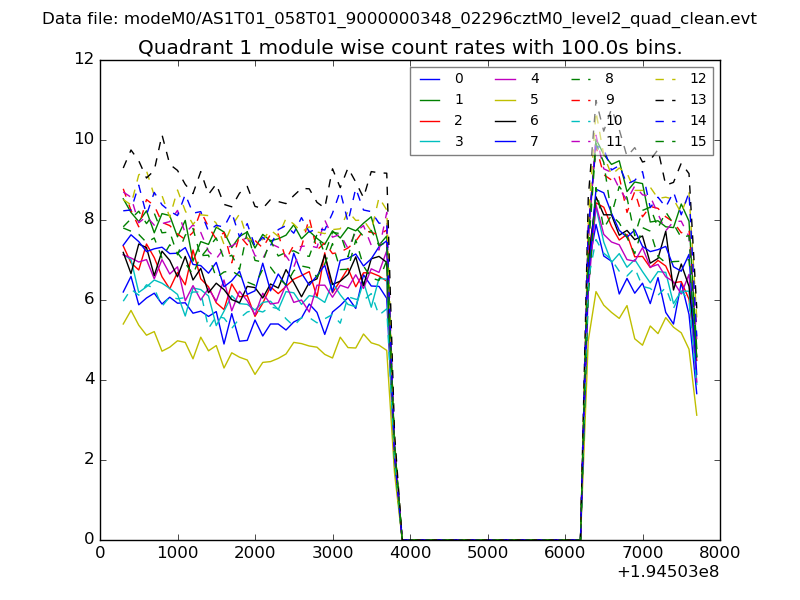
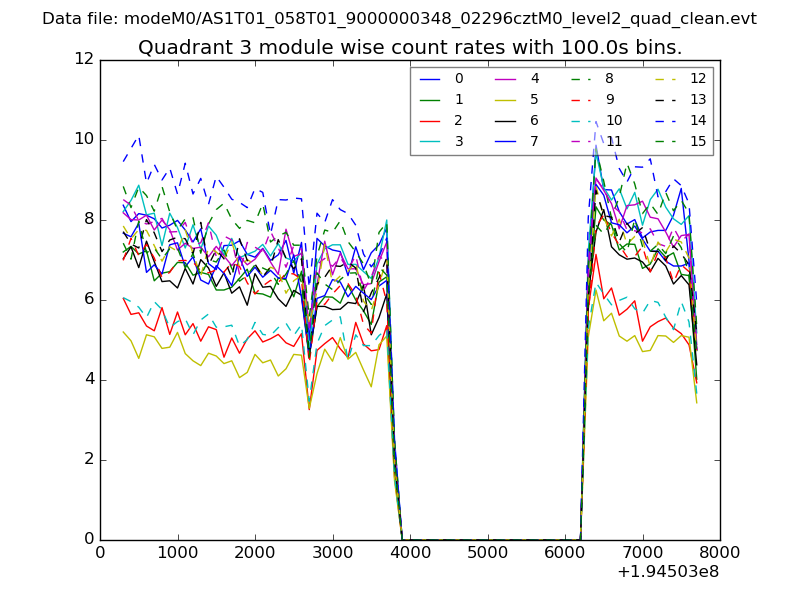
| Module-wise count rates for Quadrant A Data is divided into 100 sec bins |
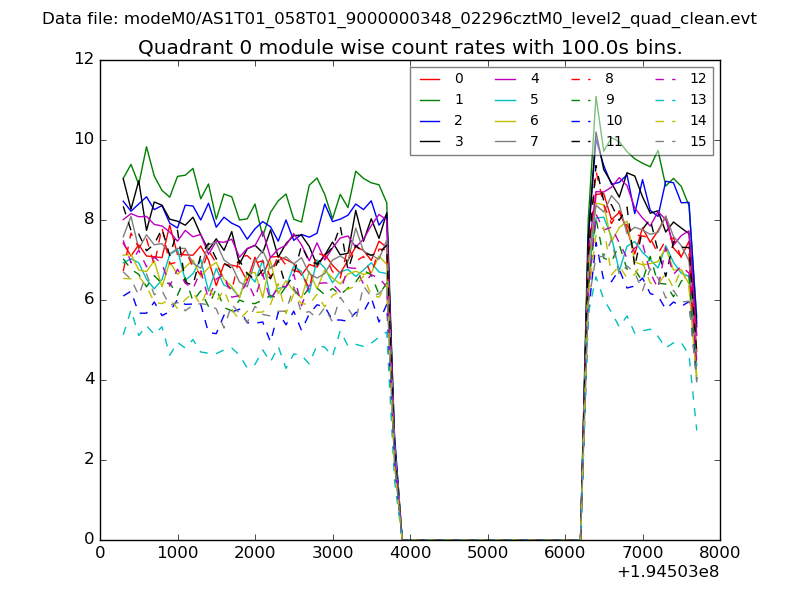 |
 |
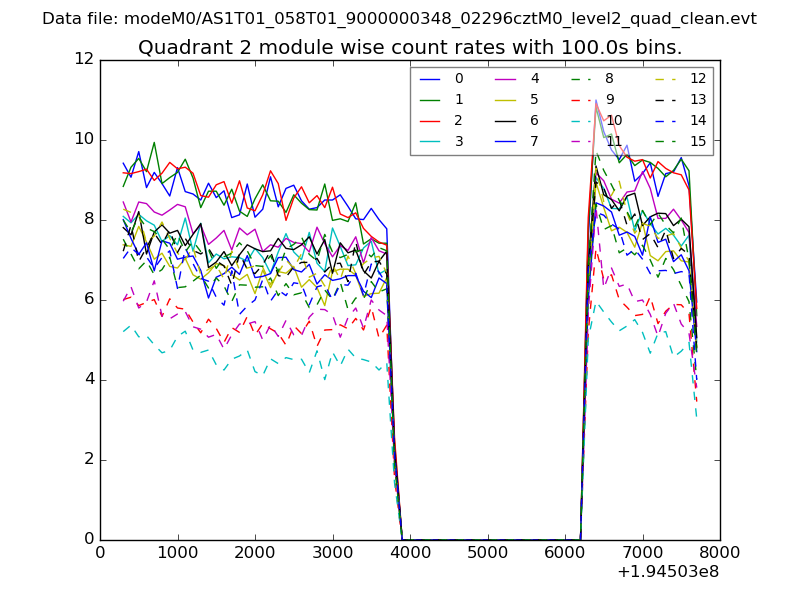
| Module-wise count rates for Quadrant B Data is divided into 100 sec bins |
 |
 |
| Module-wise count rates for Quadrant C Data is divided into 100 sec bins |
 |
 |
| Module-wise count rates for Quadrant D Data is divided into 100 sec bins |
 |
 |
| Parameter | Plot |
|---|---|
| CZT HV Monitor | 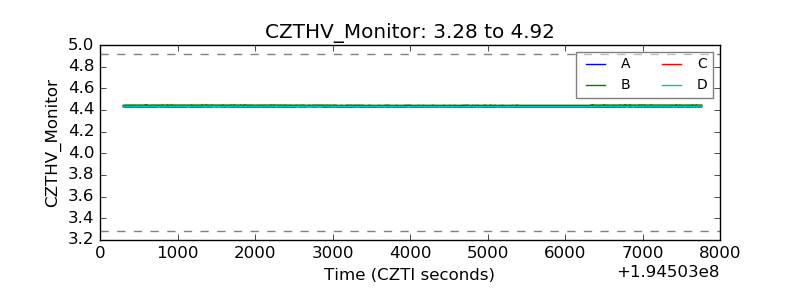 |
| D_VDD | 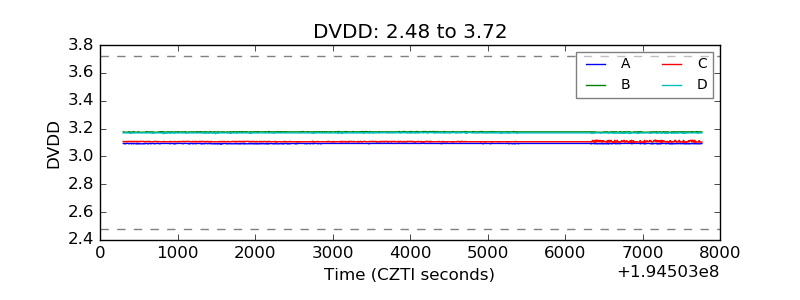 |
| Temperature 1 | 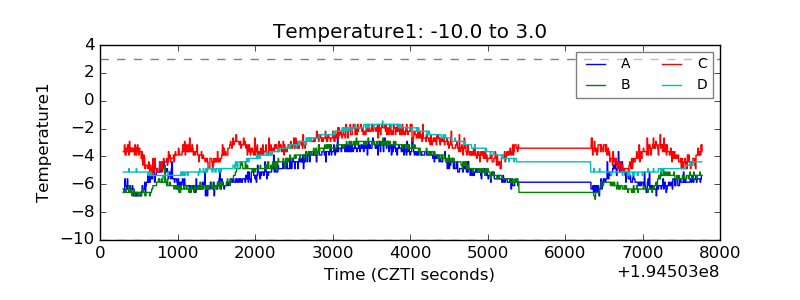 |
| Veto HV Monitor | 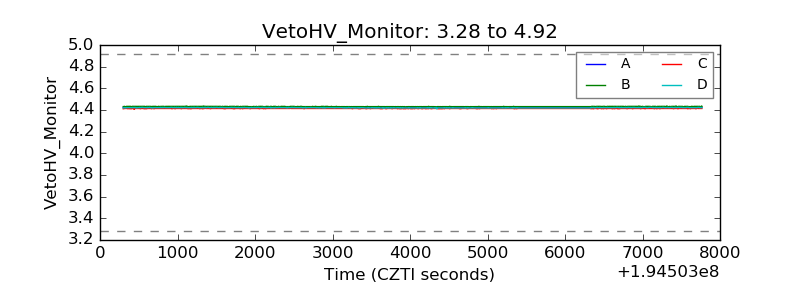 |
| Veto LLD | 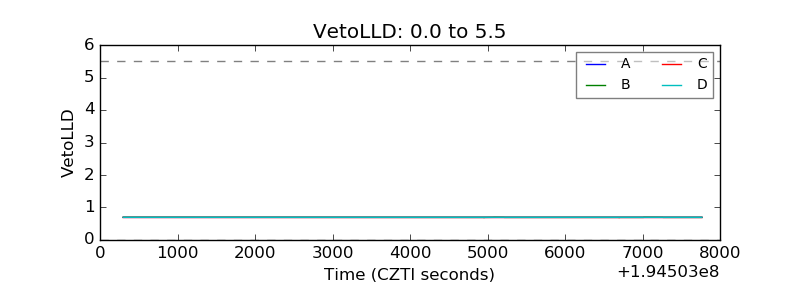 |
| Alpha Counter | 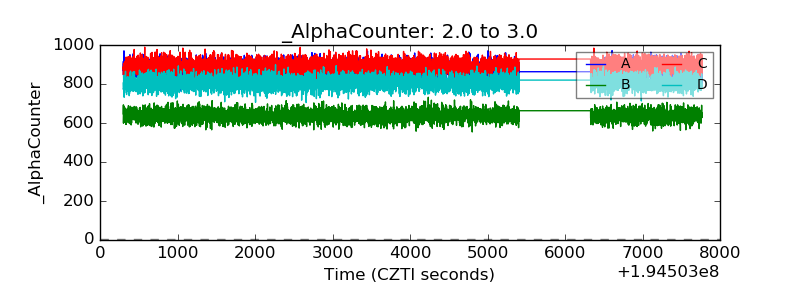 |
| _CPM_Rate | 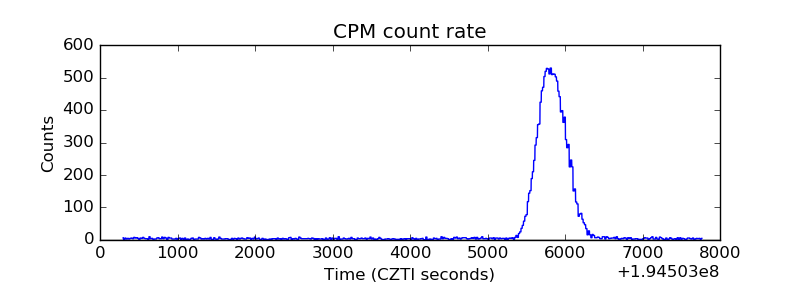 |
| CZT Counter | 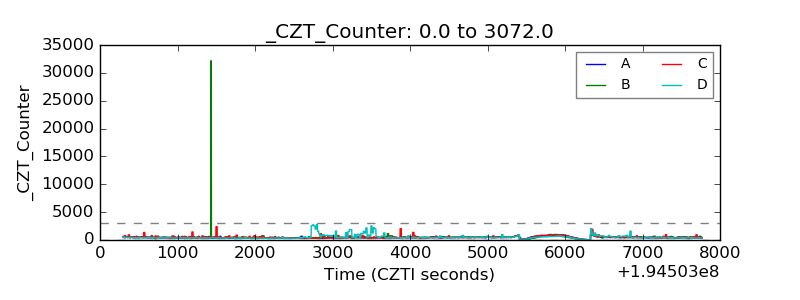 |
| +2.5 Volts monitor |  |
| +5 Volts monitor |  |
| _ROLL_ROT | 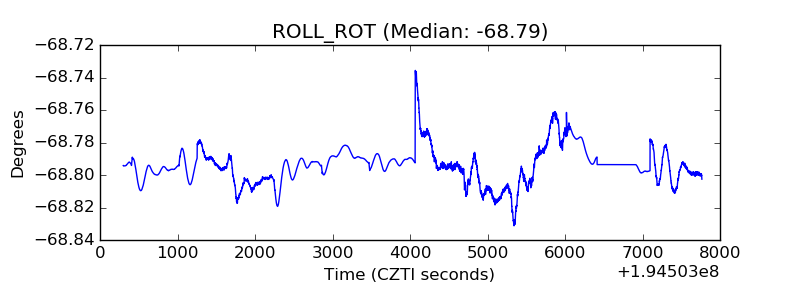 |
| _Roll_DEC | 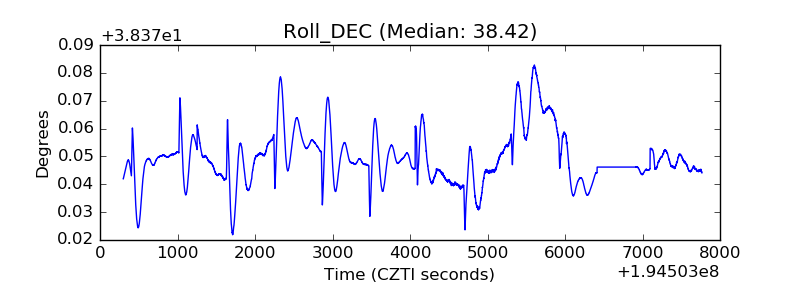 |
| _Roll_RA | 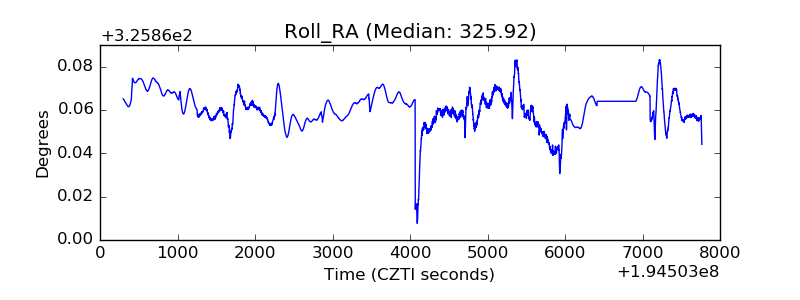 |
| Veto Counter | 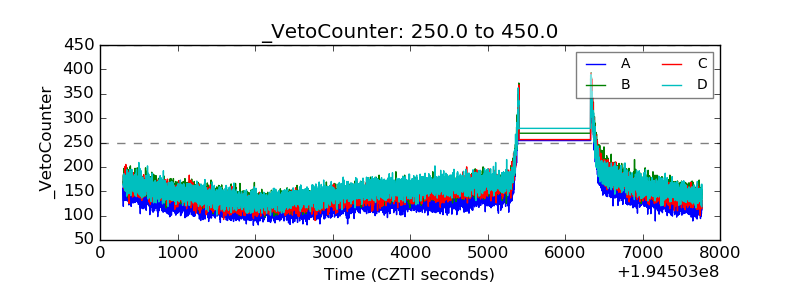 |