| Param | Original file | Final file |
|---|---|---|
| Filename | modeM0/AS1T01_043T01_9000000350cztM0_level2.fits | modeM0/AS1T01_043T01_9000000350cztM0_level2_quad_clean.evt |
| Size (bytes) | 283,417,920 | 270,924,480 |
| Size | 270.3 MB | 258.4 MB |
| Events in quadrant A | 1,728,192 | 1,583,737 |
| Events in quadrant B | 1,672,658 | 1,616,017 |
| Events in quadrant C | 1,689,018 | 1,533,060 |
| Events in quadrant D | 1,403,246 | 1,382,852 |
| Mode M9 | |||
|---|---|---|---|
| Quadrant | BADHDUFLAG | Total packets | Discarded packets |
| A | 0 | 59 | 0 |
| B | 0 | 59 | 0 |
| C | 0 | 59 | 0 |
| D | 0 | 59 | 0 |
| Mode M0 | |||
|---|---|---|---|
| Quadrant | BADHDUFLAG | Total packets | Discarded packets |
| A | 0 | 62341 | 0 |
| B | 0 | 62925 | 0 |
| C | 0 | 69225 | 0 |
| D | 0 | 91138 | 0 |
| Mode SS | |||
|---|---|---|---|
| Quadrant | BADHDUFLAG | Total packets | Discarded packets |
| A | 0 | 620 | 0 |
| B | 0 | 620 | 0 |
| C | 0 | 620 | 0 |
| D | 0 | 620 | 0 |
| Quadrant | Total seconds | Saturated seconds | Saturation percentage |
|---|---|---|---|
| A | 30390 | 543 | 1.786772% |
| B | 30390 | 507 | 1.668312% |
| C | 30390 | 661 | 2.175058% |
| D | 30390 | 2850 | 9.378085% |
Noise dominated data is calculated using 1-second bins in cleaned event files. If a bin has >2000 counts, and if more than 50% of those come from <1% of pixels, then it is considered to be noise-dominated and hence unusable.
| Quadrant | # 1 sec bins | Bins with >0 counts | Bins with >2000 counts | High rate bins dominated by noise | Noise dominated (total time) | Noise dominated (detector-on time) | Marked lightcurve |
|---|---|---|---|---|---|---|---|
| A | 36154 | 30385 | 0 | 0 | 0.00% | 0.00% | 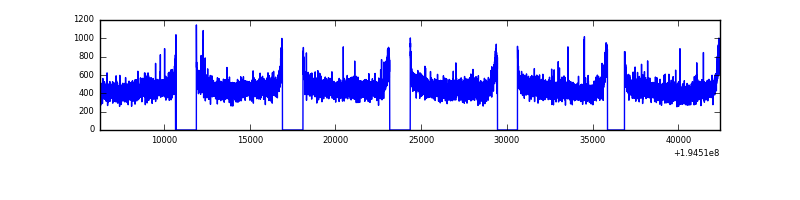 |
| B | 36154 | 30383 | 0 | 0 | 0.00% | 0.00% |  |
| C | 36154 | 30381 | 0 | 0 | 0.00% | 0.00% |  |
| D | 36154 | 30380 | 0 | 0 | 0.00% | 0.00% |  |
Top three noisy pixels from each quadrant. If the there are fewer than three noisy pixels in the level2.evt file, extra rows are filled as -1
| Pixel properties | Quadrant properties | ||||||
|---|---|---|---|---|---|---|---|
| Quadrant | DetID | PixID | Counts | Sigma | Mean | Median | Sigma |
| A | 14 | 188 | 1644 | 10.4 | 447 | 418 | 117.9 |
| A | 0 | 29 | 1629 | 10.28 | 447 | 418 | 117.9 |
| A | 7 | 110 | 1550 | 9.61 | 447 | 418 | 117.9 |
| B | 2 | 9 | 1449 | 11.99 | 439 | 418 | 86.0 |
| B | 12 | 226 | 1246 | 9.63 | 439 | 418 | 86.0 |
| B | 5 | 128 | 1185 | 8.92 | 439 | 418 | 86.0 |
| C | 3 | 158 | 1122 | 5.89 | 446 | 412 | 120.4 |
| C | 9 | 242 | 1113 | 5.82 | 446 | 412 | 120.4 |
| C | 1 | 65 | 1107 | 5.77 | 446 | 412 | 120.4 |
| D | 7 | 5 | 1031 | 5.9 | 399 | 362 | 113.4 |
| D | 6 | 44 | 1028 | 5.87 | 399 | 362 | 113.4 |
| D | 1 | 19 | 1021 | 5.81 | 399 | 362 | 113.4 |
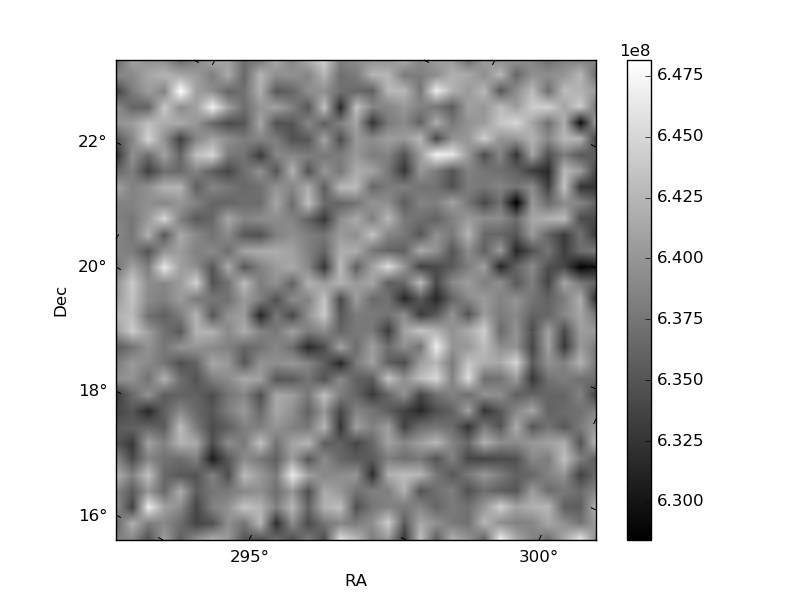
Histogram calculated using DETX and DETY for each event in the final _common_clean file
| Quadrant A | 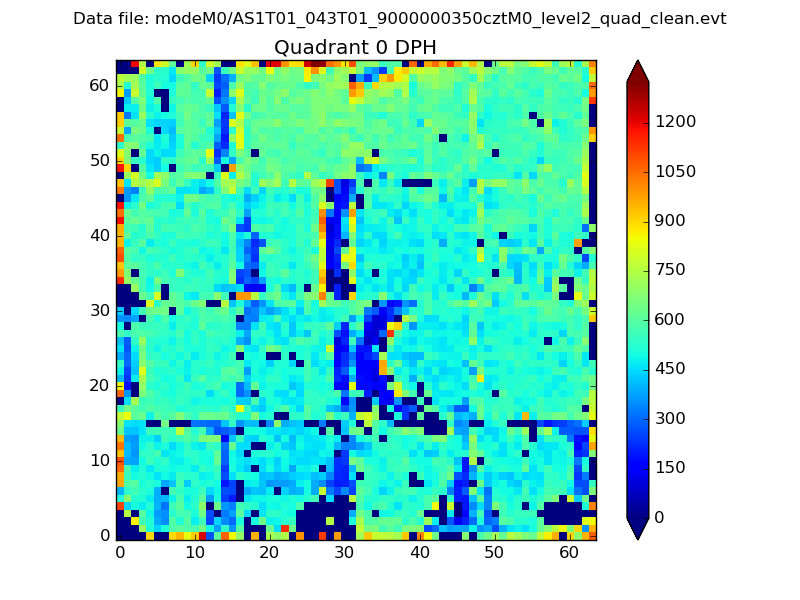 |
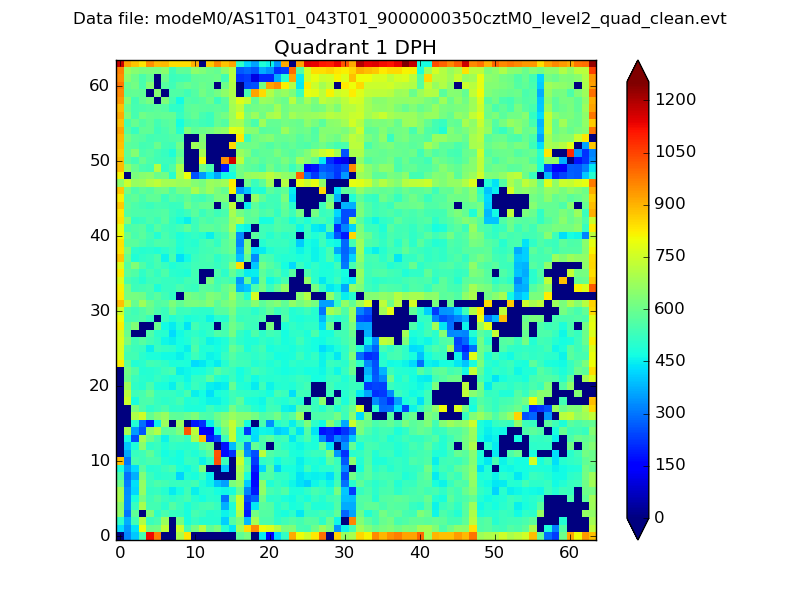 |
Quadrant B |
|---|---|---|---|
| Quadrant D |  |
 |
Quadrant C |
| Plot type | Count rate plots | Images |
|---|---|---|
| Comparison with Poisson distribution Blue bars denote a histogram of data divided into 1 sec bins. Red curve is a Poisson curve with rate = median count rate of data. |
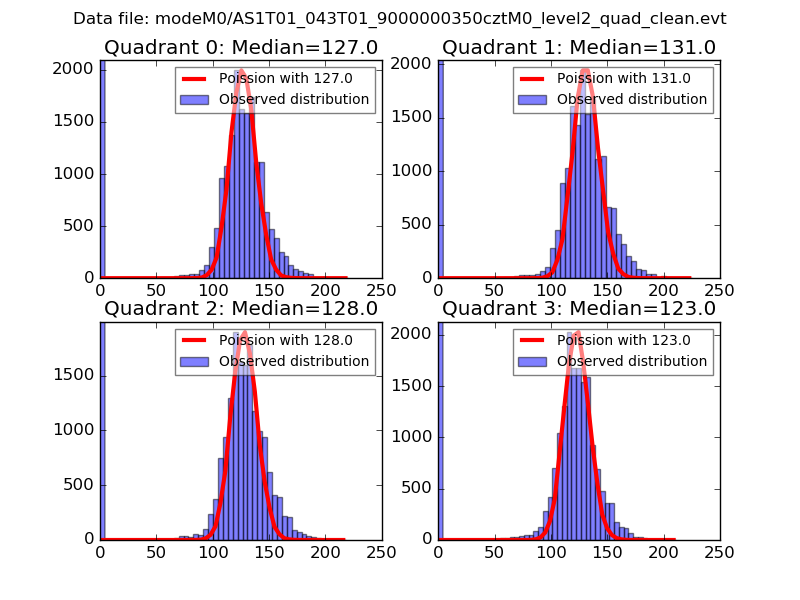 |
 |
| Quadrant-wise count rates Data is divided into 100 sec bins |
 |
|
| Module-wise count rates for Quadrant A Data is divided into 100 sec bins |
 |
 |
| Module-wise count rates for Quadrant B Data is divided into 100 sec bins |
 |
 |
| Module-wise count rates for Quadrant C Data is divided into 100 sec bins |
 |
 |
| Module-wise count rates for Quadrant D Data is divided into 100 sec bins |
 |
 |
| Parameter | Plot |
|---|---|
| CZT HV Monitor |  |
| D_VDD |  |
| Temperature 1 |  |
| Veto HV Monitor |  |
| Veto LLD |  |
| Alpha Counter |  |
| _CPM_Rate |  |
| CZT Counter |  |
| +2.5 Volts monitor | 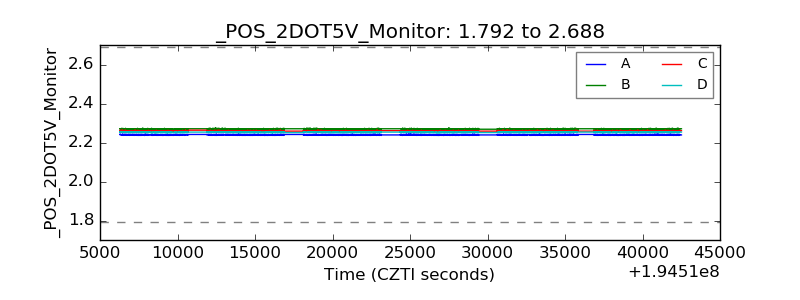 |
| +5 Volts monitor |  |
| _ROLL_ROT |  |
| _Roll_DEC |  |
| _Roll_RA |  |
| Veto Counter |  |