| Param | Original file | Final file |
|---|---|---|
| Filename | modeM0/AS1T01_043T01_9000000350_02298cztM0_level2.evt | modeM0/AS1T01_043T01_9000000350_02298cztM0_level2_quad_clean.evt |
| Size (bytes) | 56,793,600 | 11,410,560 |
| Size | 54.2 MB | 10.9 MB |
| Events in quadrant A | 344,720 | 70,529 |
| Events in quadrant B | 356,420 | 72,140 |
| Events in quadrant C | 375,599 | 69,992 |
| Events in quadrant D | 583,435 | 66,821 |
| Mode M0 | |||
|---|---|---|---|
| Quadrant | BADHDUFLAG | Total packets | Discarded packets |
| A | 0 | 1667 | 0 |
| B | 0 | 1667 | 0 |
| C | 0 | 1718 | 0 |
| D | 0 | 2366 | 0 |
| Mode SS | |||
|---|---|---|---|
| Quadrant | BADHDUFLAG | Total packets | Discarded packets |
| A | 0 | 16 | 0 |
| B | 0 | 16 | 0 |
| C | 0 | 16 | 0 |
| D | 0 | 16 | 0 |
| Quadrant | Total seconds | Saturated seconds | Saturation percentage |
|---|---|---|---|
| A | 833 | 0 | 0.000000% |
| B | 833 | 0 | 0.000000% |
| C | 833 | 0 | 0.000000% |
| D | 833 | 1 | 0.120048% |
Noise dominated data is calculated using 1-second bins in cleaned event files. If a bin has >2000 counts, and if more than 50% of those come from <1% of pixels, then it is considered to be noise-dominated and hence unusable.
| Quadrant | # 1 sec bins | Bins with >0 counts | Bins with >2000 counts | High rate bins dominated by noise | Noise dominated (total time) | Noise dominated (detector-on time) | Marked lightcurve |
|---|---|---|---|---|---|---|---|
| A | 833 | 833 | 0 | 0 | 0.00% | 0.00% | 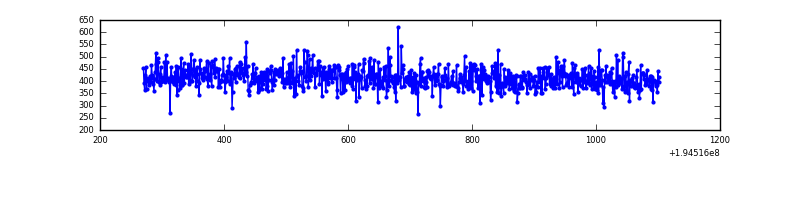 |
| B | 832 | 832 | 0 | 0 | 0.00% | 0.00% | 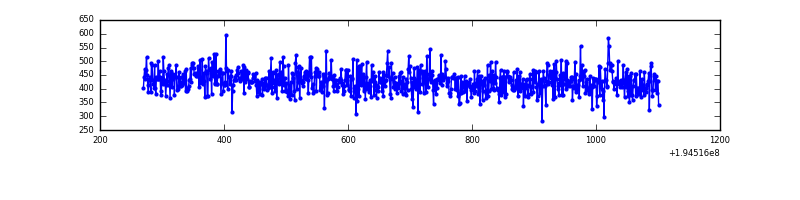 |
| C | 833 | 833 | 0 | 0 | 0.00% | 0.00% | 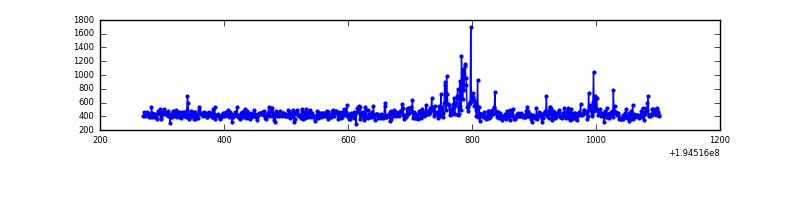 |
| D | 833 | 833 | 0 | 0 | 0.00% | 0.00% | 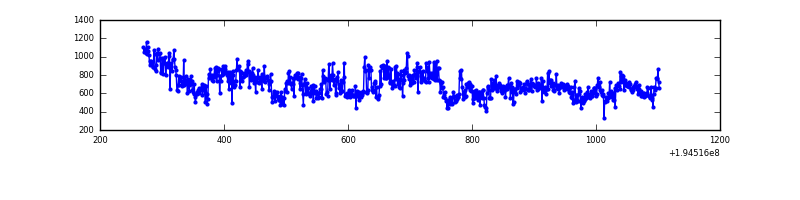 |
Top three noisy pixels from each quadrant. If the there are fewer than three noisy pixels in the level2.evt file, extra rows are filled as -1
| Pixel properties | Quadrant properties | ||||||
|---|---|---|---|---|---|---|---|
| Quadrant | DetID | PixID | Counts | Sigma | Mean | Median | Sigma |
| A | 0 | 226 | 982 | 44.57 | 89 | 87 | 20.1 |
| A | 12 | 194 | 942 | 42.58 | 89 | 87 | 20.1 |
| A | 13 | 9 | 361 | 13.65 | 89 | 87 | 20.1 |
| B | 4 | 48 | 4373 | 220.44 | 90 | 88 | 19.4 |
| B | 8 | 3 | 2454 | 121.72 | 90 | 88 | 19.4 |
| B | 12 | 111 | 1383 | 66.62 | 90 | 88 | 19.4 |
| C | 5 | 234 | 23131 | 1063.45 | 86 | 87 | 21.7 |
| C | 9 | 247 | 13961 | 640.27 | 86 | 87 | 21.7 |
| C | 13 | 61 | 805 | 33.13 | 86 | 87 | 21.7 |
| D | 9 | 66 | 259326 | 11955.29 | 84 | 82 | 21.7 |
| D | 5 | 233 | 3145 | 141.25 | 84 | 82 | 21.7 |
| D | 13 | 169 | 1639 | 71.8 | 84 | 82 | 21.7 |
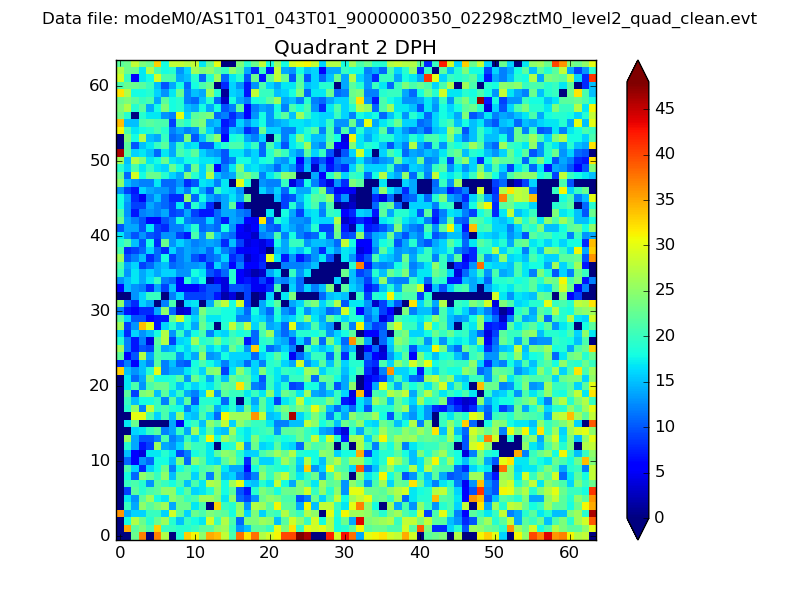
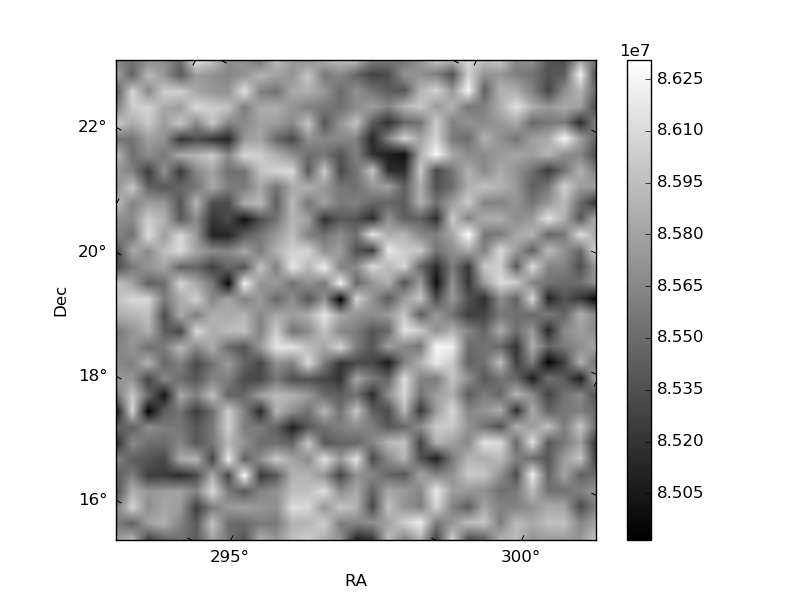
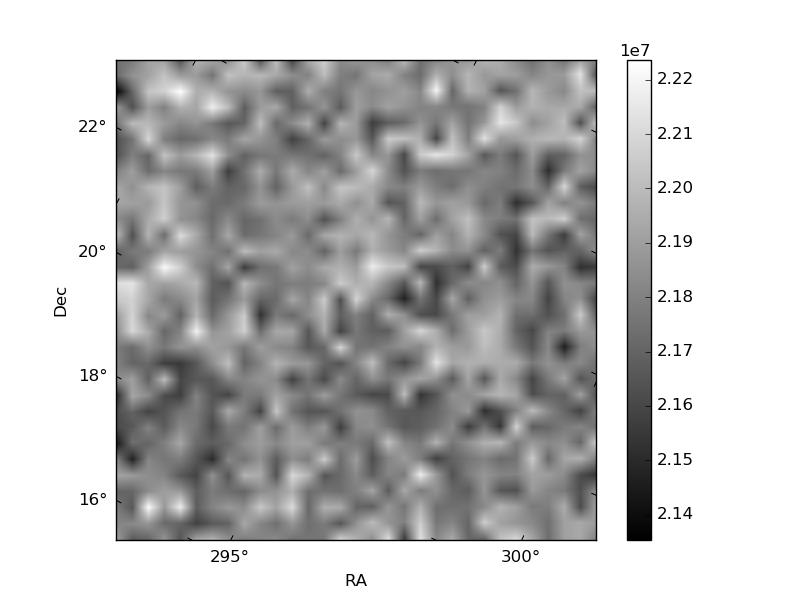
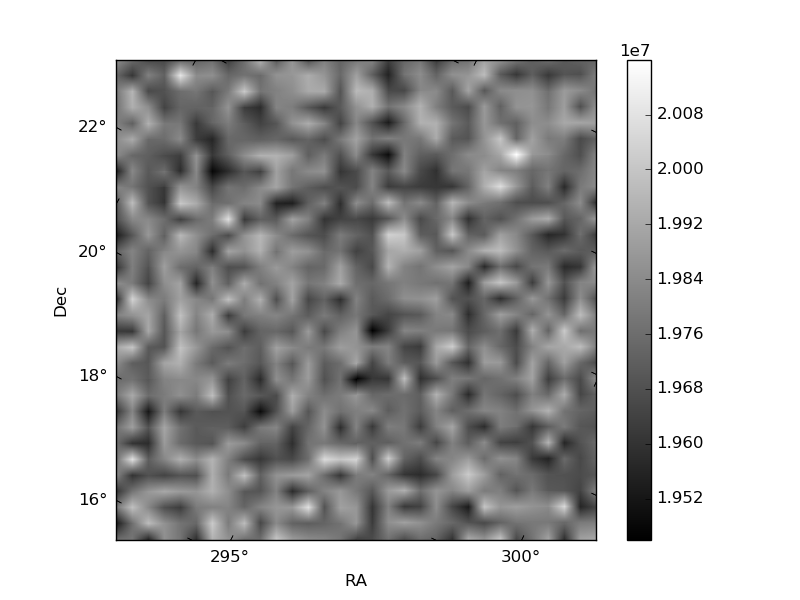
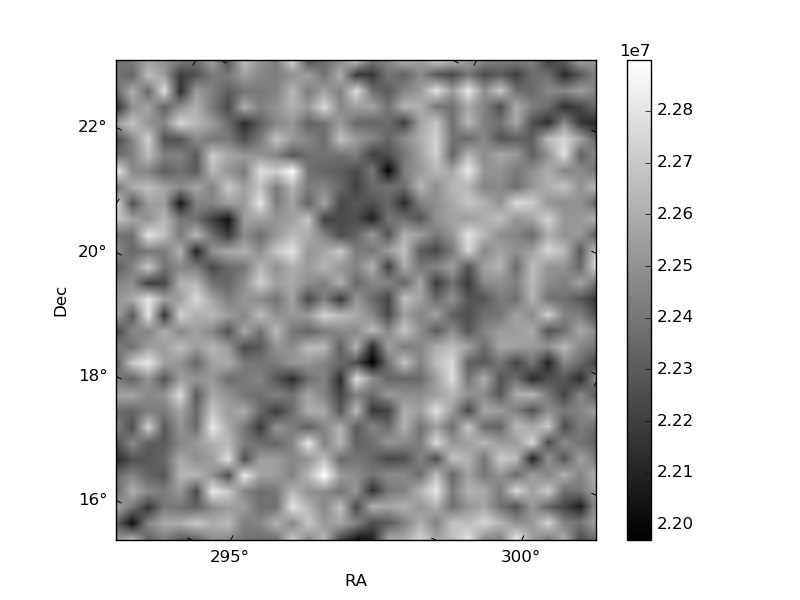
Histogram calculated using DETX and DETY for each event in the final _common_clean file
| Quadrant A | 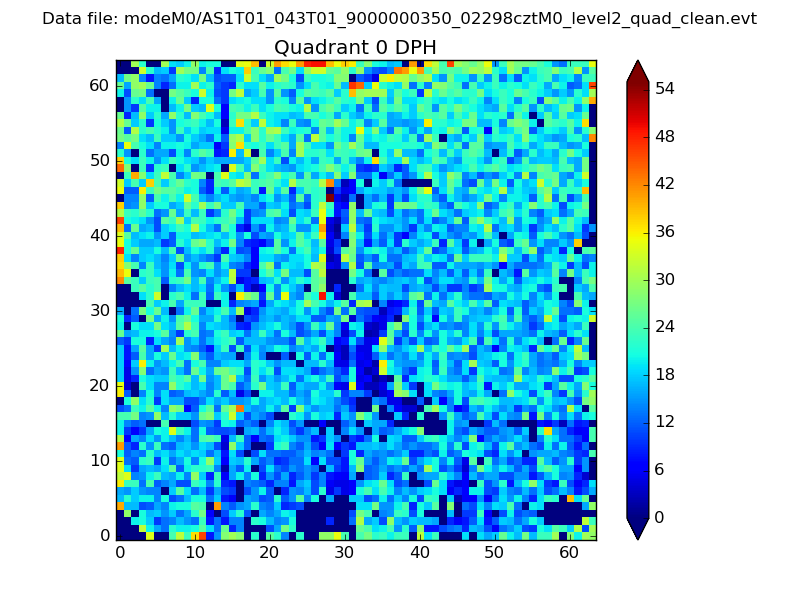 |
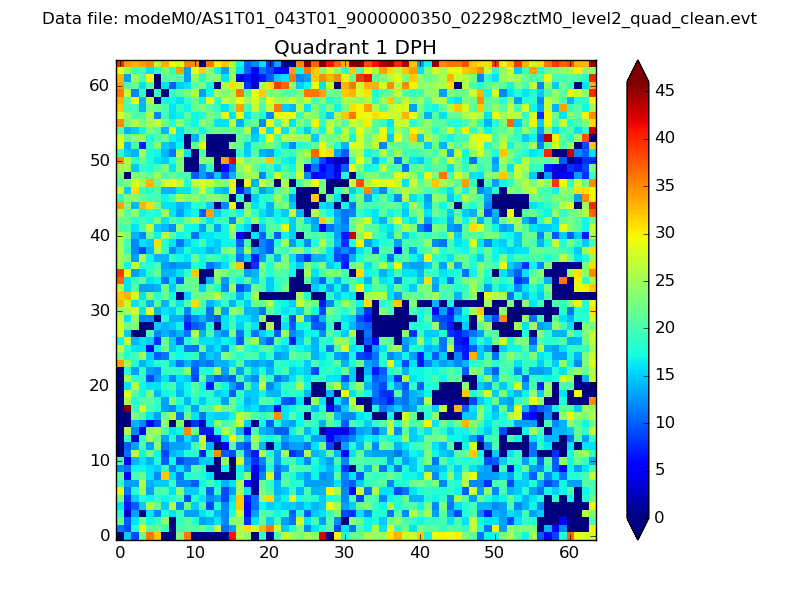 |
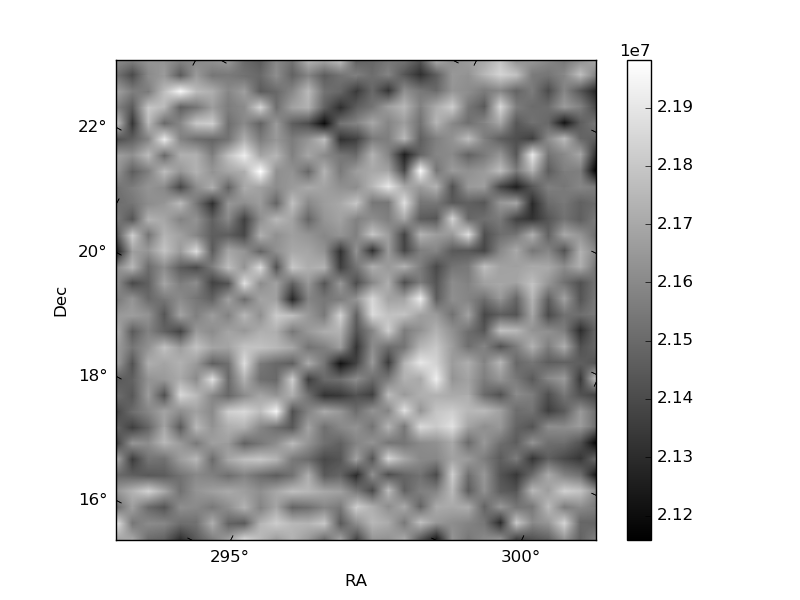
Quadrant B |
|---|---|---|---|
| Quadrant D | 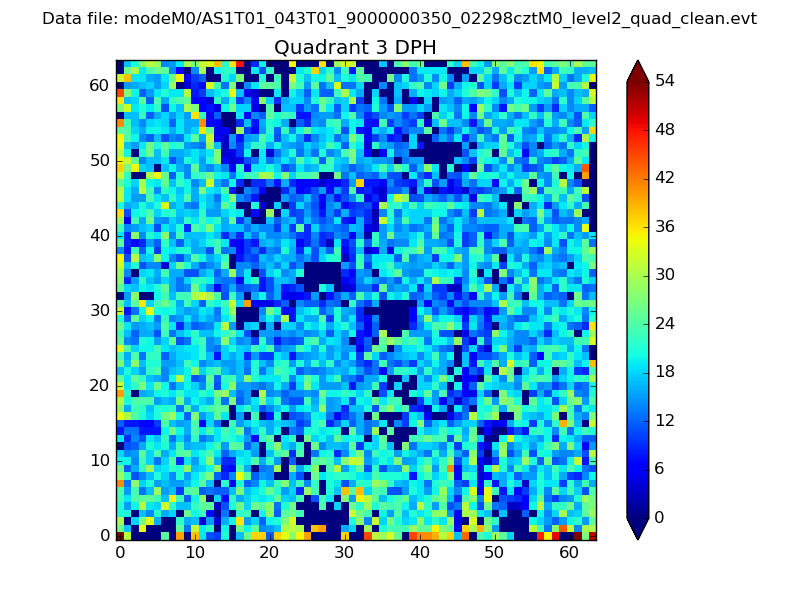 |
 |
Quadrant C |
| Plot type | Count rate plots | Images |
|---|---|---|
| Comparison with Poisson distribution Blue bars denote a histogram of data divided into 1 sec bins. Red curve is a Poisson curve with rate = median count rate of data. |
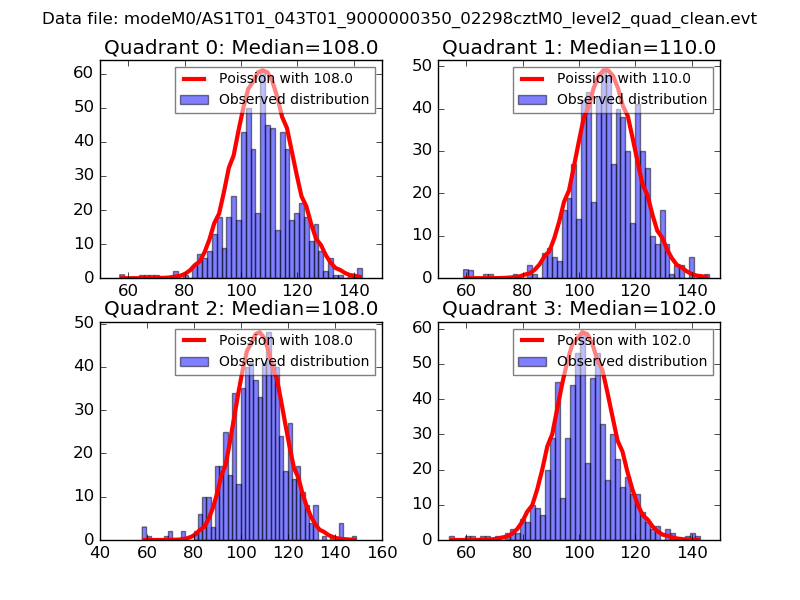 |
 |
| Quadrant-wise count rates Data is divided into 100 sec bins |
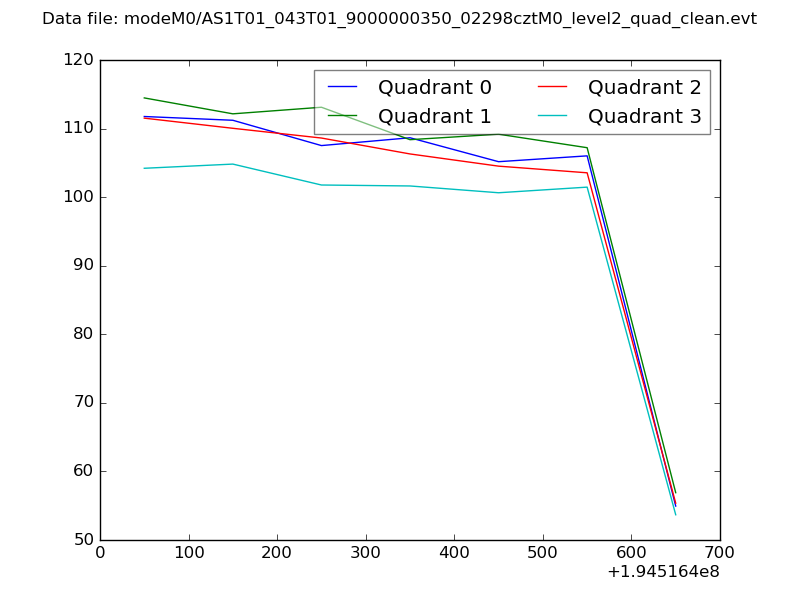 |
|
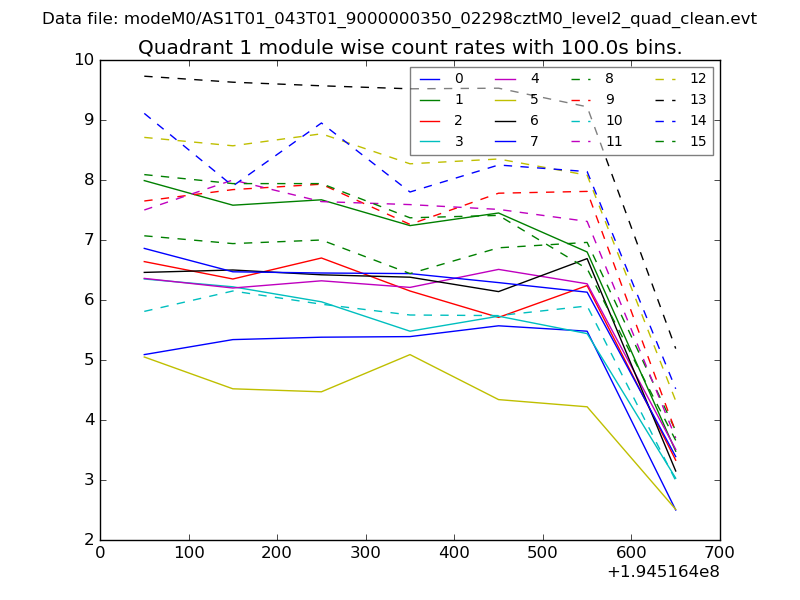
| Module-wise count rates for Quadrant A Data is divided into 100 sec bins |
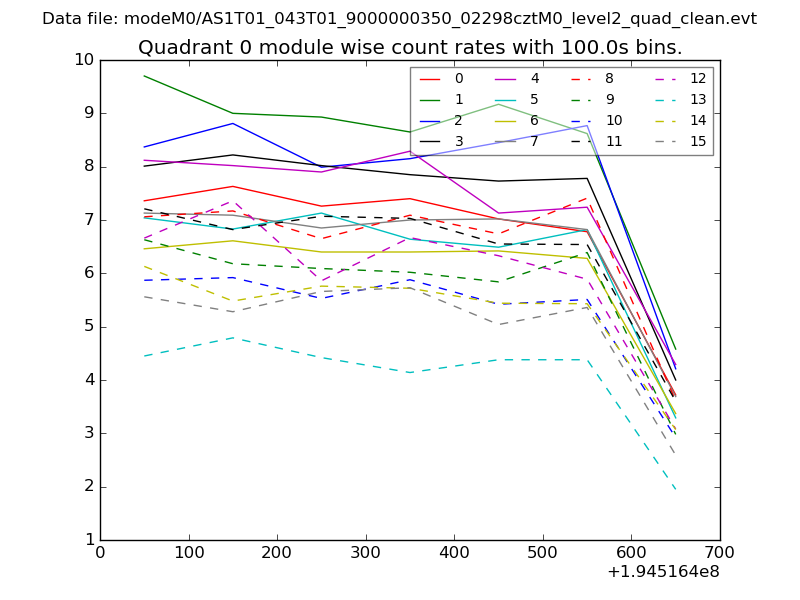 |
 |
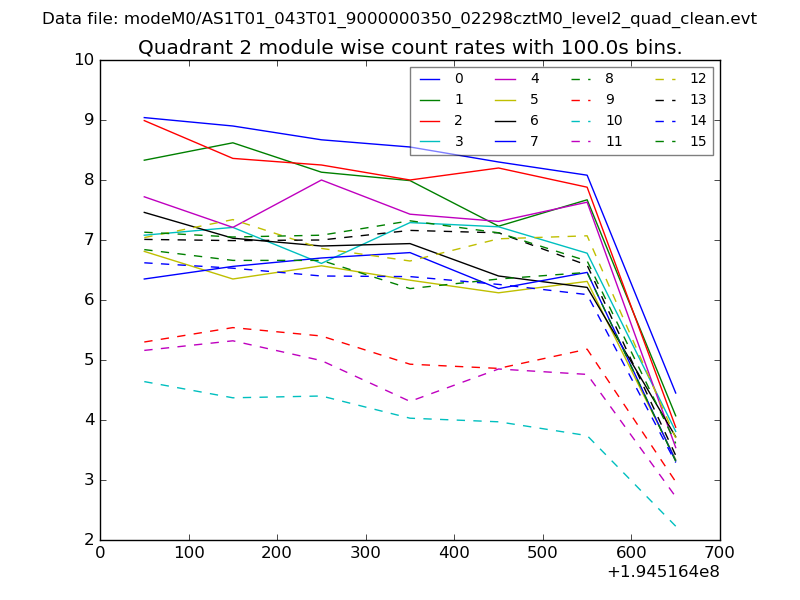
| Module-wise count rates for Quadrant B Data is divided into 100 sec bins |
 |
 |
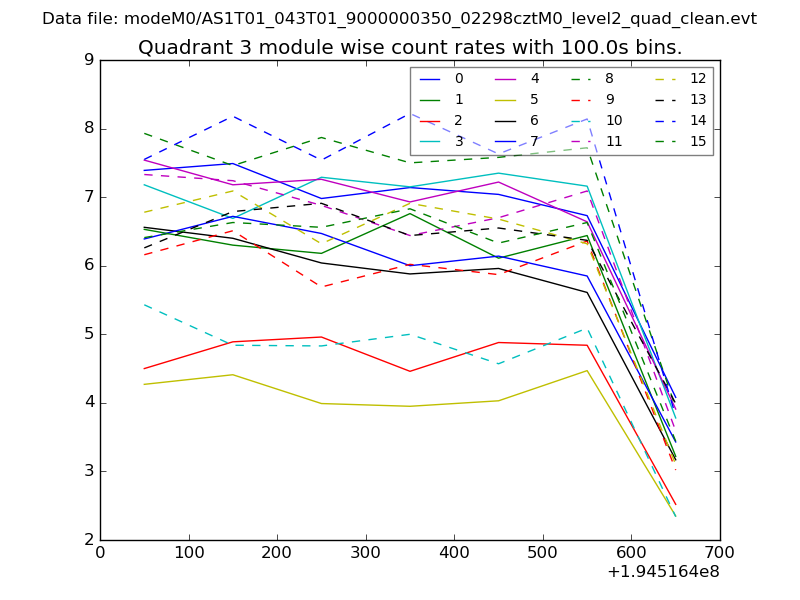
| Module-wise count rates for Quadrant C Data is divided into 100 sec bins |
 |
 |
| Module-wise count rates for Quadrant D Data is divided into 100 sec bins |
 |
 |
| Parameter | Plot |
|---|---|
| CZT HV Monitor | 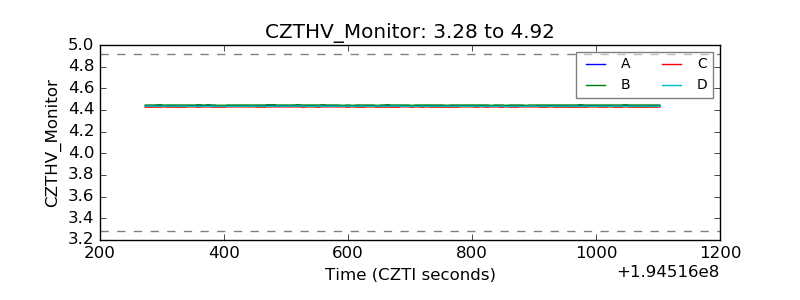 |
| D_VDD | 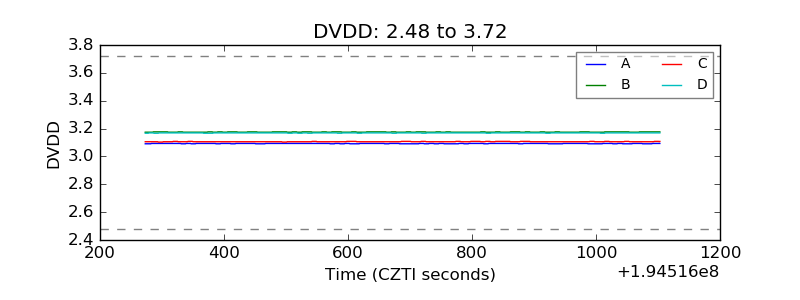 |
| Temperature 1 | 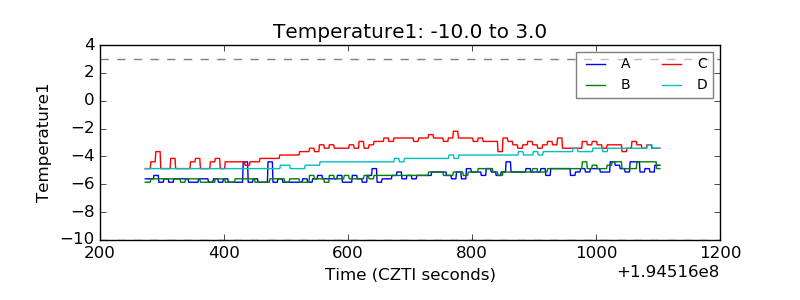 |
| Veto HV Monitor | 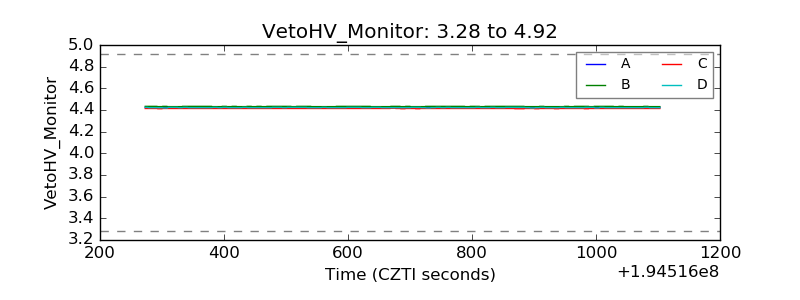 |
| Veto LLD | 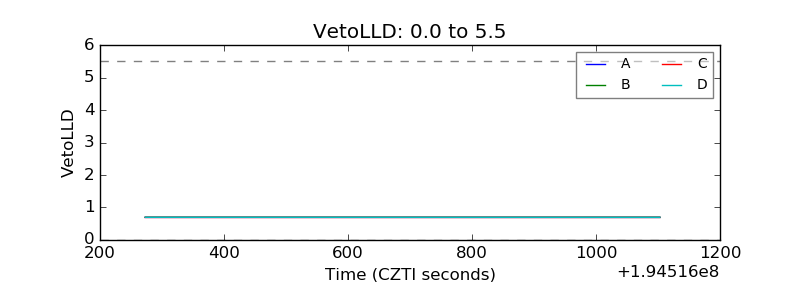 |
| Alpha Counter | 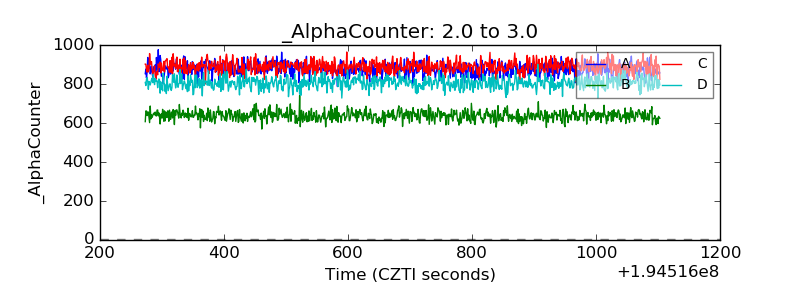 |
| _CPM_Rate | 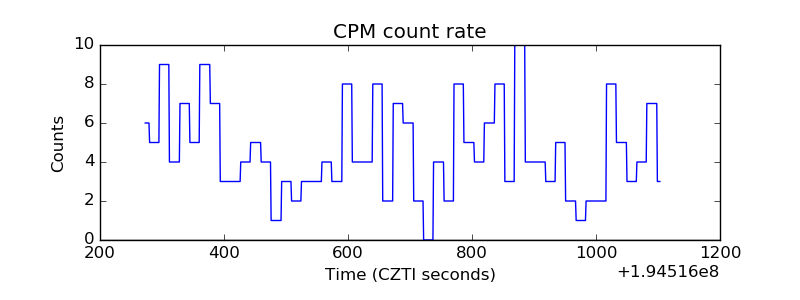 |
| CZT Counter | 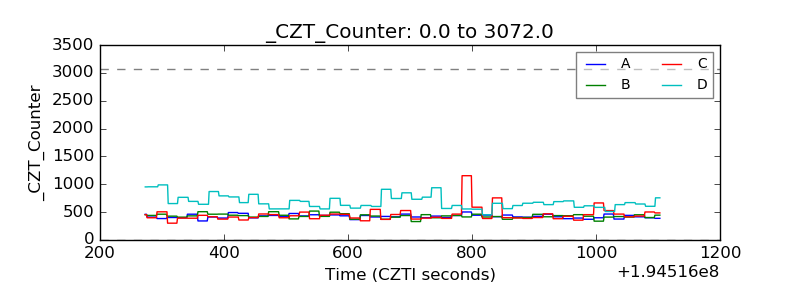 |
| +2.5 Volts monitor |  |
| +5 Volts monitor |  |
| _ROLL_ROT | 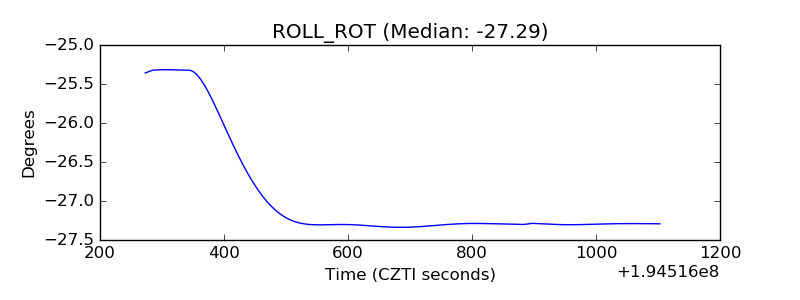 |
| _Roll_DEC | 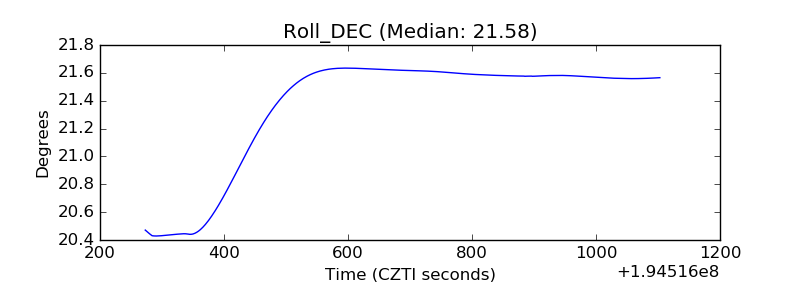 |
| _Roll_RA | 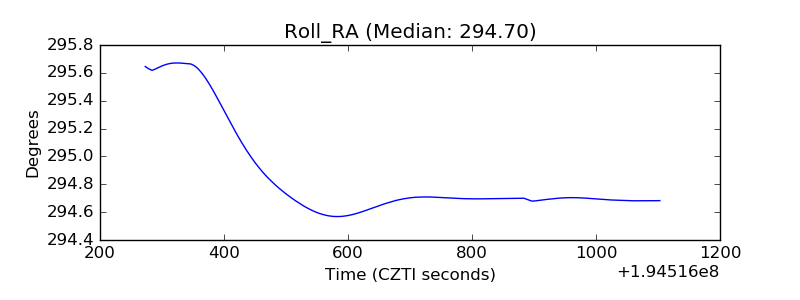 |
| Veto Counter | 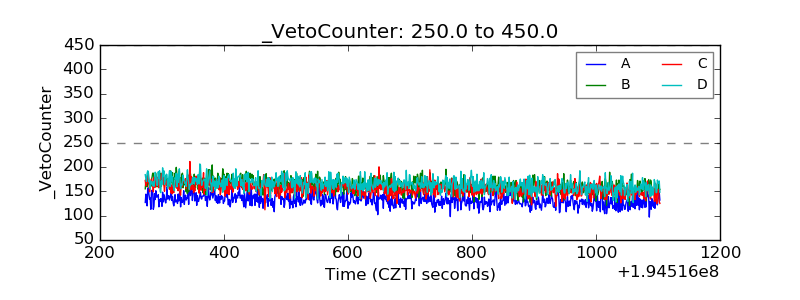 |