| Param | Original file | Final file |
|---|---|---|
| Filename | modeM0/AS1T01_040T01_9000000354cztM0_level2.fits | modeM0/AS1T01_040T01_9000000354cztM0_level2_quad_clean.evt |
| Size (bytes) | 208,802,880 | 239,904,000 |
| Size | 199.1 MB | 228.8 MB |
| Events in quadrant A | 1,304,352 | 1,538,305 |
| Events in quadrant B | 1,177,236 | 1,439,035 |
| Events in quadrant C | 1,239,164 | 1,424,908 |
| Events in quadrant D | 1,085,796 | 1,347,676 |
| Mode M0 | |||
|---|---|---|---|
| Quadrant | BADHDUFLAG | Total packets | Discarded packets |
| A | 0 | 45586 | 0 |
| B | 0 | 85576 | 0 |
| C | 0 | 57138 | 0 |
| D | 0 | 46612 | 0 |
| Mode M9 | |||
|---|---|---|---|
| Quadrant | BADHDUFLAG | Total packets | Discarded packets |
| A | 0 | 60 | 0 |
| B | 0 | 60 | 0 |
| C | 0 | 60 | 0 |
| D | 0 | 60 | 0 |
| Mode SS | |||
|---|---|---|---|
| Quadrant | BADHDUFLAG | Total packets | Discarded packets |
| A | 0 | 450 | 0 |
| B | 0 | 450 | 0 |
| C | 0 | 450 | 0 |
| D | 0 | 450 | 0 |
| Quadrant | Total seconds | Saturated seconds | Saturation percentage |
|---|---|---|---|
| A | 22016 | 429 | 1.948583% |
| B | 22016 | 3265 | 14.830124% |
| C | 22016 | 838 | 3.806323% |
| D | 22016 | 372 | 1.689680% |
Noise dominated data is calculated using 1-second bins in cleaned event files. If a bin has >2000 counts, and if more than 50% of those come from <1% of pixels, then it is considered to be noise-dominated and hence unusable.
| Quadrant | # 1 sec bins | Bins with >0 counts | Bins with >2000 counts | High rate bins dominated by noise | Noise dominated (total time) | Noise dominated (detector-on time) | Marked lightcurve |
|---|---|---|---|---|---|---|---|
| A | 28030 | 22009 | 0 | 0 | 0.00% | 0.00% | 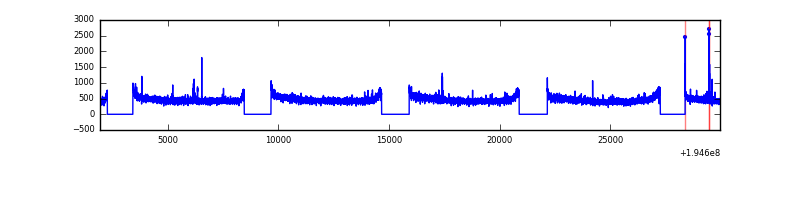 |
| B | 28030 | 22010 | 0 | 0 | 0.00% | 0.00% | 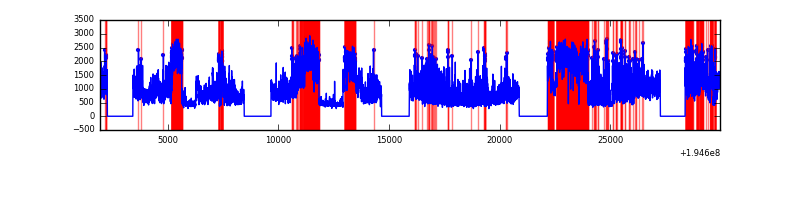 |
| C | 28030 | 22006 | 0 | 0 | 0.00% | 0.00% | 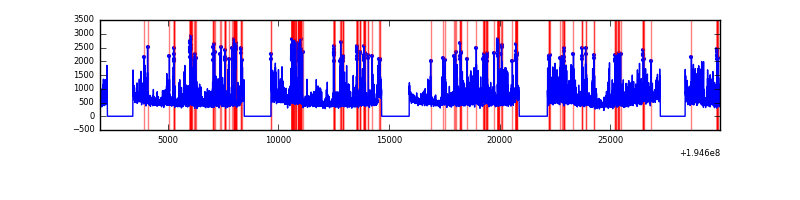 |
| D | 28030 | 22010 | 0 | 0 | 0.00% | 0.00% |  |
Top three noisy pixels from each quadrant. If the there are fewer than three noisy pixels in the level2.evt file, extra rows are filled as -1
| Pixel properties | Quadrant properties | ||||||
|---|---|---|---|---|---|---|---|
| Quadrant | DetID | PixID | Counts | Sigma | Mean | Median | Sigma |
| A | 14 | 188 | 1253 | 10.68 | 338 | 319 | 87.4 |
| A | 0 | 29 | 1144 | 9.44 | 338 | 319 | 87.4 |
| A | 7 | 110 | 1105 | 8.99 | 338 | 319 | 87.4 |
| B | 2 | 9 | 1018 | 11.62 | 310 | 297 | 62.0 |
| B | 12 | 226 | 887 | 9.51 | 310 | 297 | 62.0 |
| B | 14 | 254 | 821 | 8.45 | 310 | 297 | 62.0 |
| C | 7 | 111 | 912 | 6.97 | 327 | 305 | 87.0 |
| C | 9 | 188 | 899 | 6.82 | 327 | 305 | 87.0 |
| C | 1 | 80 | 826 | 5.99 | 327 | 305 | 87.0 |
| D | 11 | 82 | 836 | 6.44 | 309 | 283 | 85.9 |
| D | 6 | 44 | 797 | 5.98 | 309 | 283 | 85.9 |
| D | 6 | 114 | 773 | 5.7 | 309 | 283 | 85.9 |
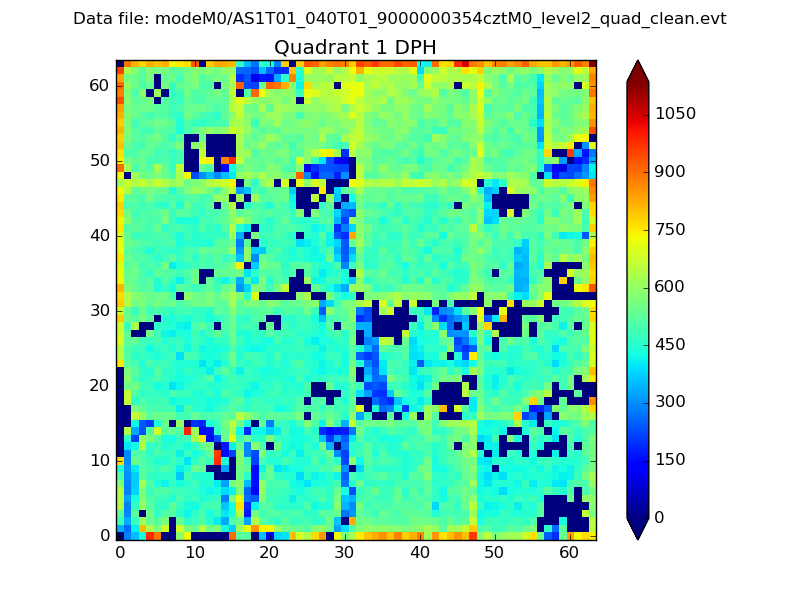
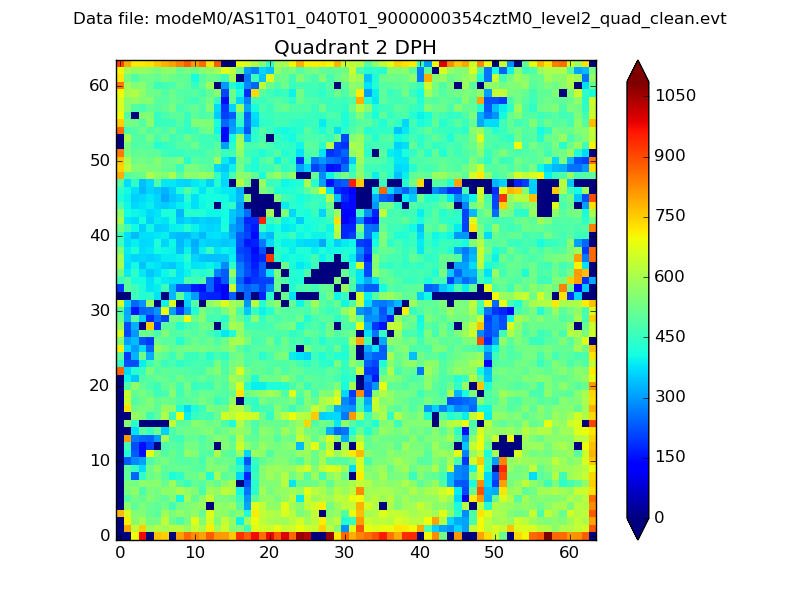
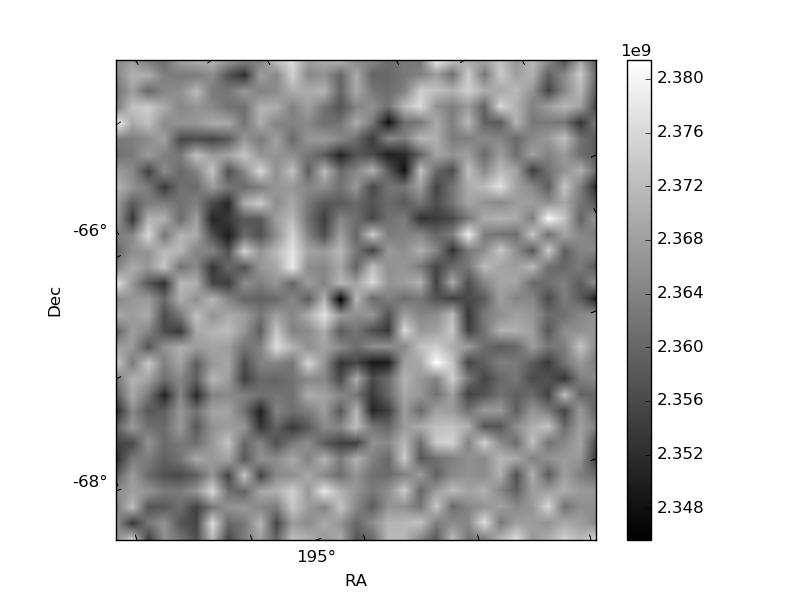
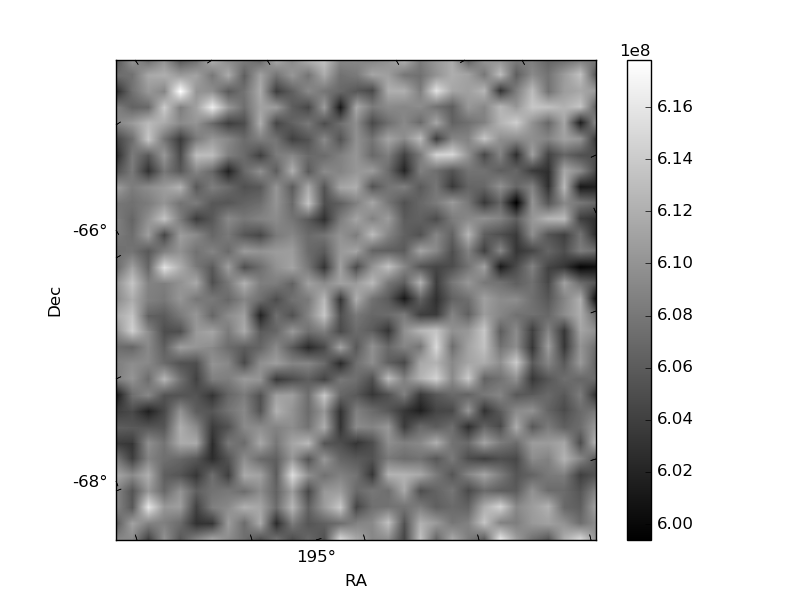
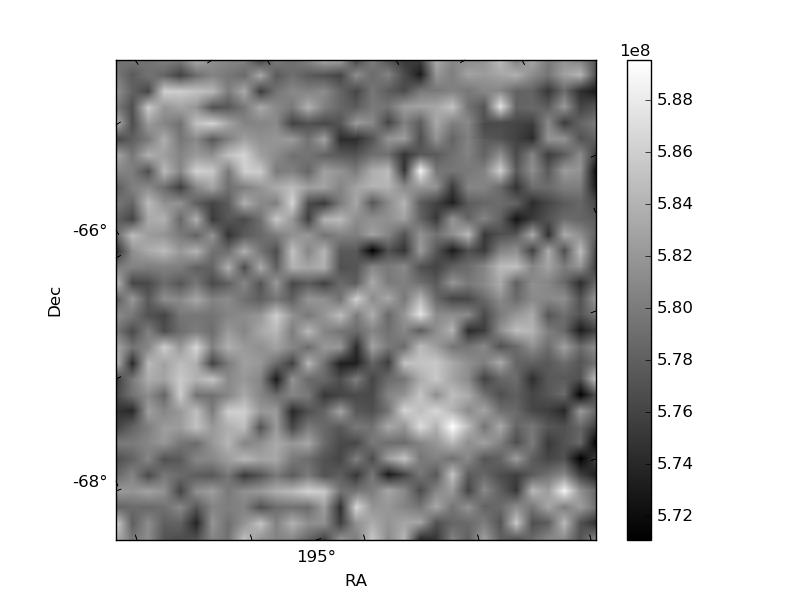
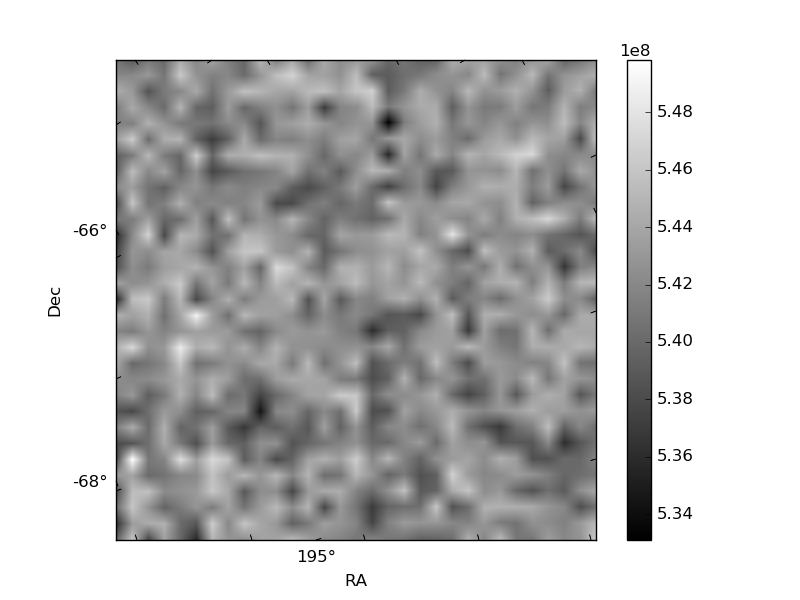
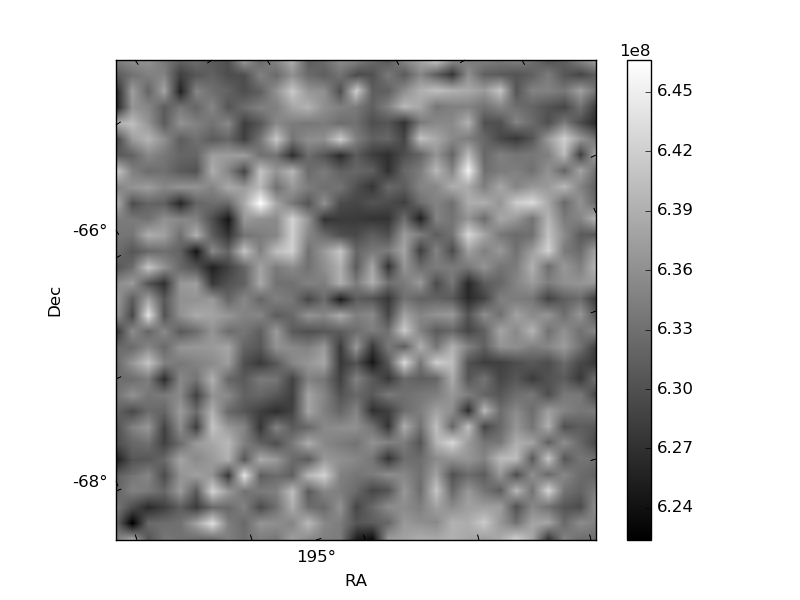
Histogram calculated using DETX and DETY for each event in the final _common_clean file
| Quadrant A | 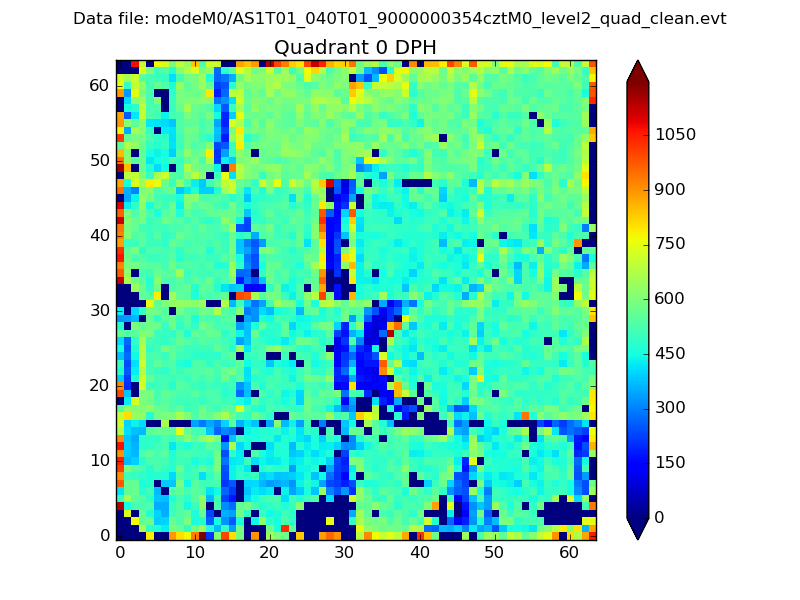 |
 |
Quadrant B |
|---|---|---|---|
| Quadrant D | 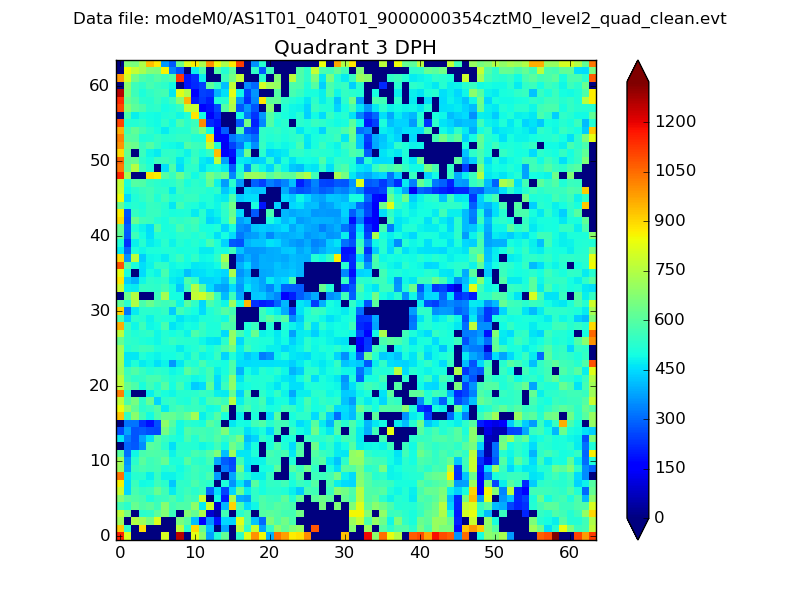 |
 |
Quadrant C |
| Plot type | Count rate plots | Images |
|---|---|---|
| Comparison with Poisson distribution Blue bars denote a histogram of data divided into 1 sec bins. Red curve is a Poisson curve with rate = median count rate of data. |
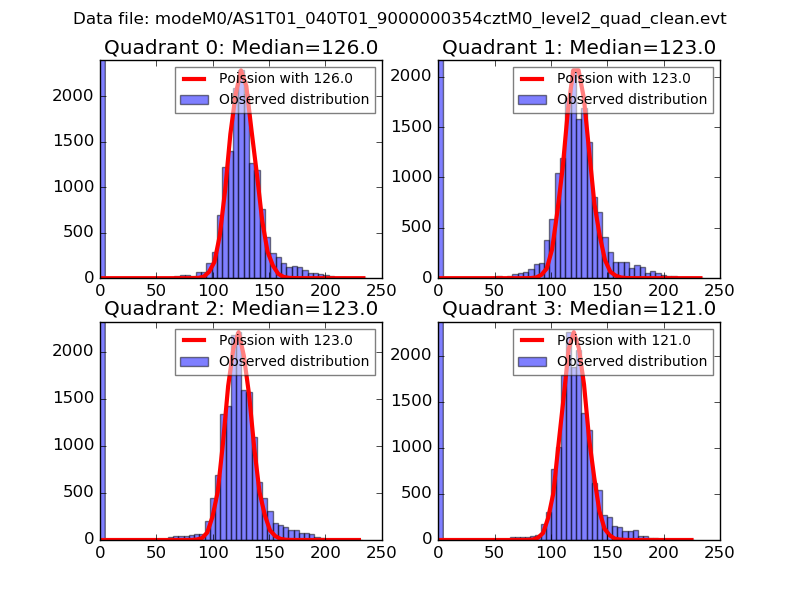 |
 |
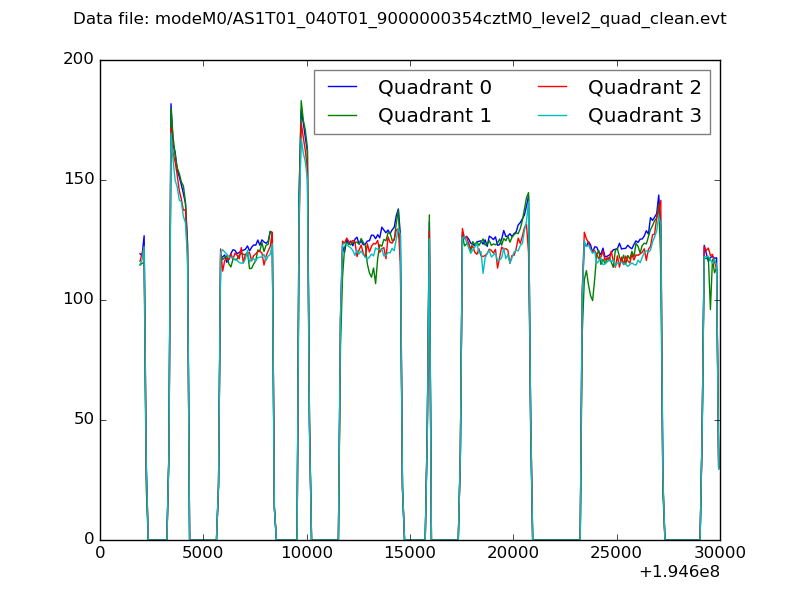
| Quadrant-wise count rates Data is divided into 100 sec bins |
 |
|
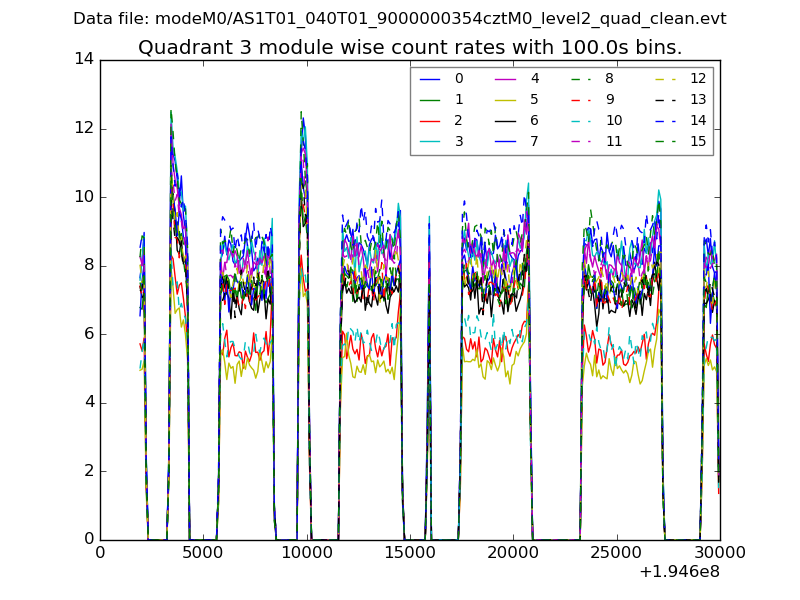
| Module-wise count rates for Quadrant A Data is divided into 100 sec bins |
 |
 |
| Module-wise count rates for Quadrant B Data is divided into 100 sec bins |
 |
 |
| Module-wise count rates for Quadrant C Data is divided into 100 sec bins |
 |
 |
| Module-wise count rates for Quadrant D Data is divided into 100 sec bins |
 |
 |
| Parameter | Plot |
|---|---|
| CZT HV Monitor | 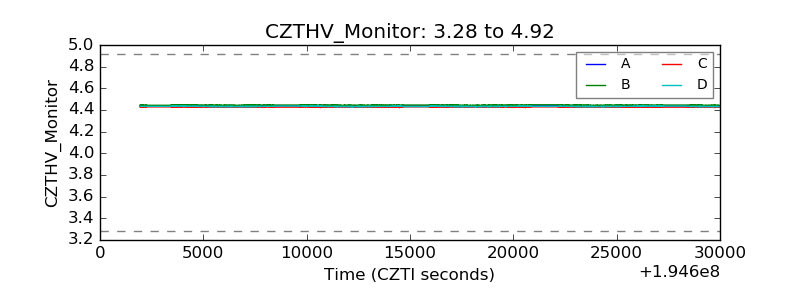 |
| D_VDD | 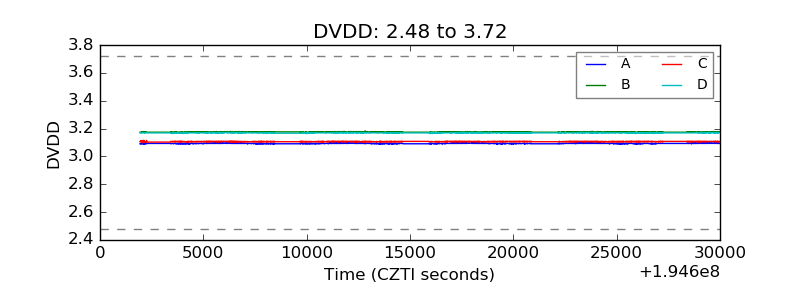 |
| Temperature 1 | 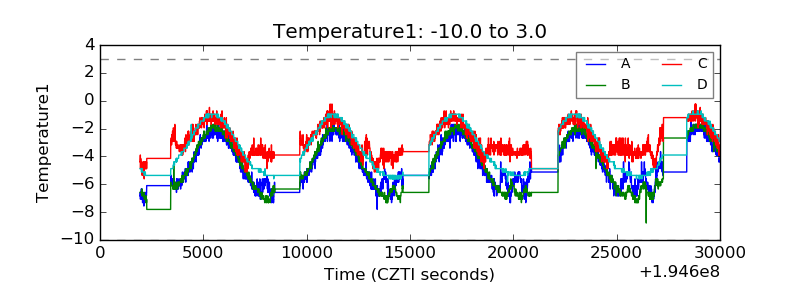 |
| Veto HV Monitor | 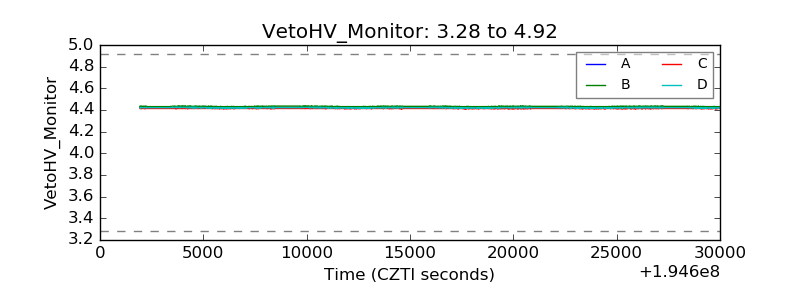 |
| Veto LLD | 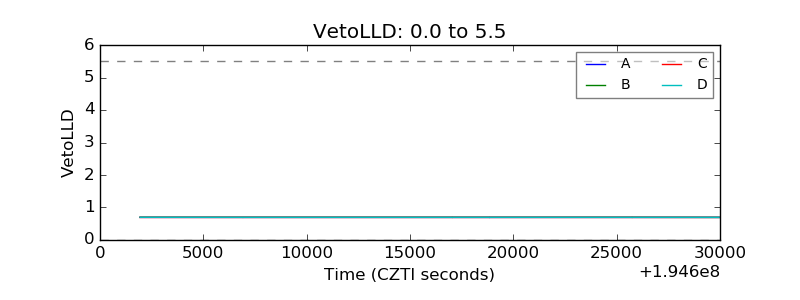 |
| Alpha Counter | 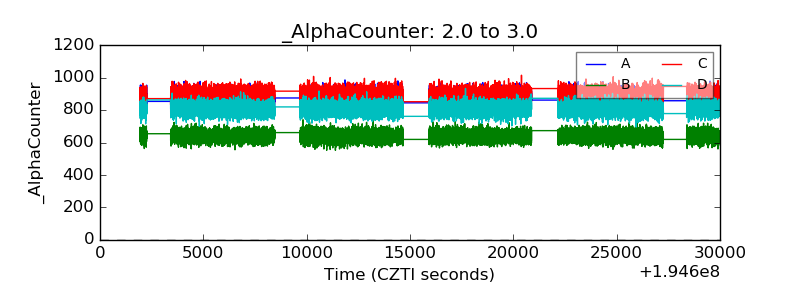 |
| _CPM_Rate | 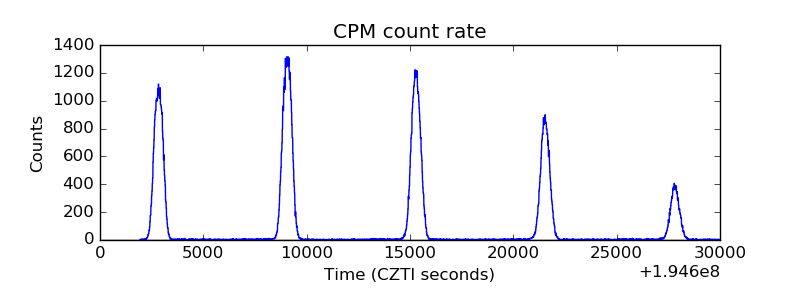 |
| CZT Counter | 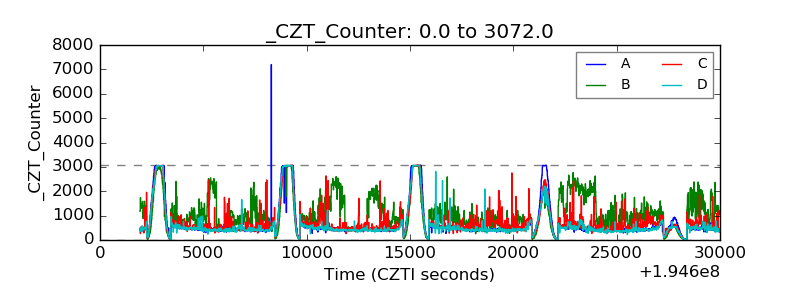 |
| +2.5 Volts monitor | 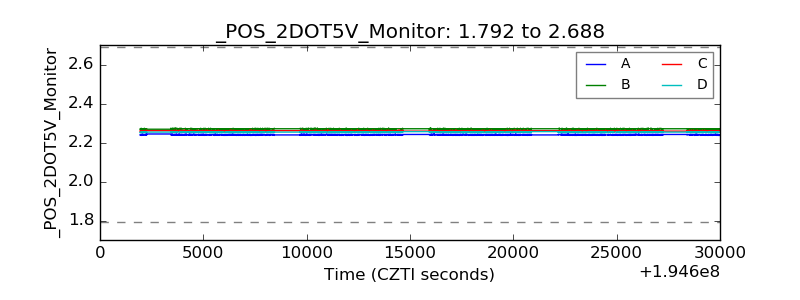 |
| +5 Volts monitor | 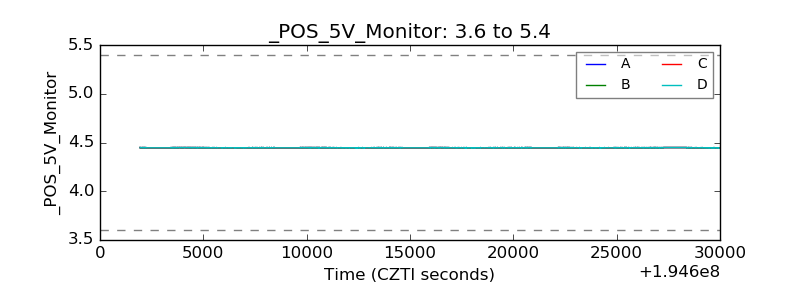 |
| _ROLL_ROT |  |
| _Roll_DEC | 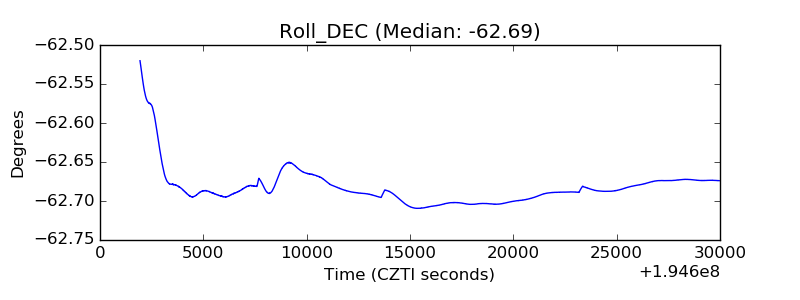 |
| _Roll_RA | 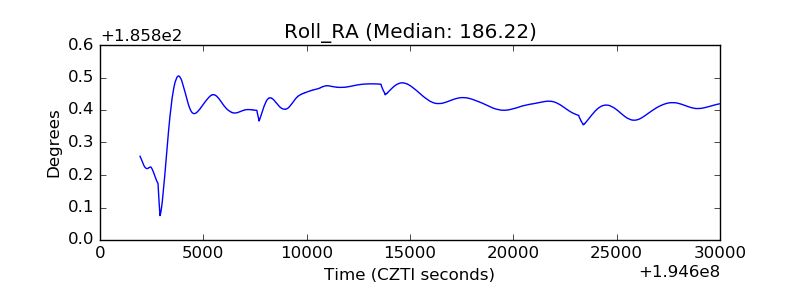 |
| Veto Counter |  |