| Param | Original file | Final file |
|---|---|---|
| Filename | modeM0/AS1T01_040T01_9000000354_02314cztM0_level2.evt | modeM0/AS1T01_040T01_9000000354_02314cztM0_level2_quad_clean.evt |
| Size (bytes) | 546,874,560 | 77,359,680 |
| Size | 521.5 MB | 73.8 MB |
| Events in quadrant A | 2,992,211 | 487,313 |
| Events in quadrant B | 6,051,376 | 478,521 |
| Events in quadrant C | 4,078,072 | 470,331 |
| Events in quadrant D | 3,013,070 | 465,797 |
| Mode M0 | |||
|---|---|---|---|
| Quadrant | BADHDUFLAG | Total packets | Discarded packets |
| A | 0 | 13163 | 3 |
| B | 0 | 22493 | 2 |
| C | 0 | 16381 | 2 |
| D | 0 | 13336 | 2 |
| Mode M9 | |||
|---|---|---|---|
| Quadrant | BADHDUFLAG | Total packets | Discarded packets |
| A | 0 | 15 | 0 |
| B | 0 | 15 | 0 |
| C | 0 | 15 | 0 |
| D | 0 | 16 | 0 |
| Mode SS | |||
|---|---|---|---|
| Quadrant | BADHDUFLAG | Total packets | Discarded packets |
| A | 0 | 128 | 0 |
| B | 0 | 128 | 0 |
| C | 0 | 128 | 0 |
| D | 0 | 128 | 0 |
| Quadrant | Total seconds | Saturated seconds | Saturation percentage |
|---|---|---|---|
| A | 6309 | 94 | 1.489935% |
| B | 6309 | 506 | 8.020288% |
| C | 6309 | 229 | 3.629735% |
| D | 6309 | 75 | 1.188778% |
Noise dominated data is calculated using 1-second bins in cleaned event files. If a bin has >2000 counts, and if more than 50% of those come from <1% of pixels, then it is considered to be noise-dominated and hence unusable.
| Quadrant | # 1 sec bins | Bins with >0 counts | Bins with >2000 counts | High rate bins dominated by noise | Noise dominated (total time) | Noise dominated (detector-on time) | Marked lightcurve |
|---|---|---|---|---|---|---|---|
| A | 7518 | 6308 | 0 | 0 | 0.00% | 0.00% | 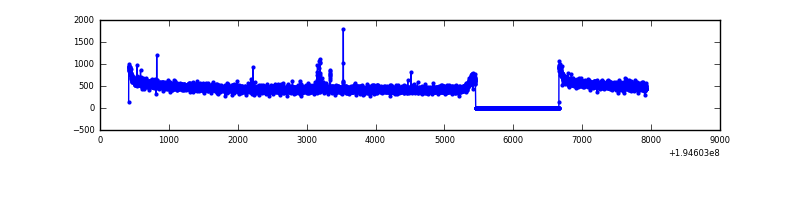 |
| B | 7518 | 6308 | 389 | 389 | 5.17% | 6.17% | 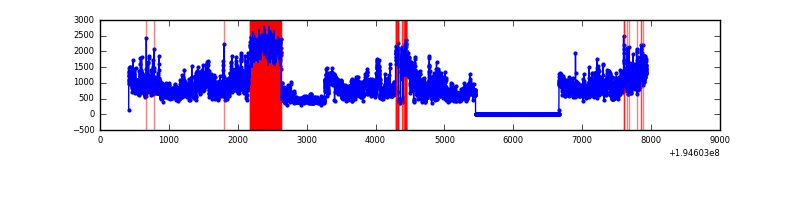 |
| C | 7518 | 6308 | 126 | 126 | 1.68% | 2.00% | 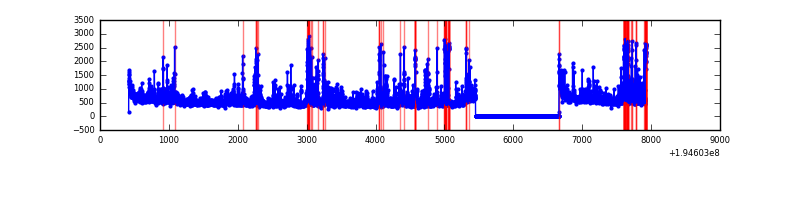 |
| D | 7518 | 6308 | 1 | 1 | 0.01% | 0.02% | 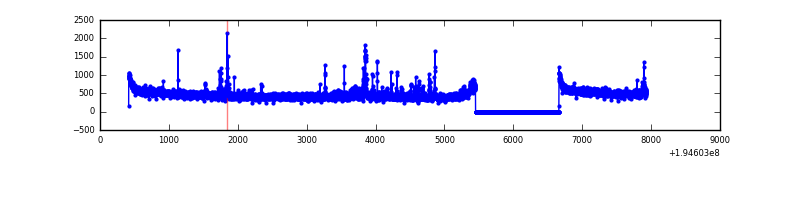 |
Top three noisy pixels from each quadrant. If the there are fewer than three noisy pixels in the level2.evt file, extra rows are filled as -1
| Pixel properties | Quadrant properties | ||||||
|---|---|---|---|---|---|---|---|
| Quadrant | DetID | PixID | Counts | Sigma | Mean | Median | Sigma |
| A | 0 | 149 | 20543 | 129.52 | 771 | 756 | 152.8 |
| A | 0 | 226 | 10257 | 62.19 | 771 | 756 | 152.8 |
| A | 12 | 194 | 8633 | 51.56 | 771 | 756 | 152.8 |
| B | 0 | 85 | 3040996 | 21363.15 | 767 | 750 | 142.3 |
| B | 4 | 48 | 34926 | 240.15 | 767 | 750 | 142.3 |
| B | 8 | 3 | 13191 | 87.42 | 767 | 750 | 142.3 |
| C | 5 | 234 | 716728 | 4205.87 | 742 | 748 | 170.2 |
| C | 14 | 223 | 444099 | 2604.37 | 742 | 748 | 170.2 |
| C | 10 | 65 | 6751 | 35.26 | 742 | 748 | 170.2 |
| D | 8 | 195 | 122607 | 698.91 | 745 | 728 | 174.4 |
| D | 13 | 169 | 25852 | 144.07 | 745 | 728 | 174.4 |
| D | 2 | 31 | 15344 | 83.81 | 745 | 728 | 174.4 |
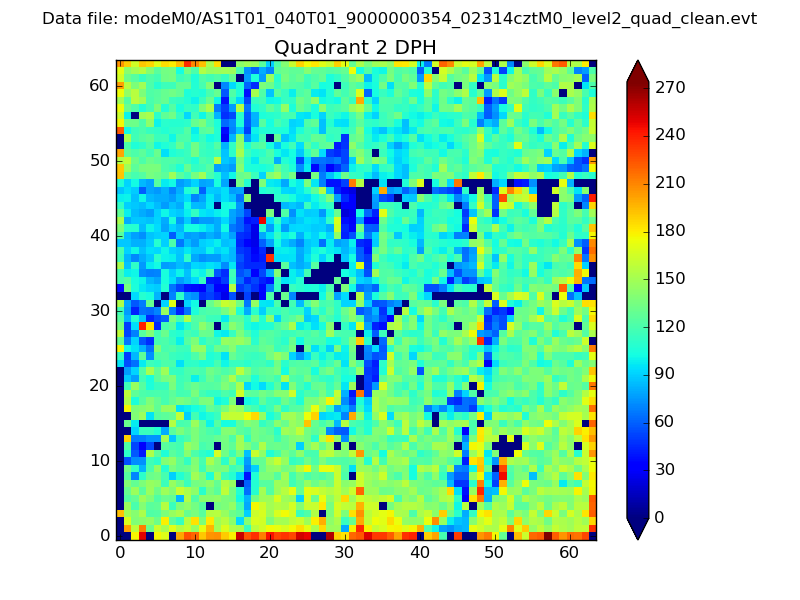
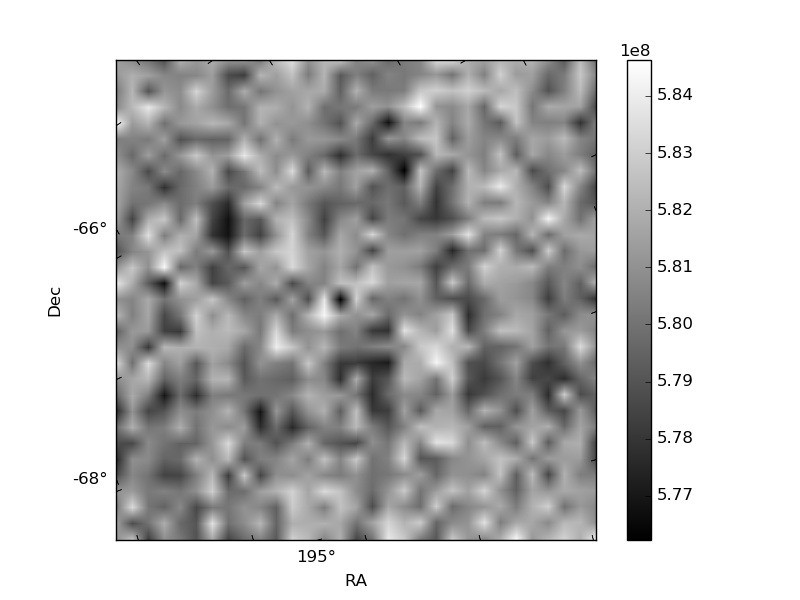
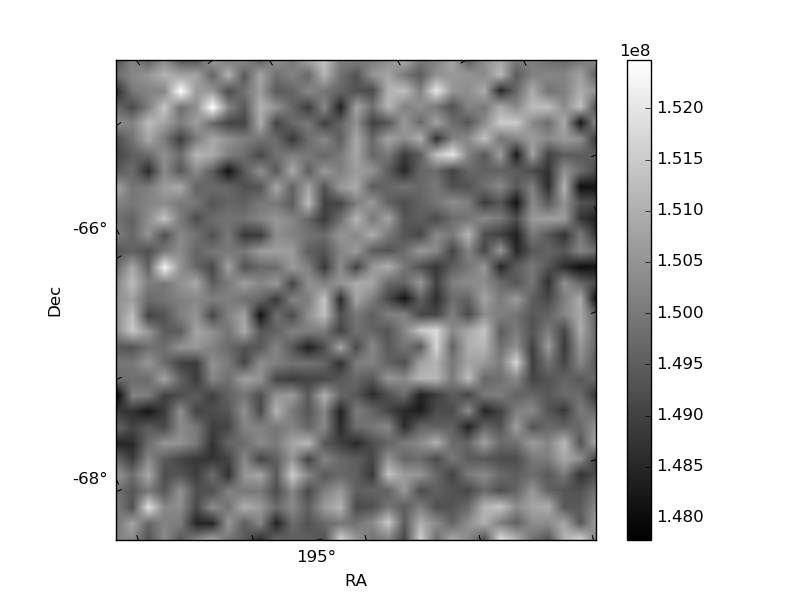
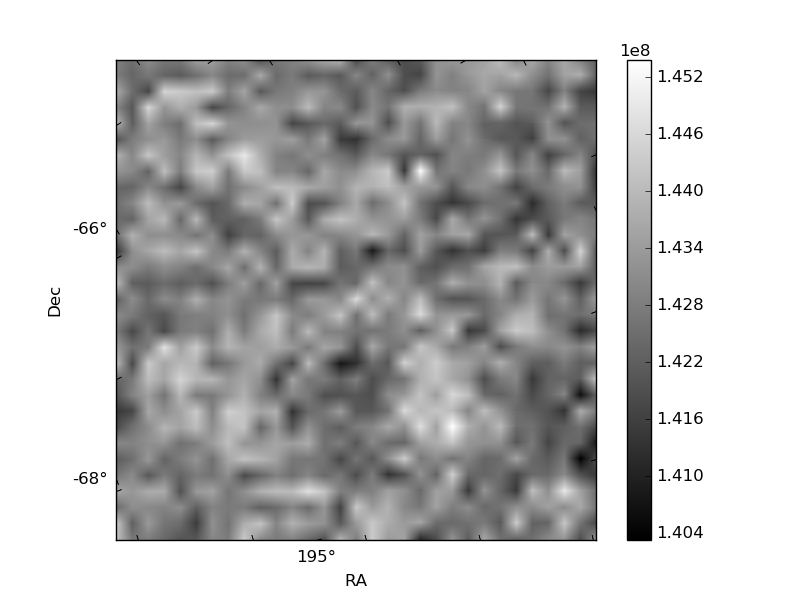
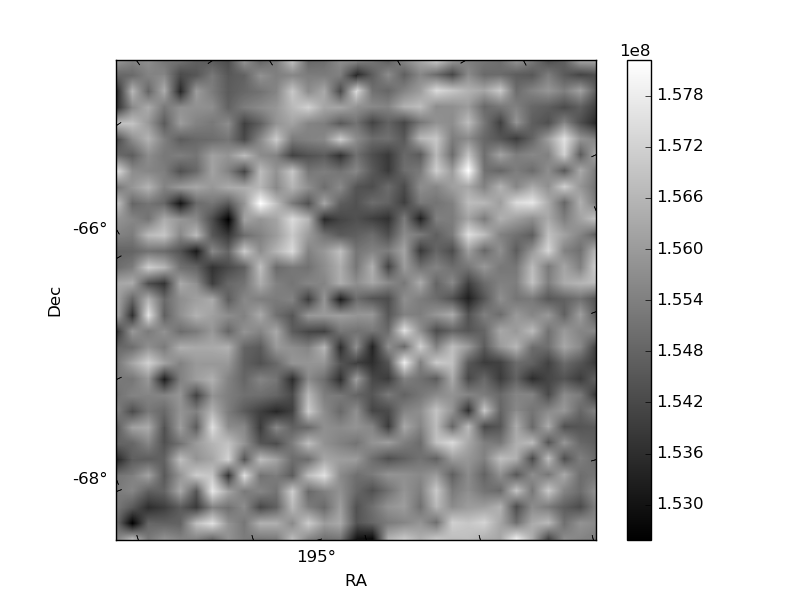
Histogram calculated using DETX and DETY for each event in the final _common_clean file
| Quadrant A | 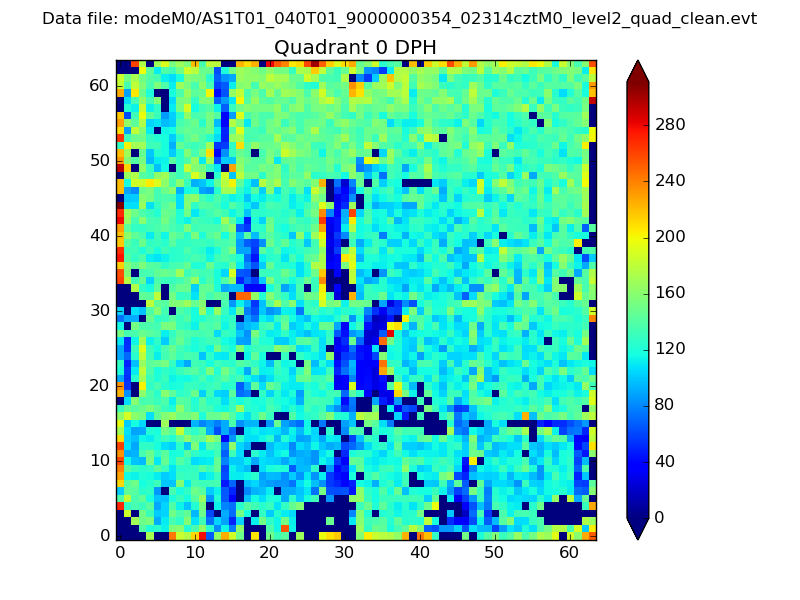 |
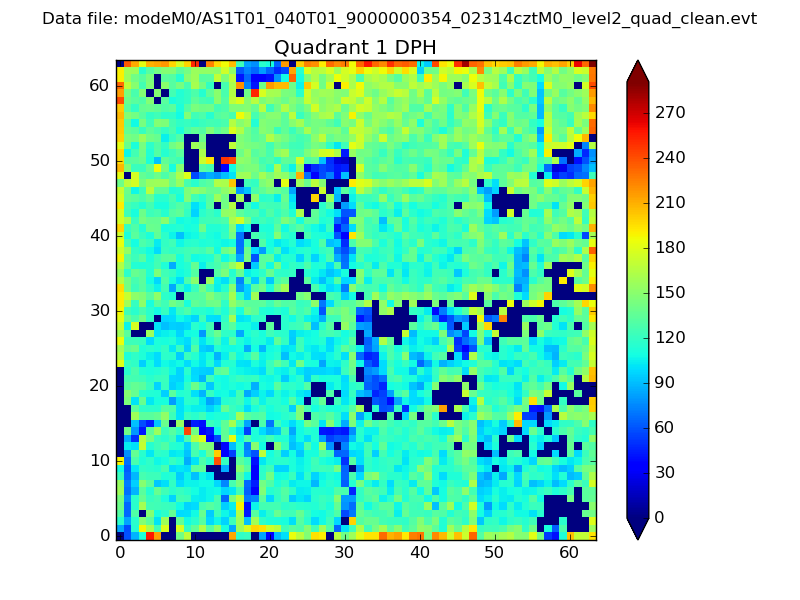 |
Quadrant B |
|---|---|---|---|
| Quadrant D | 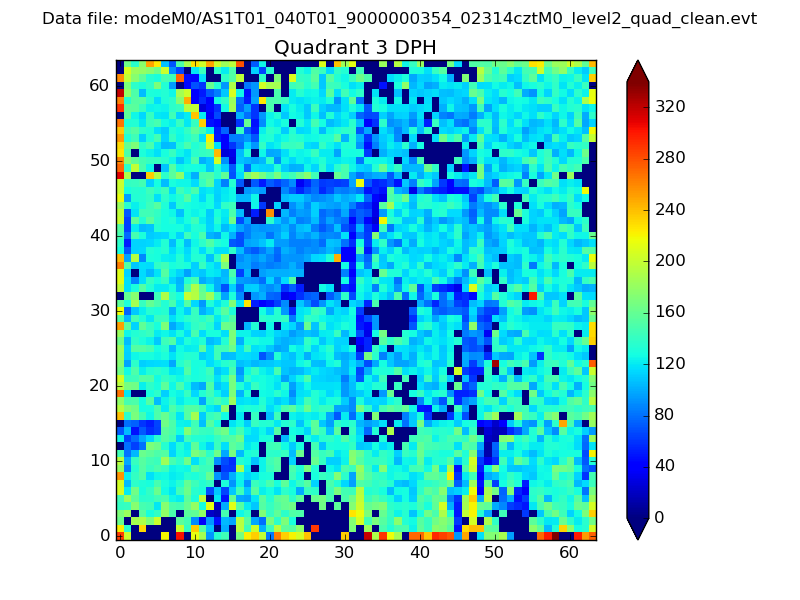 |
 |
Quadrant C |
| Plot type | Count rate plots | Images |
|---|---|---|
| Comparison with Poisson distribution Blue bars denote a histogram of data divided into 1 sec bins. Red curve is a Poisson curve with rate = median count rate of data. |
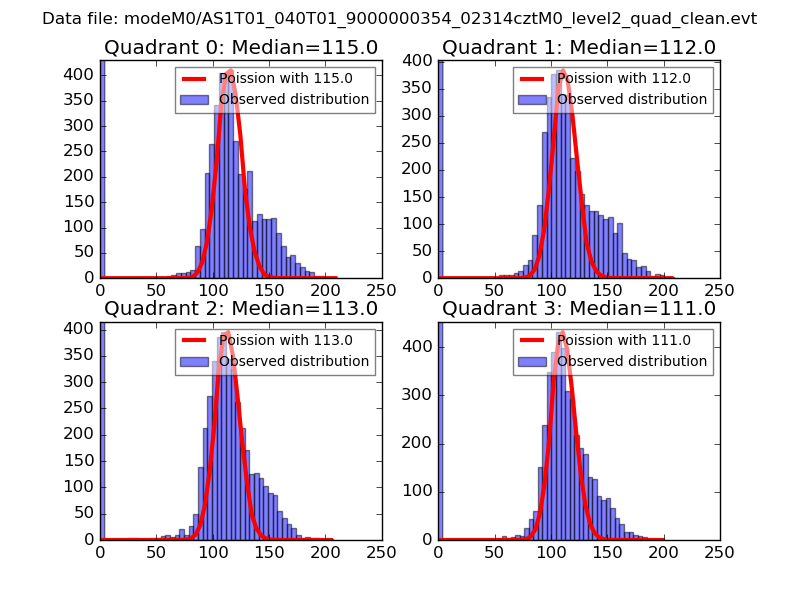 |
 |
| Quadrant-wise count rates Data is divided into 100 sec bins |
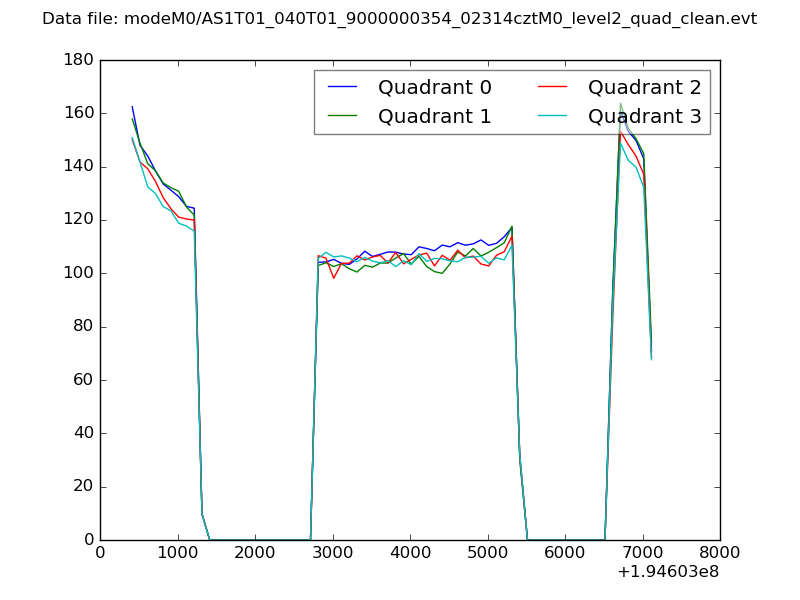 |
|
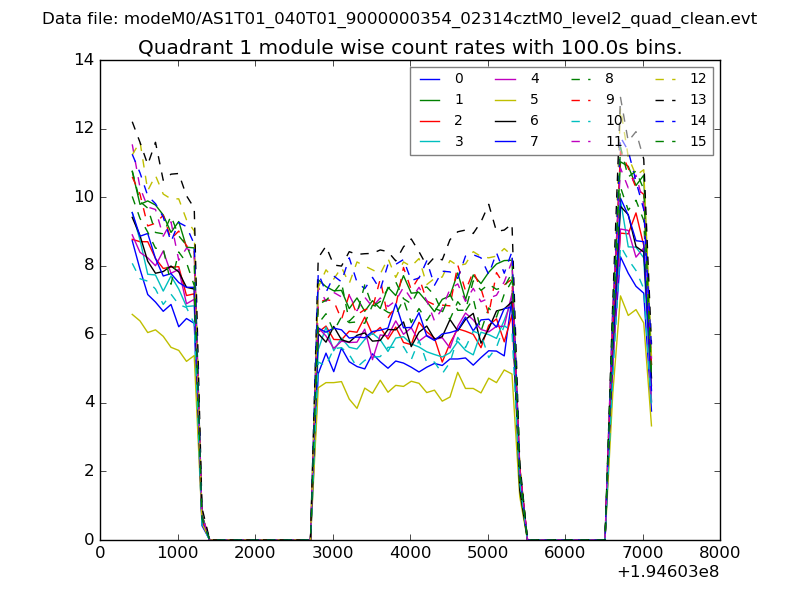
| Module-wise count rates for Quadrant A Data is divided into 100 sec bins |
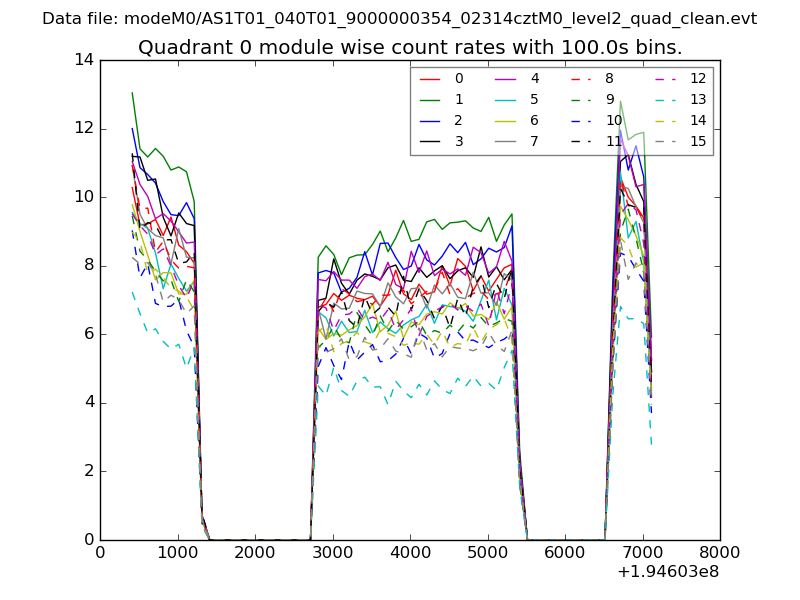 |
 |
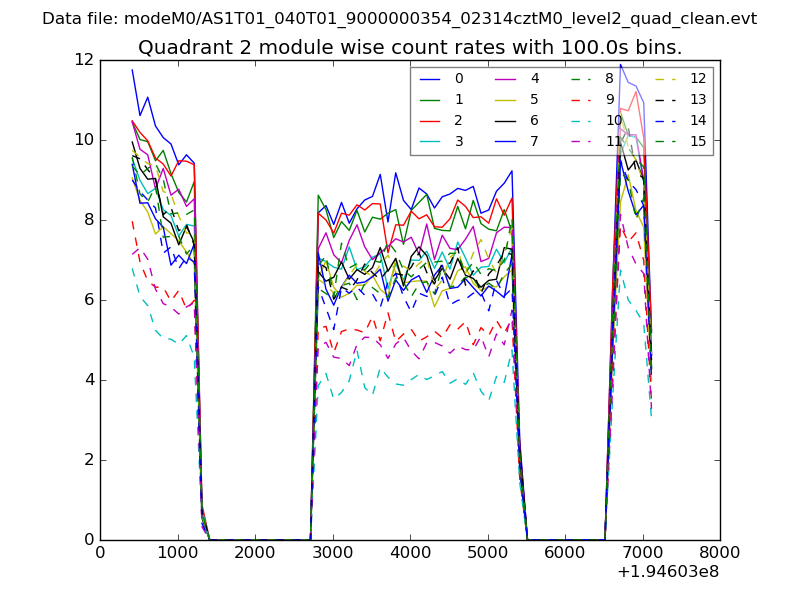
| Module-wise count rates for Quadrant B Data is divided into 100 sec bins |
 |
 |
| Module-wise count rates for Quadrant C Data is divided into 100 sec bins |
 |
 |
| Module-wise count rates for Quadrant D Data is divided into 100 sec bins |
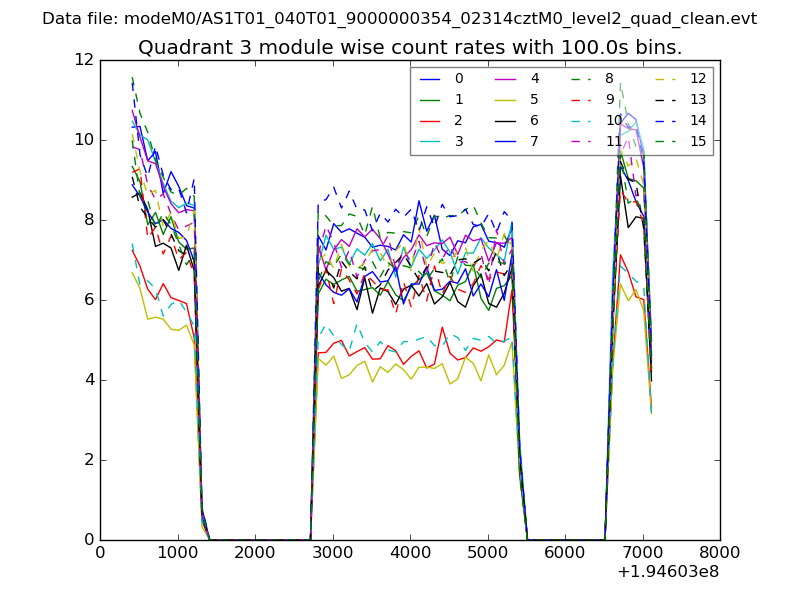 |
 |
| Parameter | Plot |
|---|---|
| CZT HV Monitor | 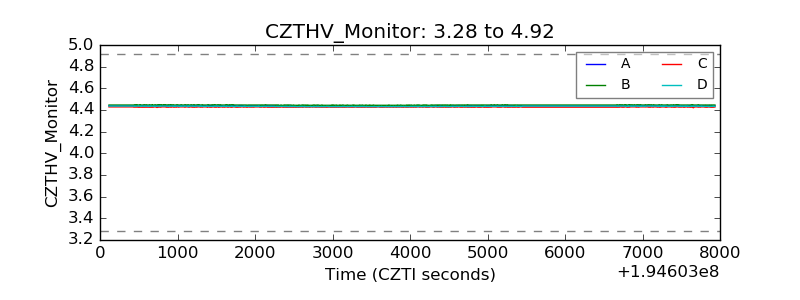 |
| D_VDD | 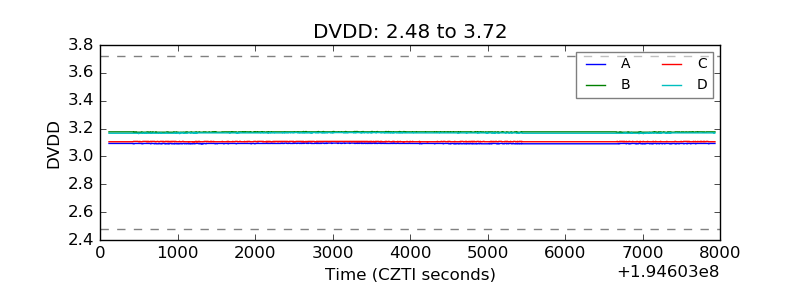 |
| Temperature 1 | 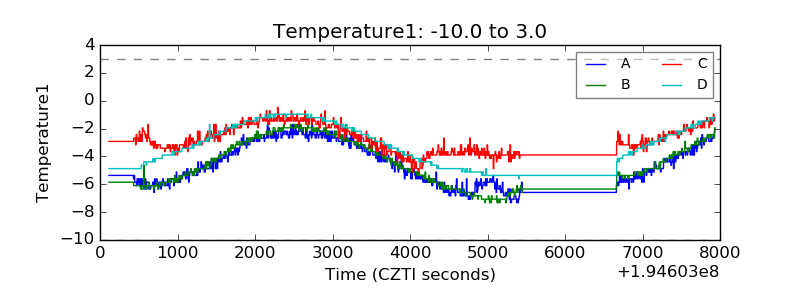 |
| Veto HV Monitor | 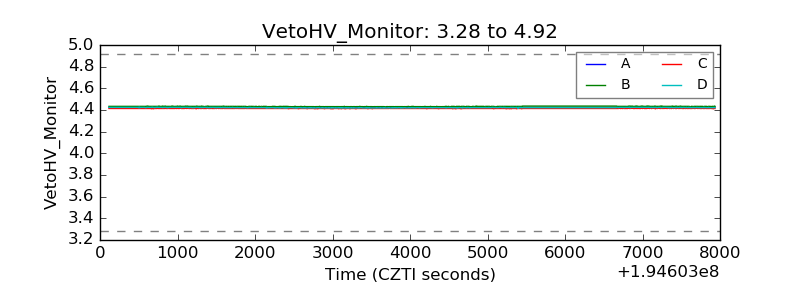 |
| Veto LLD | 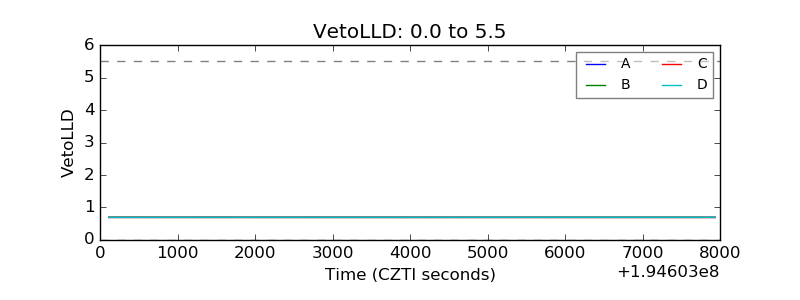 |
| Alpha Counter | 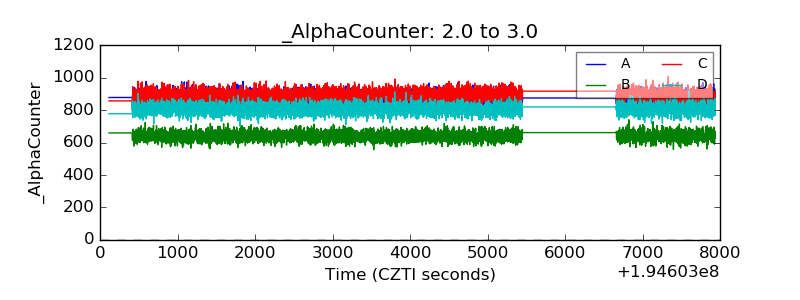 |
| _CPM_Rate | 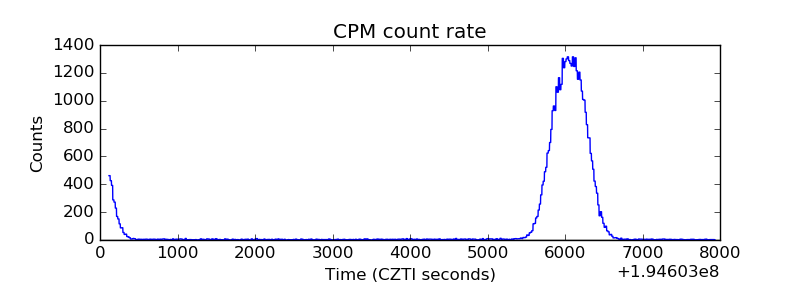 |
| CZT Counter | 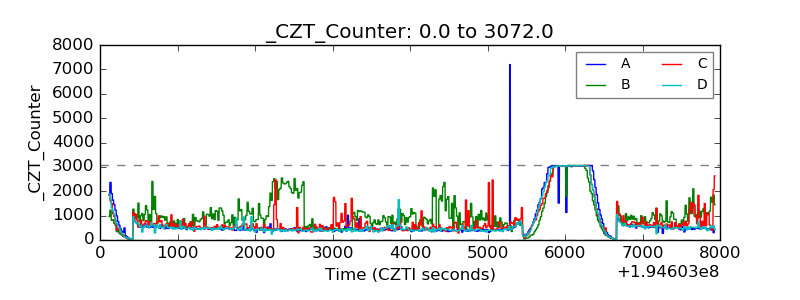 |
| +2.5 Volts monitor | 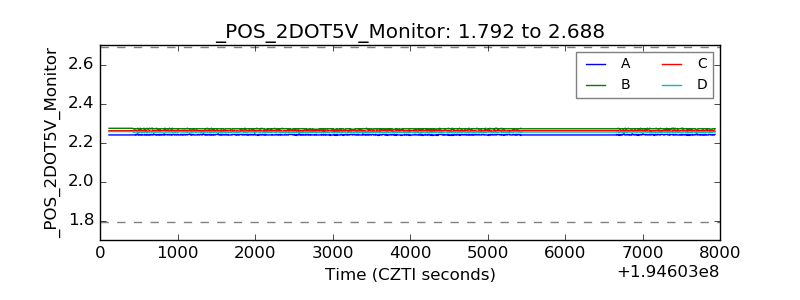 |
| +5 Volts monitor | 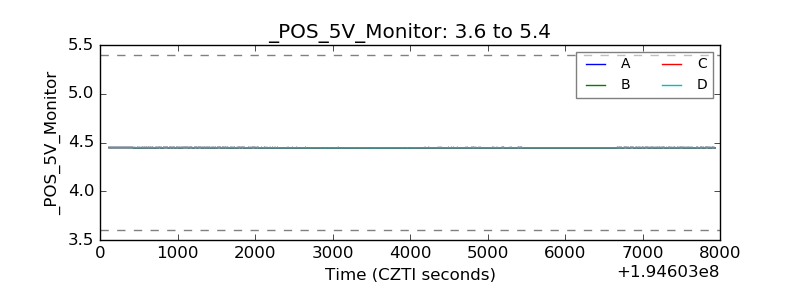 |
| _ROLL_ROT | 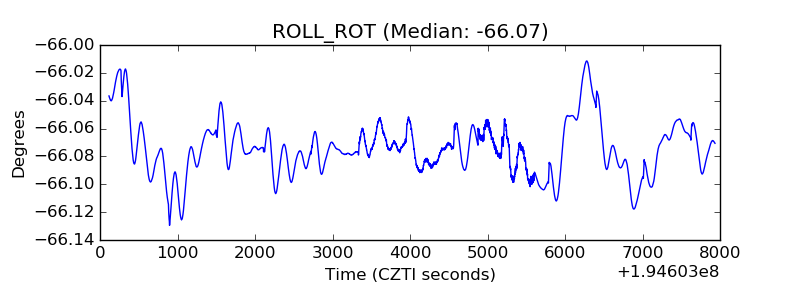 |
| _Roll_DEC | 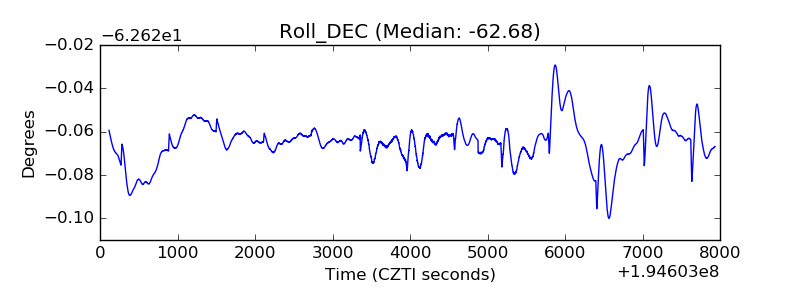 |
| _Roll_RA | 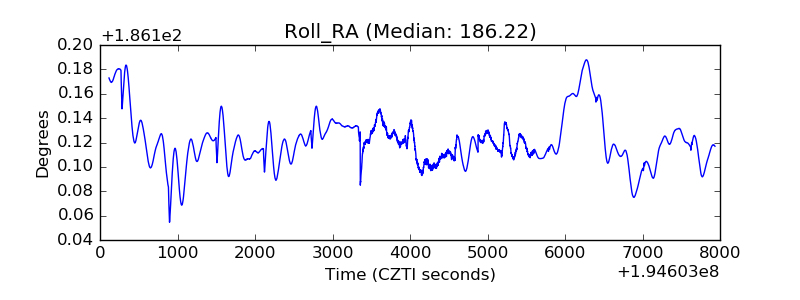 |
| Veto Counter | 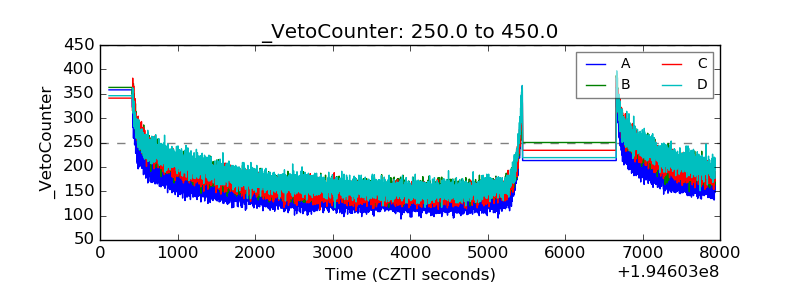 |