| Param | Original file | Final file |
|---|---|---|
| Filename | modeM0/AS1T01_056T01_9000000356cztM0_level2.fits | modeM0/AS1T01_056T01_9000000356cztM0_level2_quad_clean.evt |
| Size (bytes) | 1,236,090,240 | 1,321,292,160 |
| Size | 1.2 GB | 1.2 GB |
| Events in quadrant A | 7,473,226 | 8,052,045 |
| Events in quadrant B | 7,064,210 | 7,909,179 |
| Events in quadrant C | 7,248,860 | 7,651,503 |
| Events in quadrant D | 6,286,114 | 7,046,698 |
| Mode M9 | |||
|---|---|---|---|
| Quadrant | BADHDUFLAG | Total packets | Discarded packets |
| A | 0 | 186 | 0 |
| B | 0 | 186 | 0 |
| C | 0 | 186 | 0 |
| D | 0 | 186 | 0 |
| Mode M0 | |||
|---|---|---|---|
| Quadrant | BADHDUFLAG | Total packets | Discarded packets |
| A | 0 | 284835 | 0 |
| B | 0 | 377531 | 0 |
| C | 0 | 320218 | 0 |
| D | 0 | 294076 | 0 |
| Mode SS | |||
|---|---|---|---|
| Quadrant | BADHDUFLAG | Total packets | Discarded packets |
| A | 0 | 2774 | 0 |
| B | 0 | 2774 | 0 |
| C | 0 | 2774 | 0 |
| D | 0 | 2774 | 0 |
| Quadrant | Total seconds | Saturated seconds | Saturation percentage |
|---|---|---|---|
| A | 136596 | 1990 | 1.456851% |
| B | 136596 | 5890 | 4.311986% |
| C | 136596 | 3333 | 2.440042% |
| D | 136596 | 1661 | 1.215995% |
Noise dominated data is calculated using 1-second bins in cleaned event files. If a bin has >2000 counts, and if more than 50% of those come from <1% of pixels, then it is considered to be noise-dominated and hence unusable.
| Quadrant | # 1 sec bins | Bins with >0 counts | Bins with >2000 counts | High rate bins dominated by noise | Noise dominated (total time) | Noise dominated (detector-on time) | Marked lightcurve |
|---|---|---|---|---|---|---|---|
| A | 155170 | 136584 | 0 | 0 | 0.00% | 0.00% | 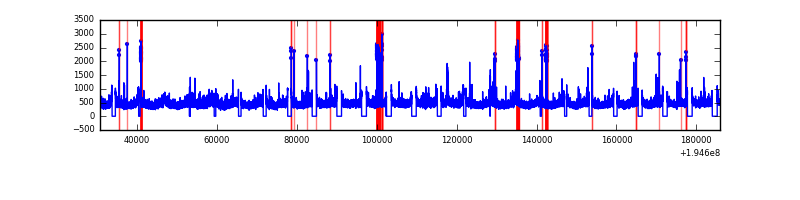 |
| B | 155170 | 136582 | 0 | 0 | 0.00% | 0.00% | 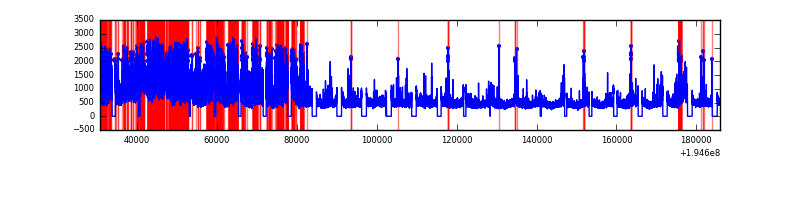 |
| C | 155170 | 136436 | 0 | 0 | 0.00% | 0.00% |  |
| D | 155170 | 136577 | 0 | 0 | 0.00% | 0.00% |  |
Top three noisy pixels from each quadrant. If the there are fewer than three noisy pixels in the level2.evt file, extra rows are filled as -1
| Pixel properties | Quadrant properties | ||||||
|---|---|---|---|---|---|---|---|
| Quadrant | DetID | PixID | Counts | Sigma | Mean | Median | Sigma |
| A | 14 | 188 | 7134 | 10.62 | 1936 | 1803 | 502.0 |
| A | 0 | 29 | 6981 | 10.31 | 1936 | 1803 | 502.0 |
| A | 7 | 110 | 6452 | 9.26 | 1936 | 1803 | 502.0 |
| B | 2 | 9 | 6123 | 11.99 | 1859 | 1766 | 363.3 |
| B | 12 | 226 | 5449 | 10.14 | 1859 | 1766 | 363.3 |
| B | 14 | 254 | 5111 | 9.21 | 1859 | 1766 | 363.3 |
| C | 2 | 191 | 4940 | 6.17 | 1920 | 1769 | 514.2 |
| C | 1 | 81 | 4807 | 5.91 | 1920 | 1769 | 514.2 |
| C | 1 | 80 | 4795 | 5.88 | 1920 | 1769 | 514.2 |
| D | 3 | 14 | 4752 | 6.21 | 1797 | 1624 | 504.0 |
| D | 11 | 82 | 4634 | 5.97 | 1797 | 1624 | 504.0 |
| D | 4 | 160 | 4583 | 5.87 | 1797 | 1624 | 504.0 |
Histogram calculated using DETX and DETY for each event in the final _common_clean file
| Quadrant A | 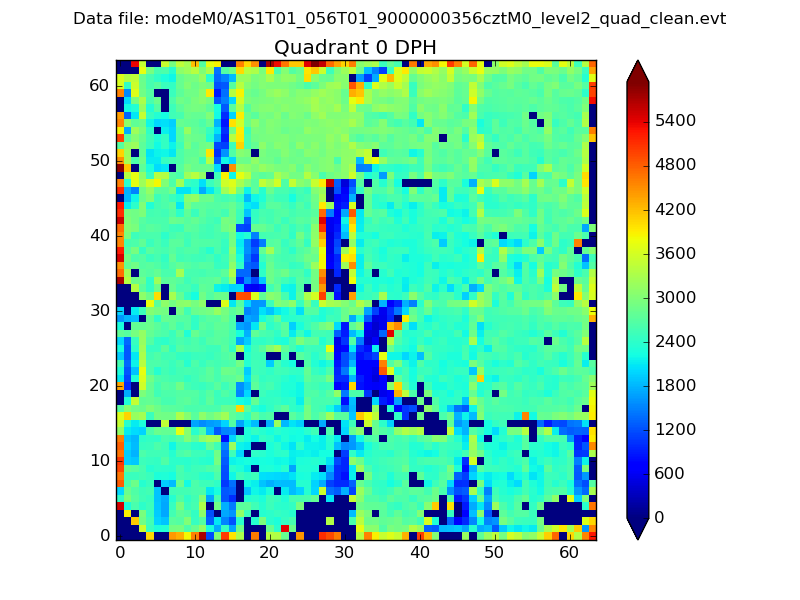 |
 |
Quadrant B |
|---|---|---|---|
| Quadrant D | 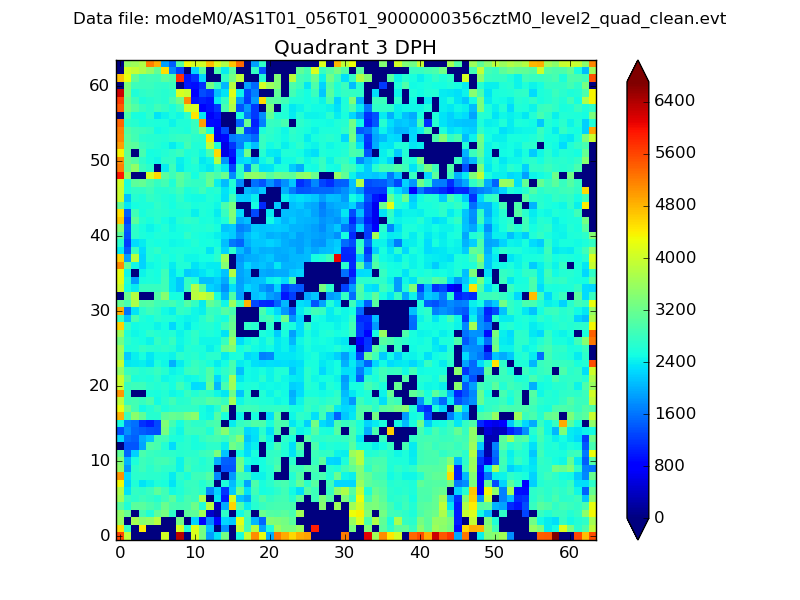 |
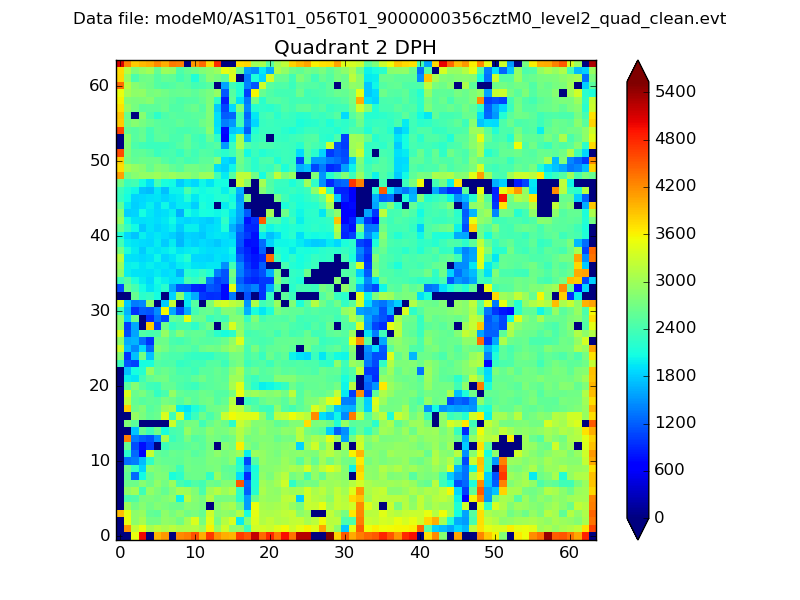 |
Quadrant C |
| Plot type | Count rate plots | Images |
|---|---|---|
| Comparison with Poisson distribution Blue bars denote a histogram of data divided into 1 sec bins. Red curve is a Poisson curve with rate = median count rate of data. |
 |
 |
| Quadrant-wise count rates Data is divided into 100 sec bins |
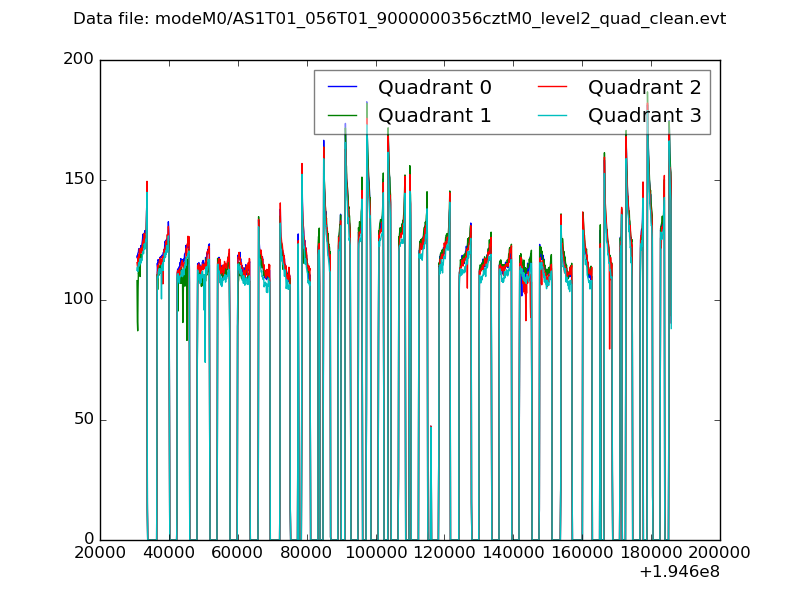 |
|
| Module-wise count rates for Quadrant A Data is divided into 100 sec bins |
 |
 |
| Module-wise count rates for Quadrant B Data is divided into 100 sec bins |
 |
 |
| Module-wise count rates for Quadrant C Data is divided into 100 sec bins |
 |
 |
| Module-wise count rates for Quadrant D Data is divided into 100 sec bins |
 |
 |
| Parameter | Plot |
|---|---|
| CZT HV Monitor | 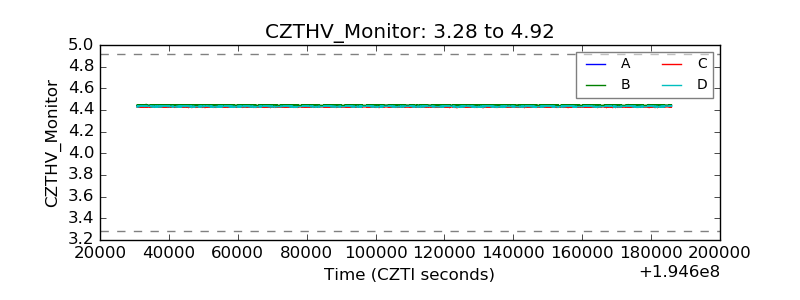 |
| D_VDD |  |
| Temperature 1 | 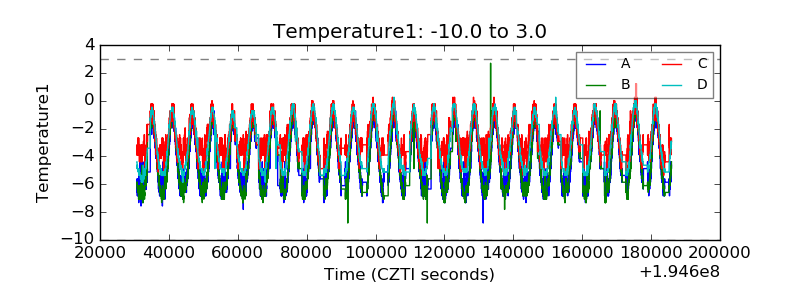 |
| Veto HV Monitor | 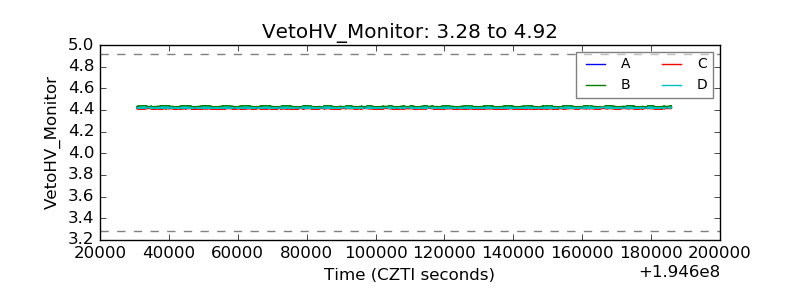 |
| Veto LLD |  |
| Alpha Counter |  |
| _CPM_Rate |  |
| CZT Counter |  |
| +2.5 Volts monitor |  |
| +5 Volts monitor | 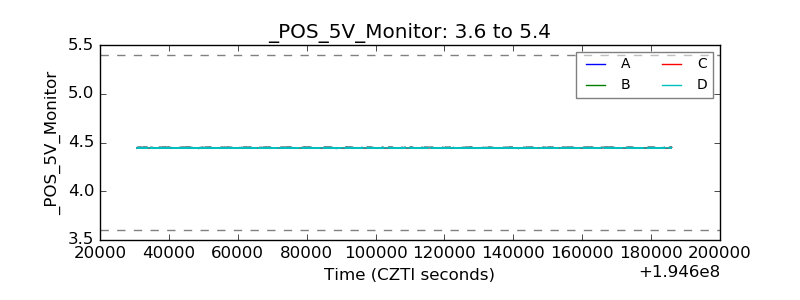 |
| _ROLL_ROT | 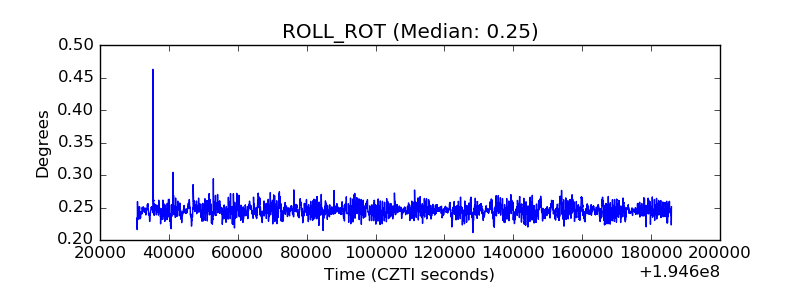 |
| _Roll_DEC |  |
| _Roll_RA | 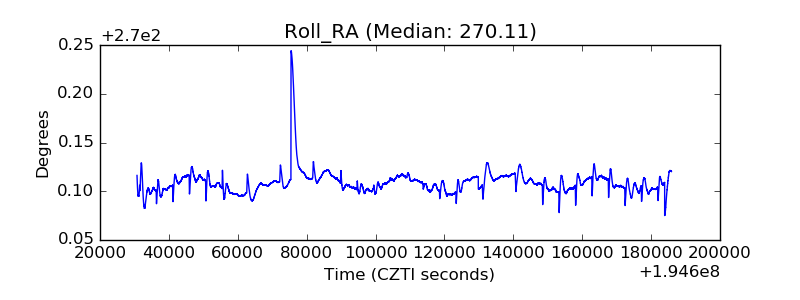 |
| Veto Counter | 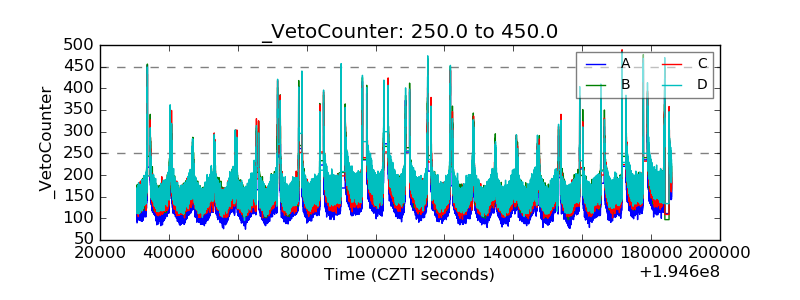 |