| Param | Original file | Final file |
|---|---|---|
| Filename | modeM0/AS1T01_056T01_9000000356_02327cztM0_level2.evt | modeM0/AS1T01_056T01_9000000356_02327cztM0_level2_quad_clean.evt |
| Size (bytes) | 342,048,960 | 32,408,640 |
| Size | 326.2 MB | 30.9 MB |
| Events in quadrant A | 1,803,975 | 180,076 |
| Events in quadrant B | 4,320,094 | 171,490 |
| Events in quadrant C | 1,977,962 | 180,987 |
| Events in quadrant D | 1,993,806 | 175,165 |
| Mode M9 | |||
|---|---|---|---|
| Quadrant | BADHDUFLAG | Total packets | Discarded packets |
| A | 0 | 10 | 0 |
| B | 0 | 10 | 0 |
| C | 0 | 10 | 0 |
| D | 0 | 10 | 0 |
| Mode M0 | |||
|---|---|---|---|
| Quadrant | BADHDUFLAG | Total packets | Discarded packets |
| A | 0 | 7946 | 2 |
| B | 0 | 15558 | 1 |
| C | 0 | 8412 | 1 |
| D | 0 | 8507 | 1 |
| Mode SS | |||
|---|---|---|---|
| Quadrant | BADHDUFLAG | Total packets | Discarded packets |
| A | 0 | 78 | 0 |
| B | 0 | 78 | 0 |
| C | 0 | 78 | 0 |
| D | 0 | 78 | 0 |
| Quadrant | Total seconds | Saturated seconds | Saturation percentage |
|---|---|---|---|
| A | 3867 | 37 | 0.956814% |
| B | 3867 | 435 | 11.249030% |
| C | 3867 | 33 | 0.853375% |
| D | 3867 | 54 | 1.396431% |
Noise dominated data is calculated using 1-second bins in cleaned event files. If a bin has >2000 counts, and if more than 50% of those come from <1% of pixels, then it is considered to be noise-dominated and hence unusable.
| Quadrant | # 1 sec bins | Bins with >0 counts | Bins with >2000 counts | High rate bins dominated by noise | Noise dominated (total time) | Noise dominated (detector-on time) | Marked lightcurve |
|---|---|---|---|---|---|---|---|
| A | 4791 | 3867 | 4 | 4 | 0.08% | 0.10% | 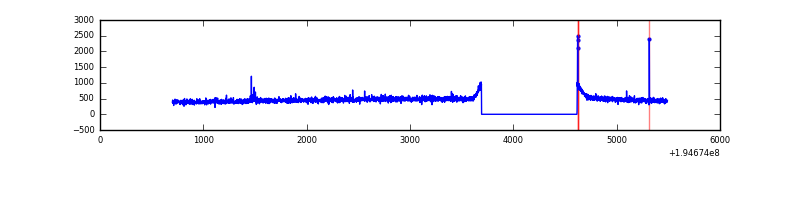 |
| B | 4792 | 3868 | 200 | 200 | 4.17% | 5.17% | 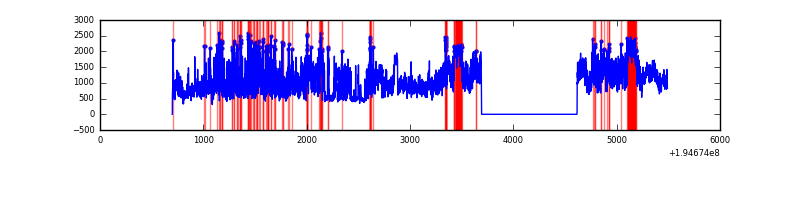 |
| C | 4792 | 3868 | 4 | 4 | 0.08% | 0.10% | 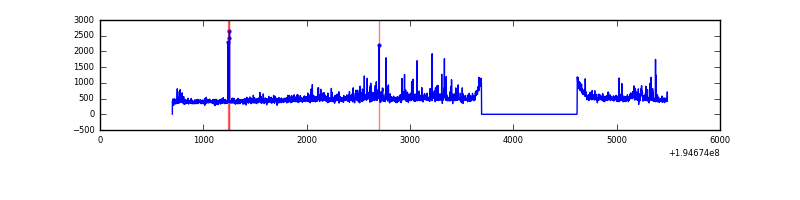 |
| D | 4792 | 3868 | 15 | 15 | 0.31% | 0.39% | 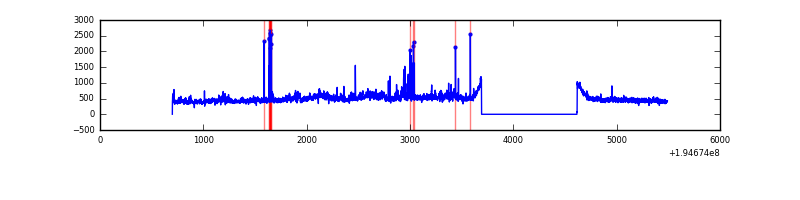 |
Top three noisy pixels from each quadrant. If the there are fewer than three noisy pixels in the level2.evt file, extra rows are filled as -1
| Pixel properties | Quadrant properties | ||||||
|---|---|---|---|---|---|---|---|
| Quadrant | DetID | PixID | Counts | Sigma | Mean | Median | Sigma |
| A | 0 | 149 | 8599 | 84.78 | 464 | 452 | 96.1 |
| A | 8 | 192 | 6780 | 65.85 | 464 | 452 | 96.1 |
| A | 0 | 226 | 5858 | 56.26 | 464 | 452 | 96.1 |
| B | 0 | 85 | 2430744 | 27129.32 | 458 | 447 | 89.6 |
| B | 4 | 48 | 25816 | 283.19 | 458 | 447 | 89.6 |
| B | 15 | 54 | 22366 | 244.68 | 458 | 447 | 89.6 |
| C | 5 | 234 | 138110 | 1285.88 | 452 | 454 | 107.1 |
| C | 14 | 223 | 52752 | 488.53 | 452 | 454 | 107.1 |
| C | 9 | 191 | 13043 | 117.6 | 452 | 454 | 107.1 |
| D | 12 | 79 | 144674 | 1326.89 | 450 | 439 | 108.7 |
| D | 6 | 112 | 30896 | 280.19 | 450 | 439 | 108.7 |
| D | 8 | 195 | 29810 | 270.2 | 450 | 439 | 108.7 |
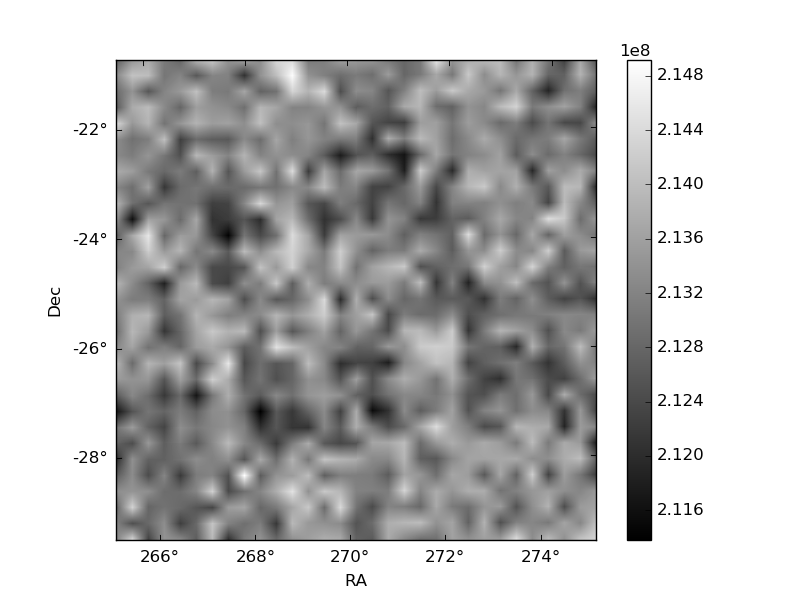
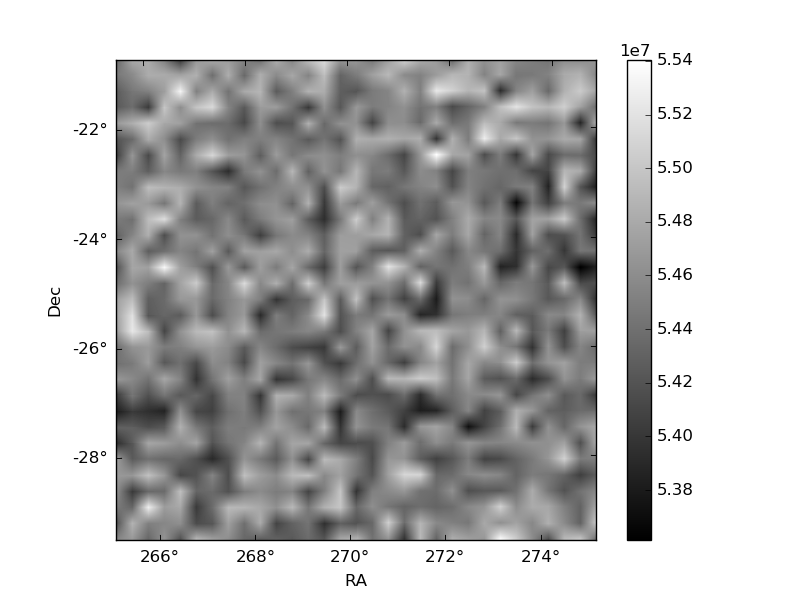
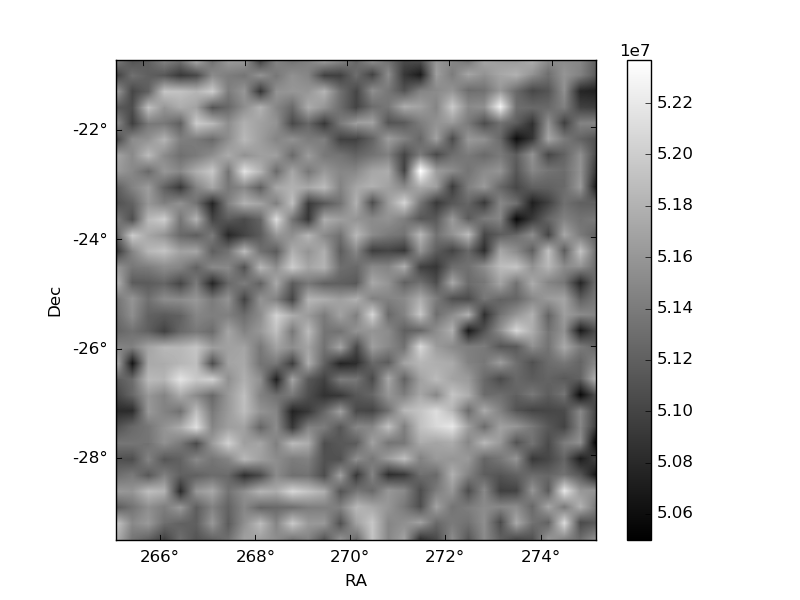
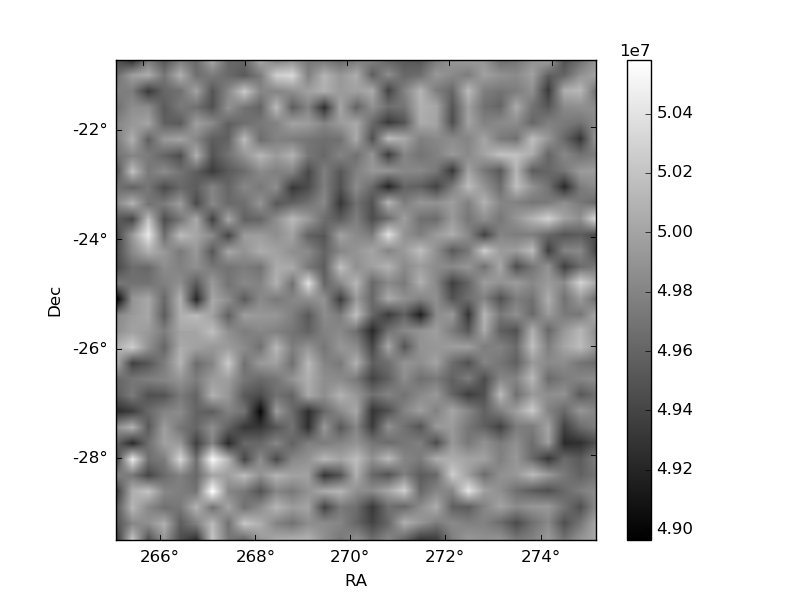
Histogram calculated using DETX and DETY for each event in the final _common_clean file
| Quadrant A | 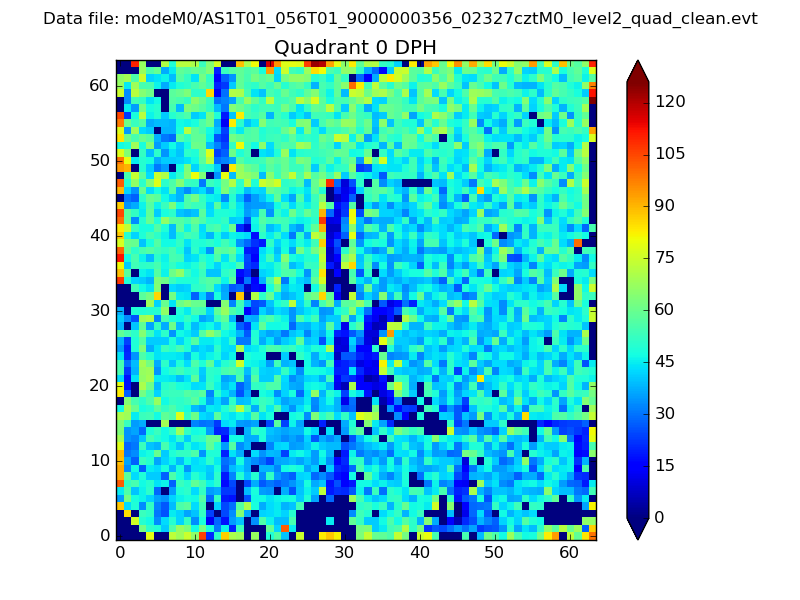 |
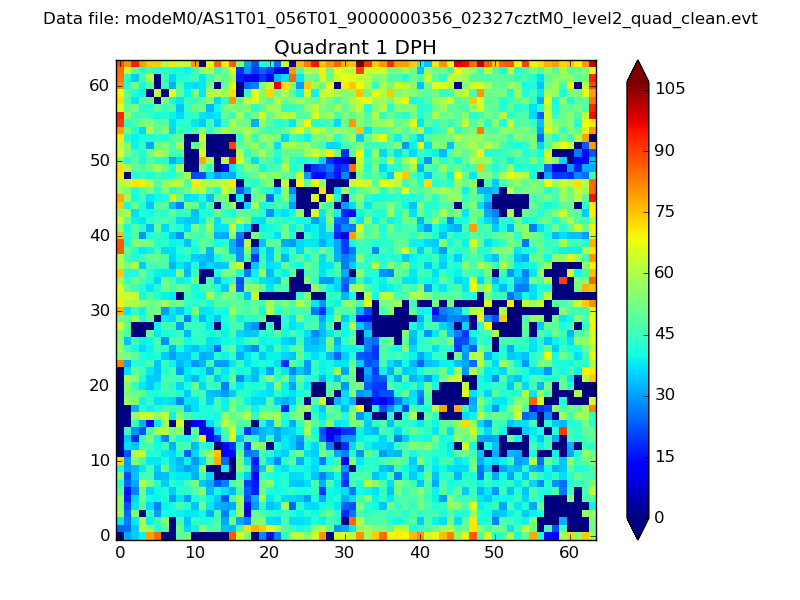 |
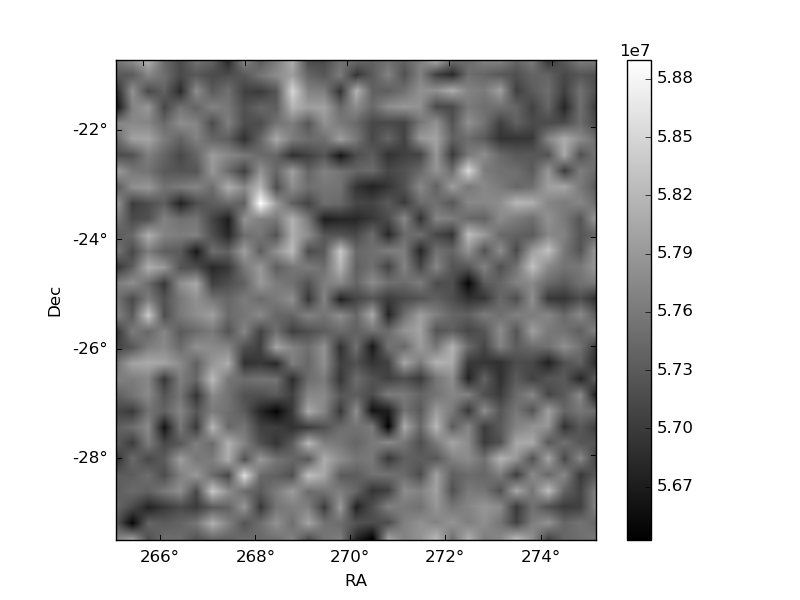
Quadrant B |
|---|---|---|---|
| Quadrant D | 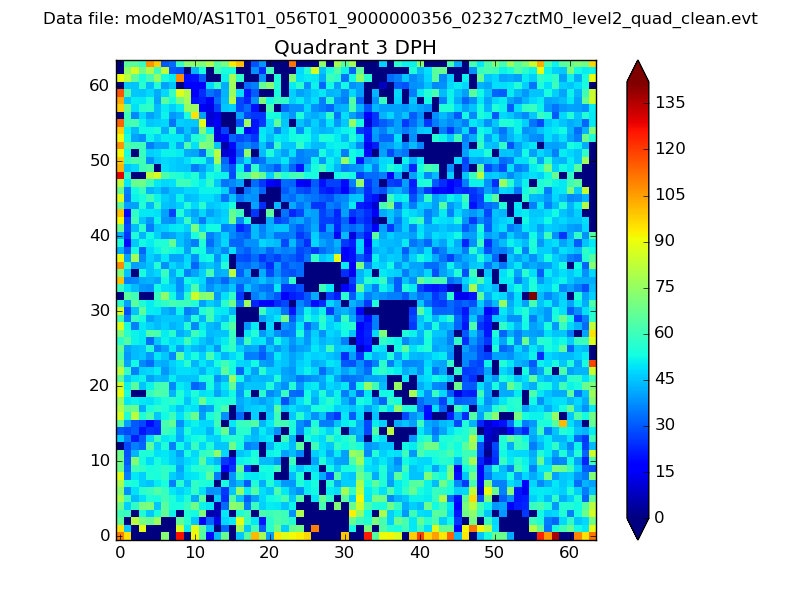 |
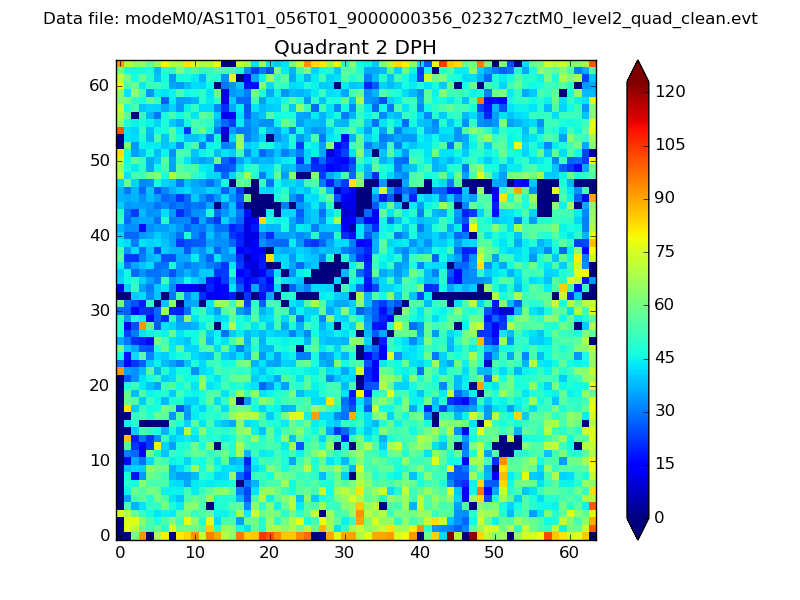 |
Quadrant C |
| Plot type | Count rate plots | Images |
|---|---|---|
| Comparison with Poisson distribution Blue bars denote a histogram of data divided into 1 sec bins. Red curve is a Poisson curve with rate = median count rate of data. |
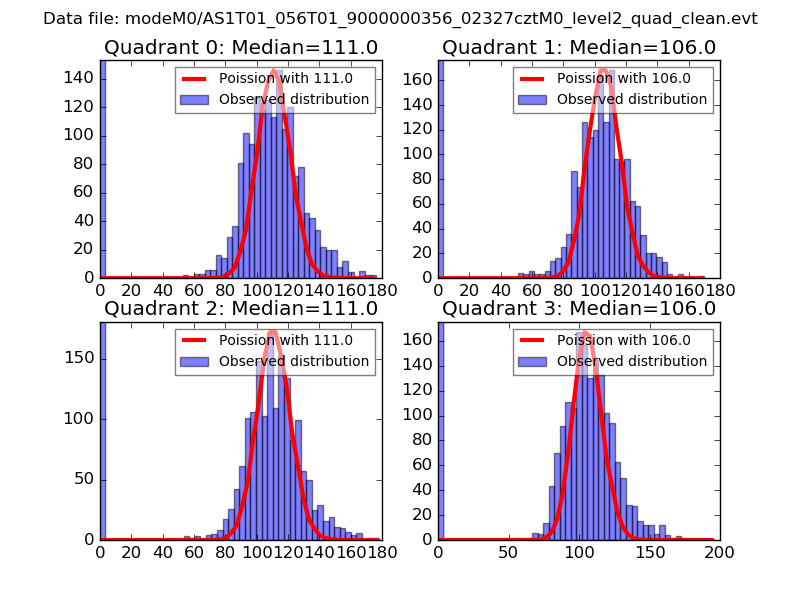 |
 |
| Quadrant-wise count rates Data is divided into 100 sec bins |
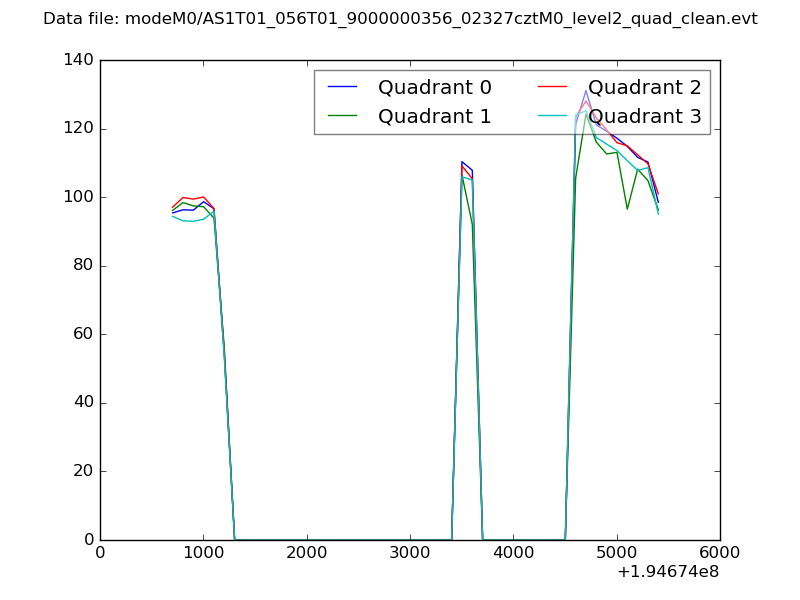 |
|
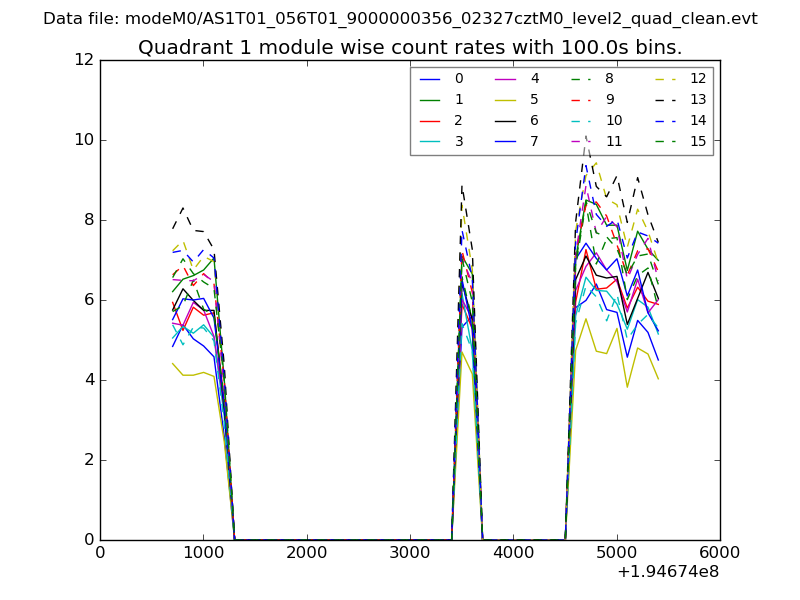
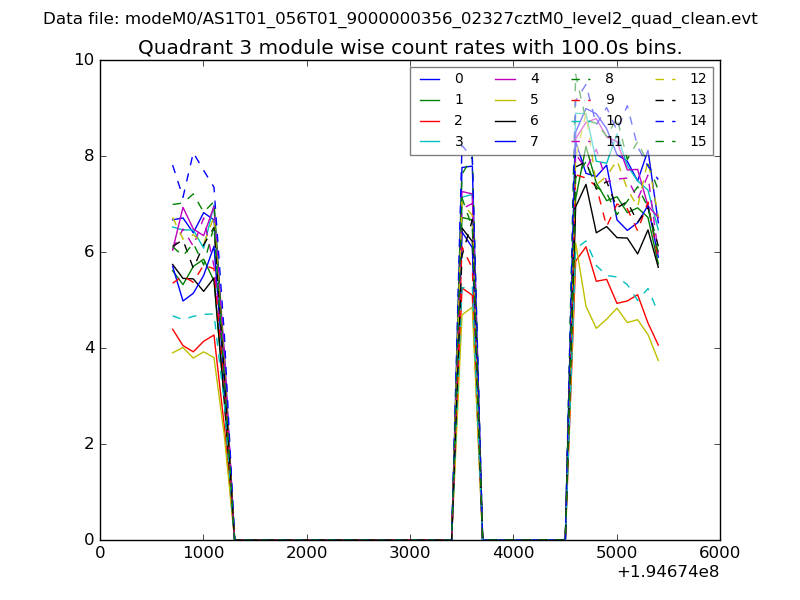
| Module-wise count rates for Quadrant A Data is divided into 100 sec bins |
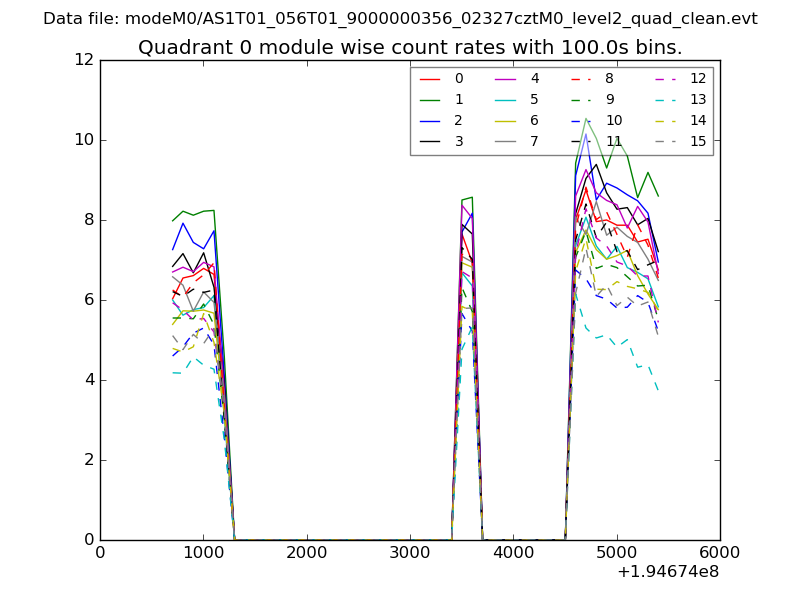 |
 |
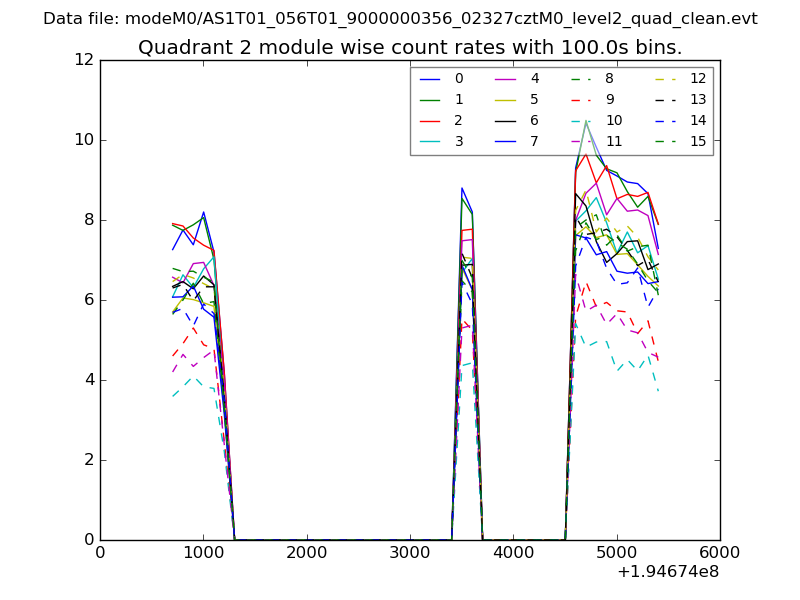
| Module-wise count rates for Quadrant B Data is divided into 100 sec bins |
 |
 |
| Module-wise count rates for Quadrant C Data is divided into 100 sec bins |
 |
 |
| Module-wise count rates for Quadrant D Data is divided into 100 sec bins |
 |
 |
| Parameter | Plot |
|---|---|
| CZT HV Monitor | 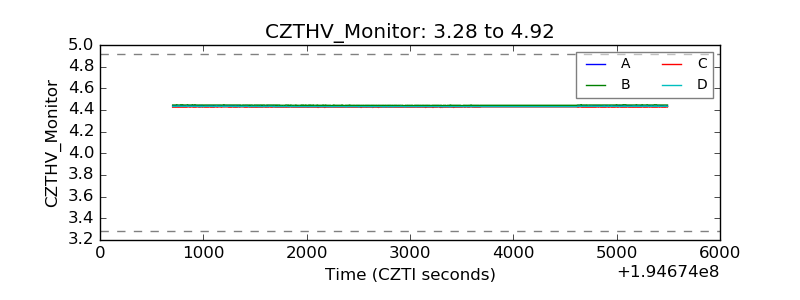 |
| D_VDD | 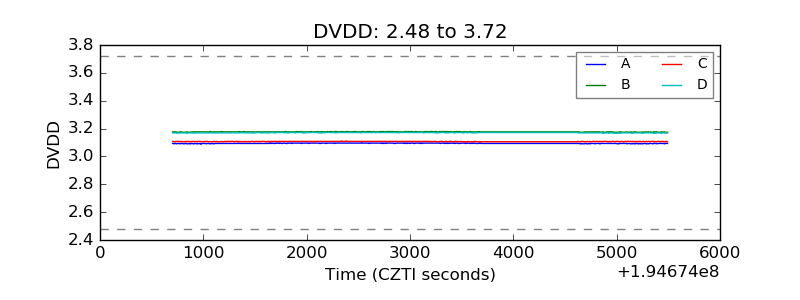 |
| Temperature 1 | 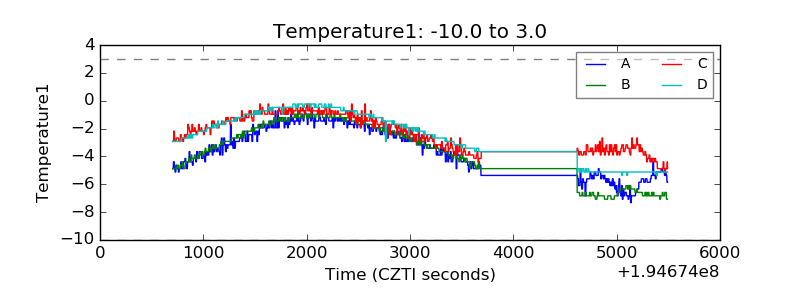 |
| Veto HV Monitor | 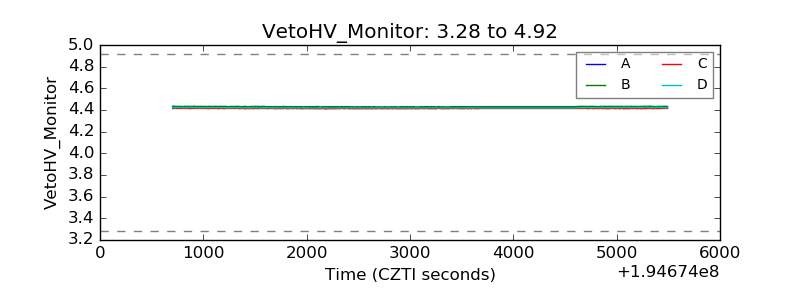 |
| Veto LLD | 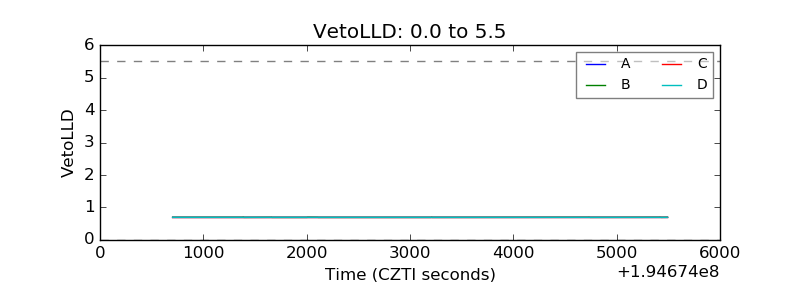 |
| Alpha Counter |  |
| _CPM_Rate | 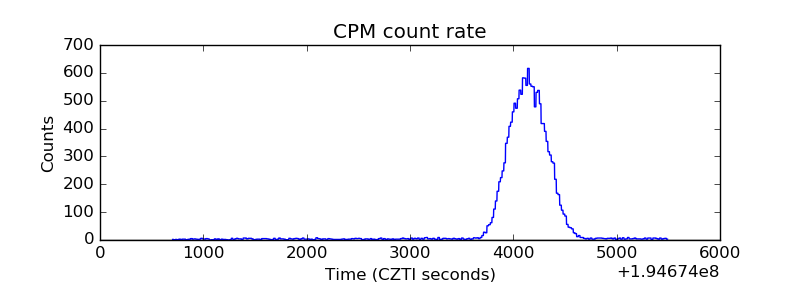 |
| CZT Counter | 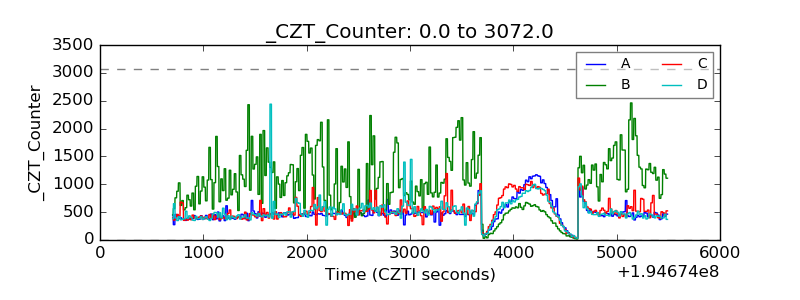 |
| +2.5 Volts monitor |  |
| +5 Volts monitor |  |
| _ROLL_ROT | 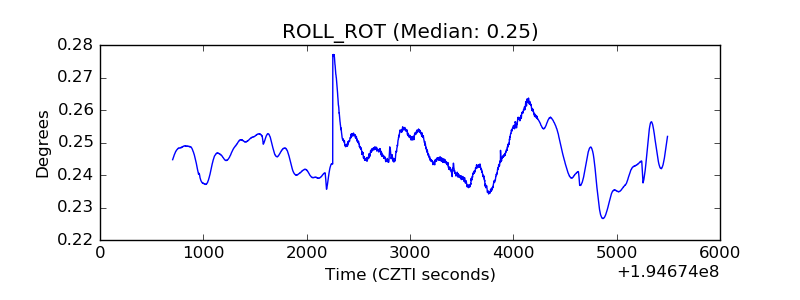 |
| _Roll_DEC | 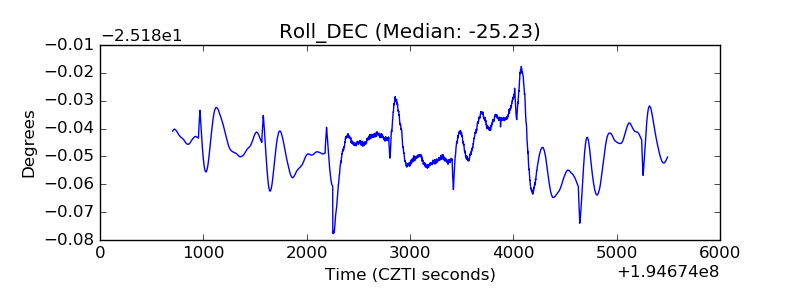 |
| _Roll_RA | 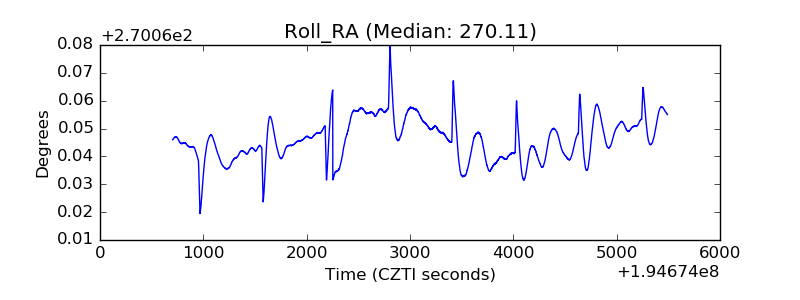 |
| Veto Counter | 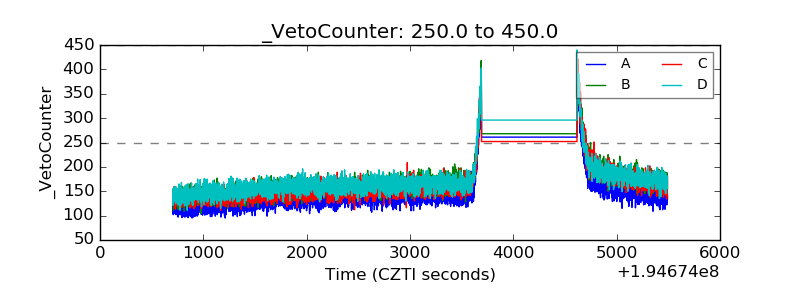 |