| Param | Original file | Final file |
|---|---|---|
| Filename | modeM0/AS1T01_056T01_9000000356_02337cztM0_level2.evt | modeM0/AS1T01_056T01_9000000356_02337cztM0_level2_quad_clean.evt |
| Size (bytes) | 570,888,000 | 82,958,400 |
| Size | 544.4 MB | 79.1 MB |
| Events in quadrant A | 3,152,574 | 520,503 |
| Events in quadrant B | 3,082,822 | 521,418 |
| Events in quadrant C | 7,662,975 | 491,808 |
| Events in quadrant D | 2,930,123 | 504,098 |
| Mode M9 | |||
|---|---|---|---|
| Quadrant | BADHDUFLAG | Total packets | Discarded packets |
| A | 0 | 6 | 0 |
| B | 0 | 6 | 0 |
| C | 0 | 6 | 0 |
| D | 0 | 6 | 0 |
| Mode M0 | |||
|---|---|---|---|
| Quadrant | BADHDUFLAG | Total packets | Discarded packets |
| A | 0 | 14253 | 2 |
| B | 0 | 13907 | 1 |
| C | 0 | 27503 | 1 |
| D | 0 | 13952 | 1 |
| Mode SS | |||
|---|---|---|---|
| Quadrant | BADHDUFLAG | Total packets | Discarded packets |
| A | 0 | 136 | 0 |
| B | 0 | 136 | 0 |
| C | 0 | 136 | 0 |
| D | 0 | 136 | 0 |
| Quadrant | Total seconds | Saturated seconds | Saturation percentage |
|---|---|---|---|
| A | 6807 | 69 | 1.013662% |
| B | 6807 | 22 | 0.323197% |
| C | 6807 | 808 | 11.870134% |
| D | 6807 | 21 | 0.308506% |
Noise dominated data is calculated using 1-second bins in cleaned event files. If a bin has >2000 counts, and if more than 50% of those come from <1% of pixels, then it is considered to be noise-dominated and hence unusable.
| Quadrant | # 1 sec bins | Bins with >0 counts | Bins with >2000 counts | High rate bins dominated by noise | Noise dominated (total time) | Noise dominated (detector-on time) | Marked lightcurve |
|---|---|---|---|---|---|---|---|
| A | 7342 | 6808 | 34 | 34 | 0.46% | 0.50% | 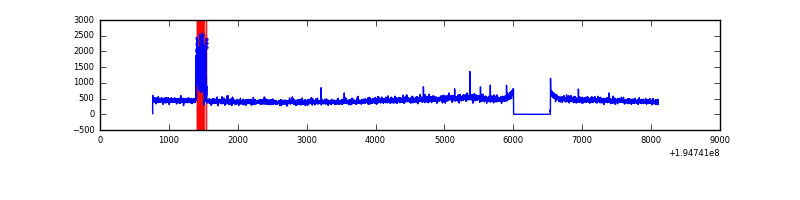 |
| B | 7342 | 6808 | 0 | 0 | 0.00% | 0.00% | 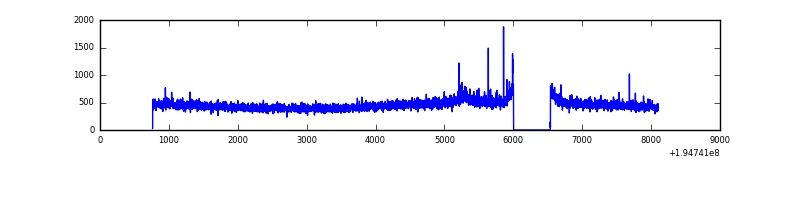 |
| C | 7342 | 6808 | 789 | 789 | 10.75% | 11.59% | 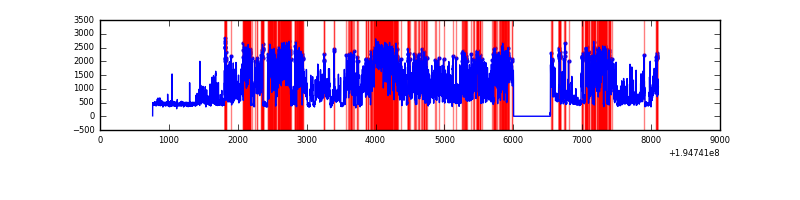 |
| D | 7342 | 6808 | 6 | 6 | 0.08% | 0.09% |  |
Top three noisy pixels from each quadrant. If the there are fewer than three noisy pixels in the level2.evt file, extra rows are filled as -1
| Pixel properties | Quadrant properties | ||||||
|---|---|---|---|---|---|---|---|
| Quadrant | DetID | PixID | Counts | Sigma | Mean | Median | Sigma |
| A | 0 | 149 | 160791 | 1004.88 | 773 | 753 | 159.3 |
| A | 0 | 226 | 23410 | 142.26 | 773 | 753 | 159.3 |
| A | 12 | 194 | 8669 | 49.7 | 773 | 753 | 159.3 |
| B | 8 | 3 | 27146 | 172.56 | 787 | 764 | 152.9 |
| B | 12 | 111 | 10628 | 64.52 | 787 | 764 | 152.9 |
| B | 11 | 111 | 9048 | 54.18 | 787 | 764 | 152.9 |
| C | 5 | 234 | 4675906 | 26929.63 | 735 | 738 | 173.6 |
| C | 2 | 53 | 45474 | 257.69 | 735 | 738 | 173.6 |
| C | 8 | 112 | 24938 | 139.4 | 735 | 738 | 173.6 |
| D | 6 | 112 | 39771 | 219.11 | 744 | 726 | 178.2 |
| D | 10 | 172 | 19464 | 105.15 | 744 | 726 | 178.2 |
| D | 15 | 194 | 13585 | 72.16 | 744 | 726 | 178.2 |
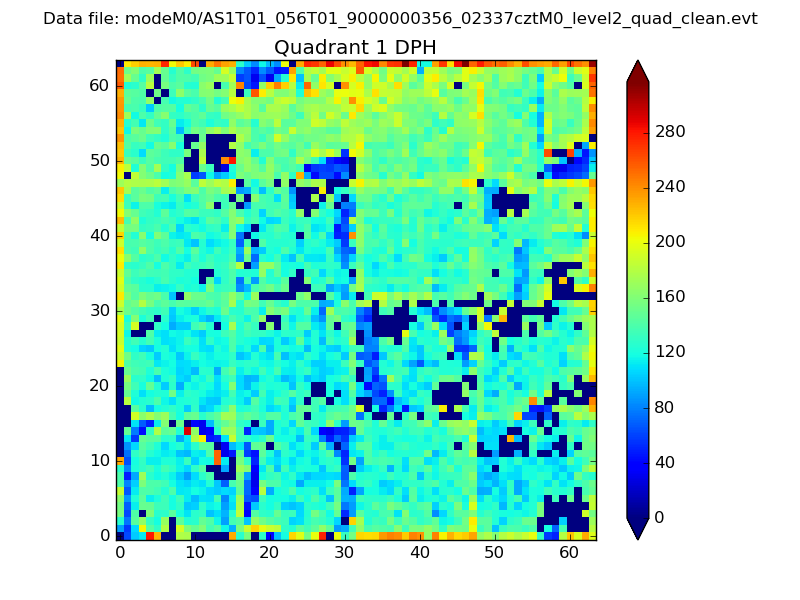
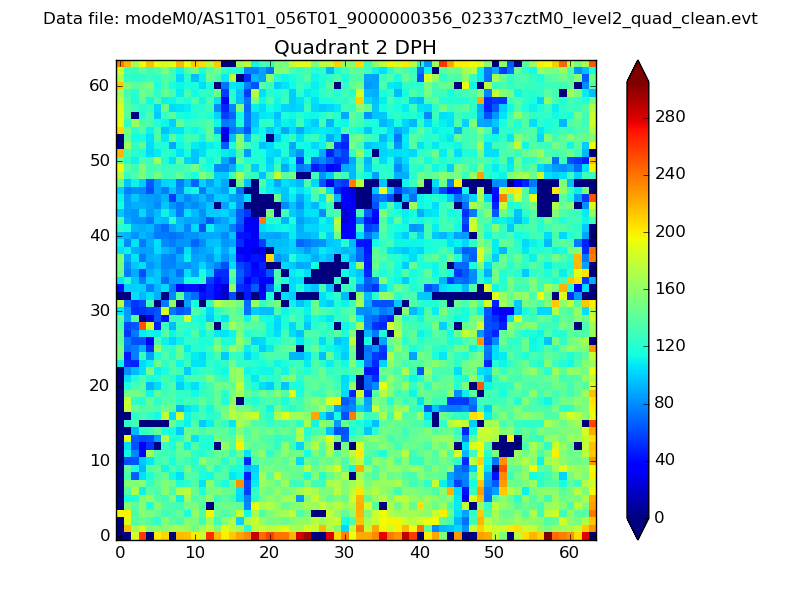
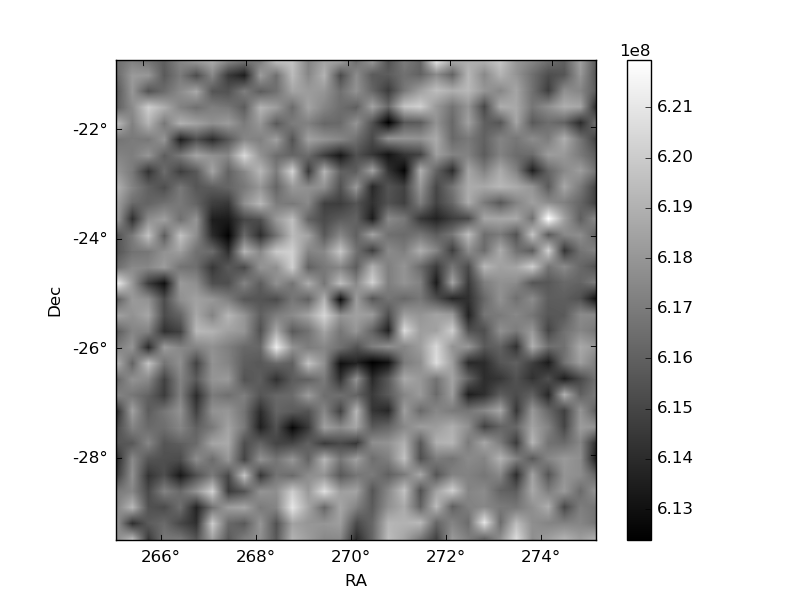
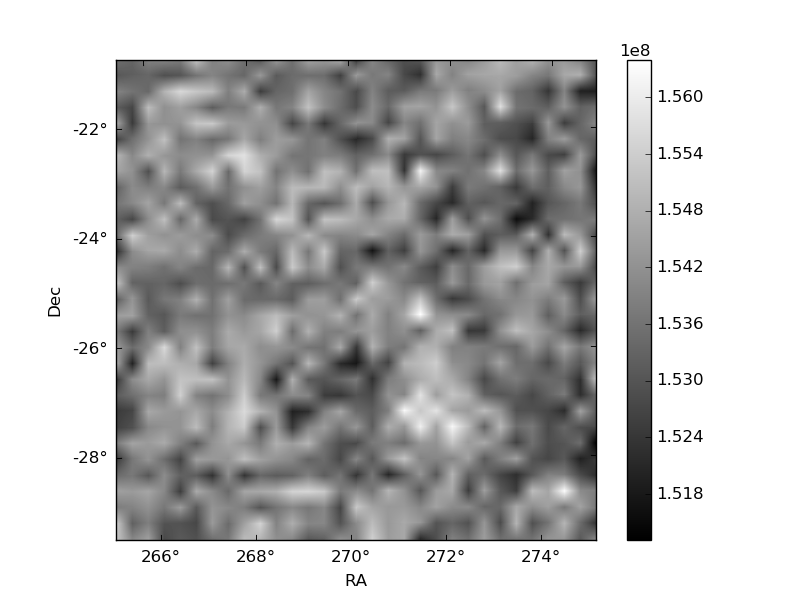
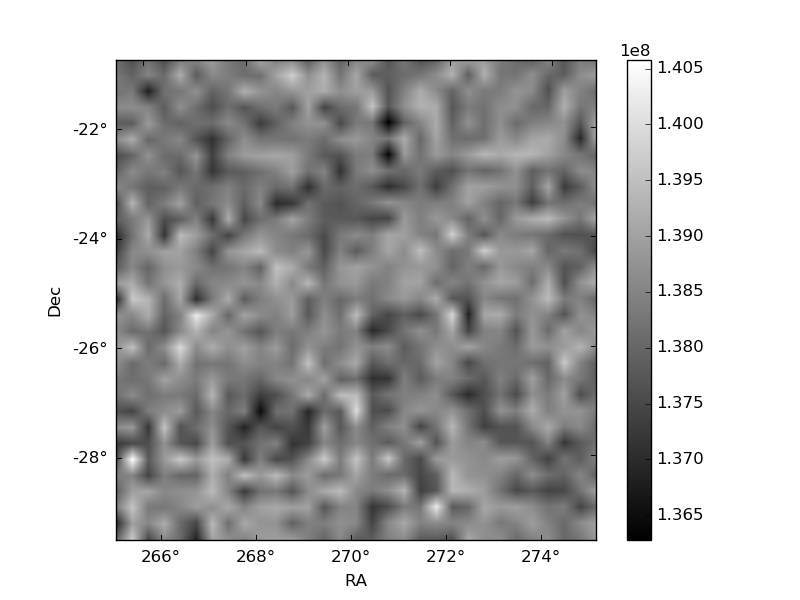
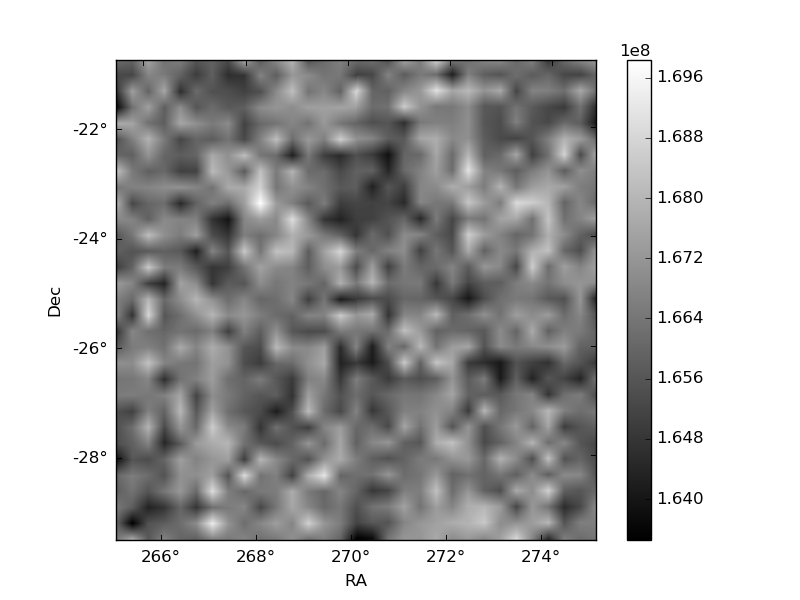
Histogram calculated using DETX and DETY for each event in the final _common_clean file
| Quadrant A | 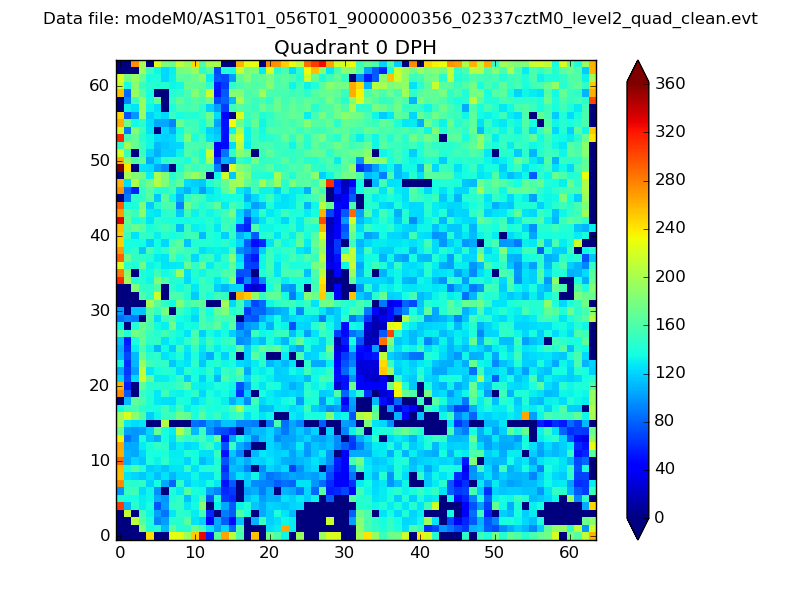 |
 |
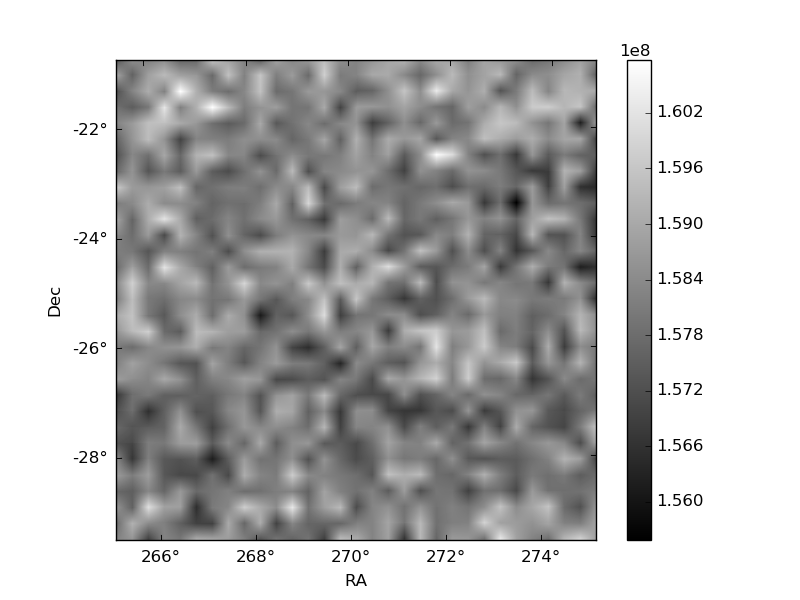
Quadrant B |
|---|---|---|---|
| Quadrant D | 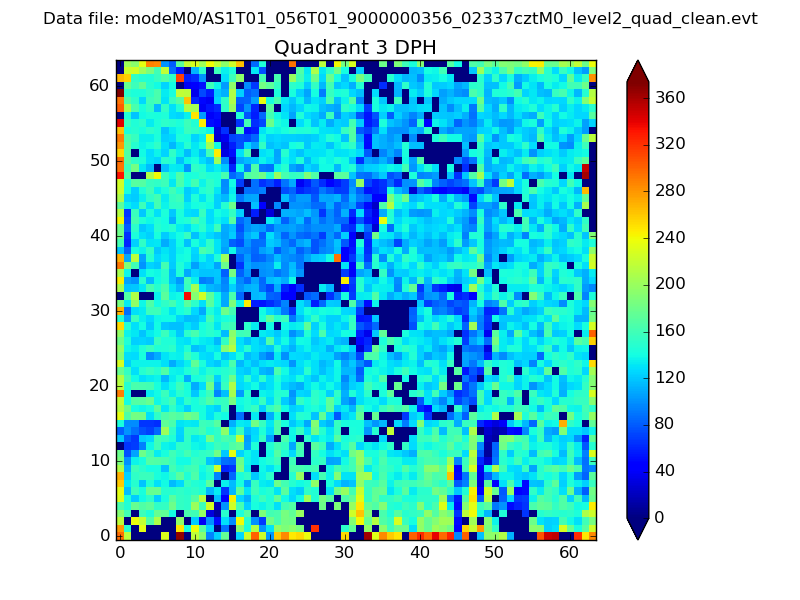 |
 |
Quadrant C |
| Plot type | Count rate plots | Images |
|---|---|---|
| Comparison with Poisson distribution Blue bars denote a histogram of data divided into 1 sec bins. Red curve is a Poisson curve with rate = median count rate of data. |
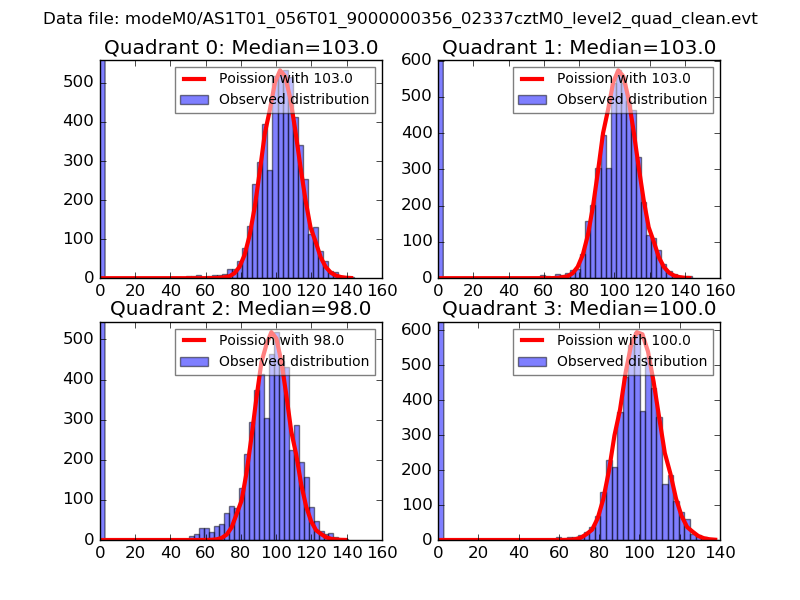 |
 |
| Quadrant-wise count rates Data is divided into 100 sec bins |
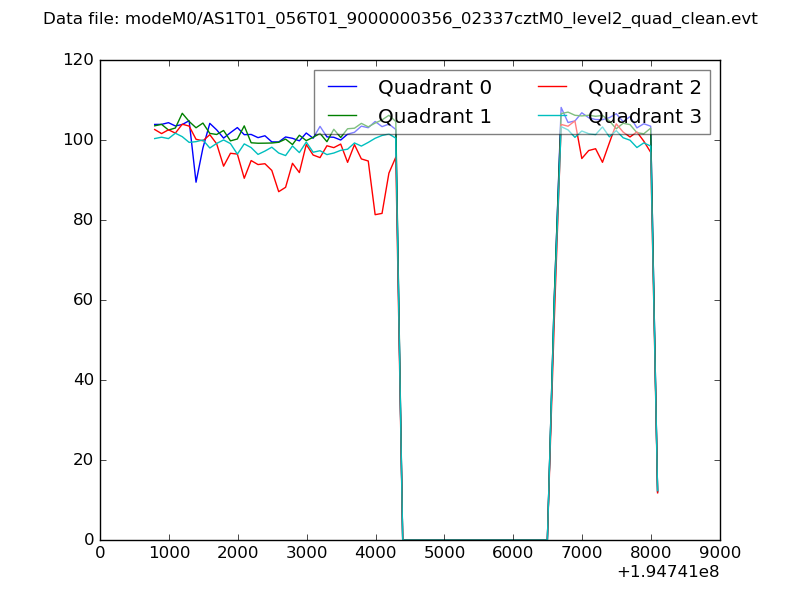 |
|
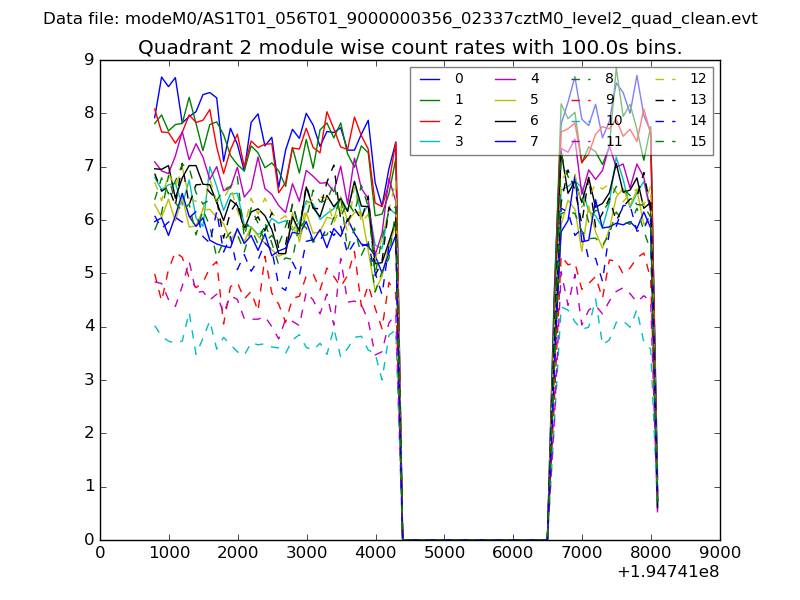
| Module-wise count rates for Quadrant A Data is divided into 100 sec bins |
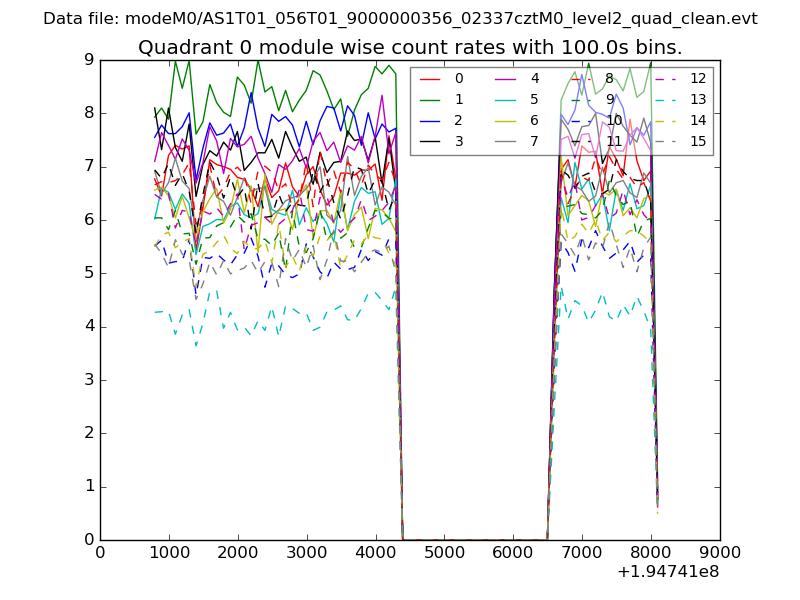 |
 |
| Module-wise count rates for Quadrant B Data is divided into 100 sec bins |
 |
 |
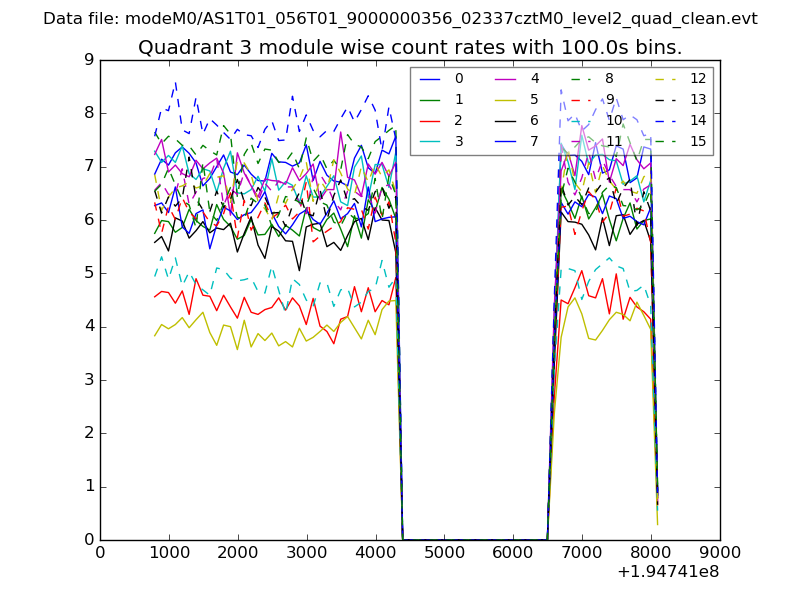
| Module-wise count rates for Quadrant C Data is divided into 100 sec bins |
 |
 |
| Module-wise count rates for Quadrant D Data is divided into 100 sec bins |
 |
 |
| Parameter | Plot |
|---|---|
| CZT HV Monitor | 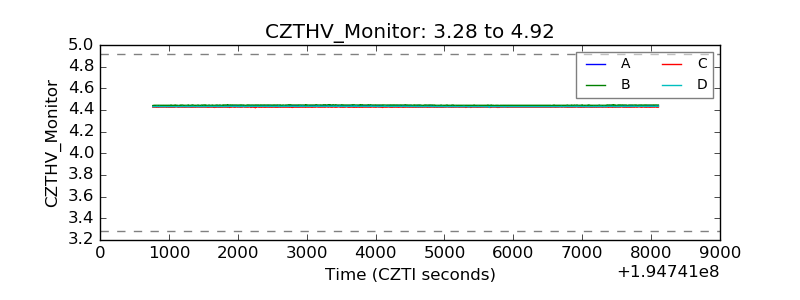 |
| D_VDD | 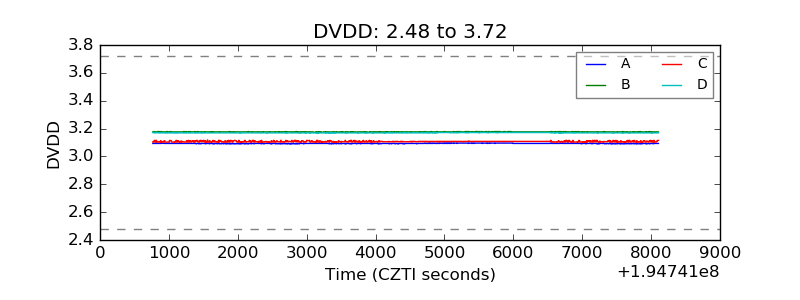 |
| Temperature 1 | 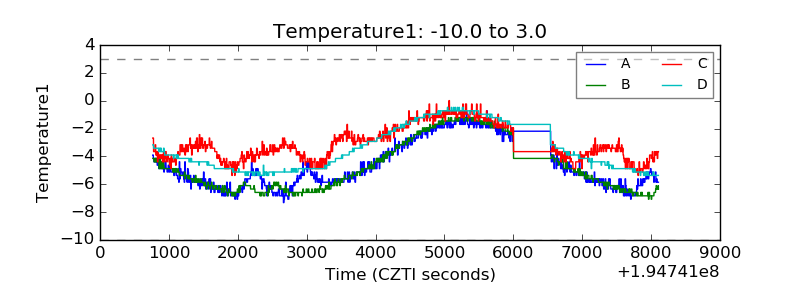 |
| Veto HV Monitor | 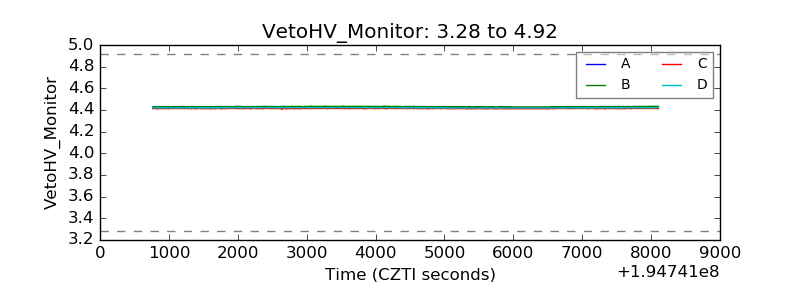 |
| Veto LLD | 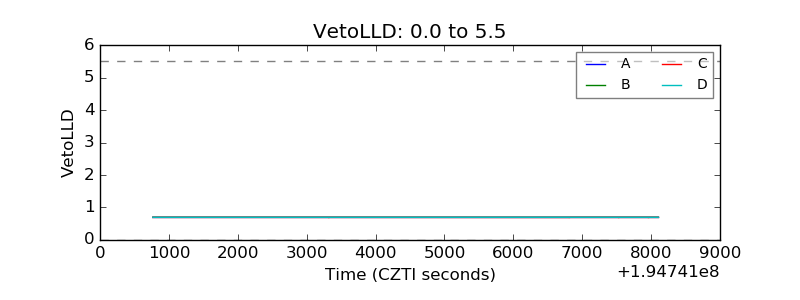 |
| Alpha Counter | 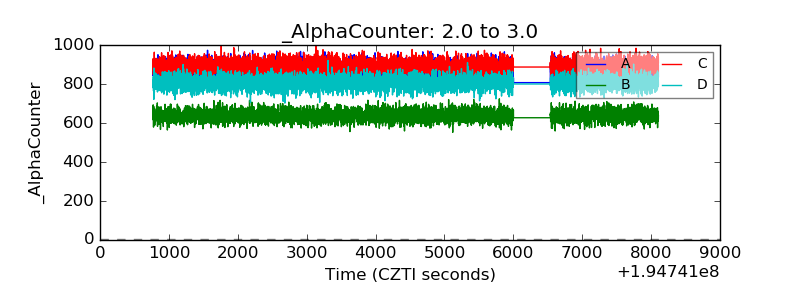 |
| _CPM_Rate | 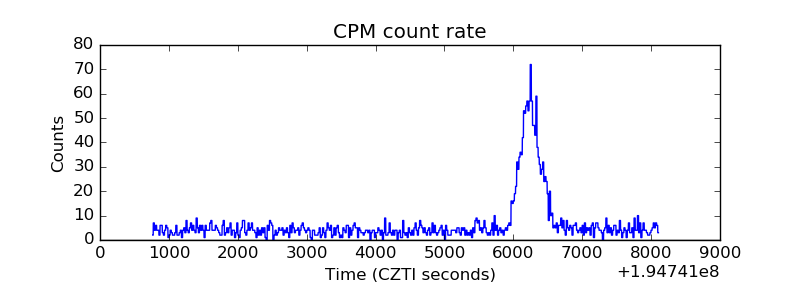 |
| CZT Counter | 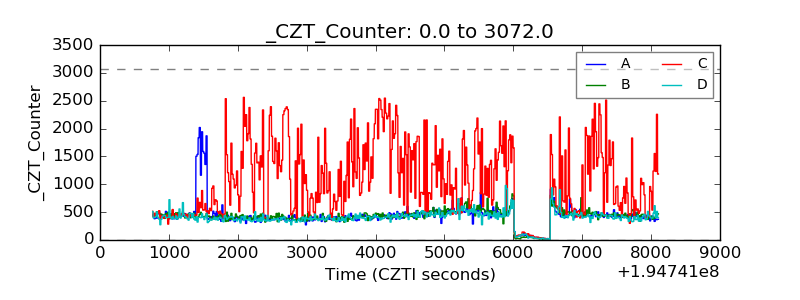 |
| +2.5 Volts monitor |  |
| +5 Volts monitor |  |
| _ROLL_ROT | 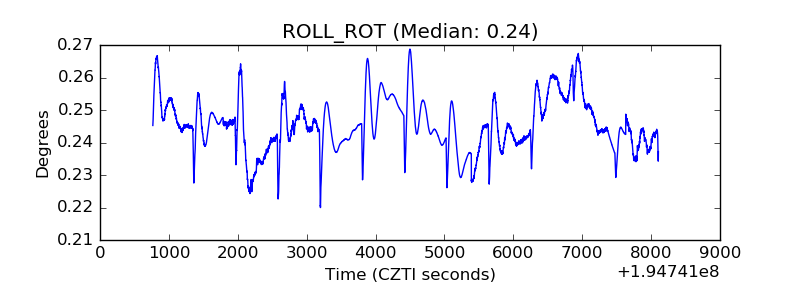 |
| _Roll_DEC | 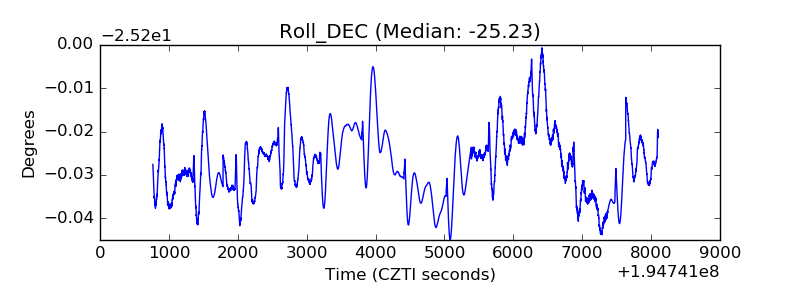 |
| _Roll_RA | 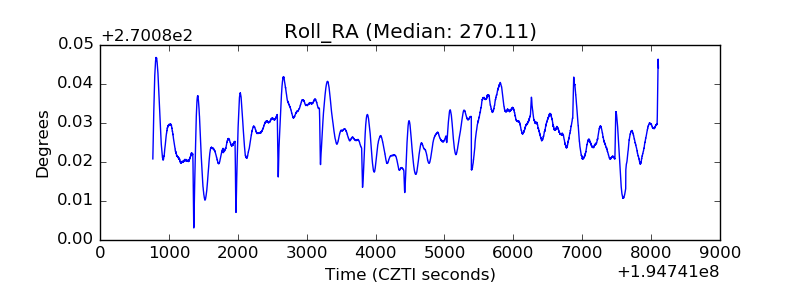 |
| Veto Counter | 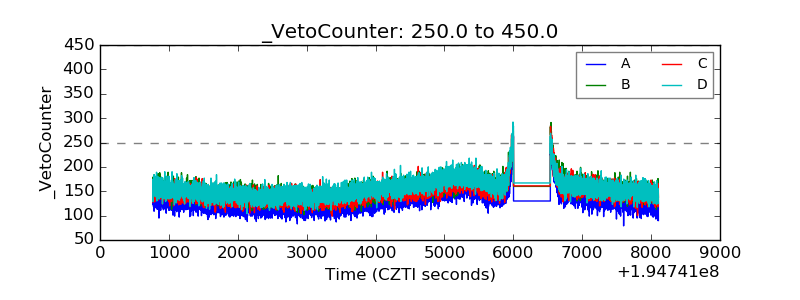 |