| Param | Original file | Final file |
|---|---|---|
| Filename | modeM0/AS1T01_030T01_9000000358cztM0_level2.fits | modeM0/AS1T01_030T01_9000000358cztM0_level2_quad_clean.evt |
| Size (bytes) | 1,385,055,360 | 1,486,848,960 |
| Size | 1.3 GB | 1.4 GB |
| Events in quadrant A | 8,343,942 | 9,022,693 |
| Events in quadrant B | 8,101,304 | 9,181,568 |
| Events in quadrant C | 8,159,318 | 8,639,544 |
| Events in quadrant D | 6,994,728 | 7,844,277 |
| Mode M0 | |||
|---|---|---|---|
| Quadrant | BADHDUFLAG | Total packets | Discarded packets |
| A | 0 | 330224 | 0 |
| B | 0 | 320798 | 0 |
| C | 0 | 320345 | 0 |
| D | 0 | 333669 | 0 |
| Mode M9 | |||
|---|---|---|---|
| Quadrant | BADHDUFLAG | Total packets | Discarded packets |
| A | 0 | 220 | 0 |
| B | 0 | 220 | 0 |
| C | 0 | 220 | 0 |
| D | 0 | 220 | 0 |
| Mode SS | |||
|---|---|---|---|
| Quadrant | BADHDUFLAG | Total packets | Discarded packets |
| A | 0 | 3068 | 0 |
| B | 0 | 3068 | 0 |
| C | 0 | 3068 | 0 |
| D | 0 | 3068 | 0 |
| Quadrant | Total seconds | Saturated seconds | Saturation percentage |
|---|---|---|---|
| A | 150991 | 2791 | 1.848455% |
| B | 150993 | 2537 | 1.680210% |
| C | 150993 | 1926 | 1.275556% |
| D | 150992 | 2735 | 1.811354% |
Noise dominated data is calculated using 1-second bins in cleaned event files. If a bin has >2000 counts, and if more than 50% of those come from <1% of pixels, then it is considered to be noise-dominated and hence unusable.
| Quadrant | # 1 sec bins | Bins with >0 counts | Bins with >2000 counts | High rate bins dominated by noise | Noise dominated (total time) | Noise dominated (detector-on time) | Marked lightcurve |
|---|---|---|---|---|---|---|---|
| A | 183940 | 150993 | 0 | 0 | 0.00% | 0.00% |  |
| B | 183940 | 150991 | 0 | 0 | 0.00% | 0.00% |  |
| C | 183939 | 150989 | 0 | 0 | 0.00% | 0.00% |  |
| D | 183939 | 150983 | 0 | 0 | 0.00% | 0.00% |  |
Top three noisy pixels from each quadrant. If the there are fewer than three noisy pixels in the level2.evt file, extra rows are filled as -1
| Pixel properties | Quadrant properties | ||||||
|---|---|---|---|---|---|---|---|
| Quadrant | DetID | PixID | Counts | Sigma | Mean | Median | Sigma |
| A | 14 | 188 | 8043 | 10.78 | 2165 | 2014 | 559.1 |
| A | 0 | 29 | 7827 | 10.4 | 2165 | 2014 | 559.1 |
| A | 7 | 110 | 7153 | 9.19 | 2165 | 2014 | 559.1 |
| B | 2 | 9 | 7091 | 12.35 | 2131 | 2026 | 410.0 |
| B | 12 | 226 | 6201 | 10.18 | 2131 | 2026 | 410.0 |
| B | 14 | 254 | 5824 | 9.26 | 2131 | 2026 | 410.0 |
| C | 2 | 191 | 5476 | 6.05 | 2163 | 1990 | 576.6 |
| C | 9 | 242 | 5424 | 5.96 | 2163 | 1990 | 576.6 |
| C | 1 | 80 | 5416 | 5.94 | 2163 | 1990 | 576.6 |
| D | 3 | 14 | 5222 | 6.1 | 2004 | 1817 | 558.1 |
| D | 11 | 82 | 5184 | 6.03 | 2004 | 1817 | 558.1 |
| D | 6 | 44 | 5099 | 5.88 | 2004 | 1817 | 558.1 |
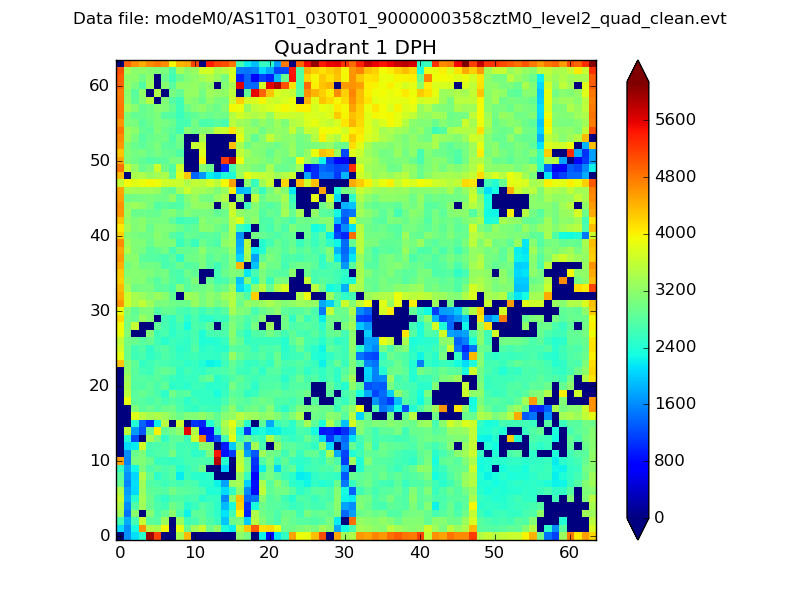
Histogram calculated using DETX and DETY for each event in the final _common_clean file
| Quadrant A |  |
 |
Quadrant B |
|---|---|---|---|
| Quadrant D |  |
 |
Quadrant C |
| Plot type | Count rate plots | Images |
|---|---|---|
| Comparison with Poisson distribution Blue bars denote a histogram of data divided into 1 sec bins. Red curve is a Poisson curve with rate = median count rate of data. |
 |
 |
| Quadrant-wise count rates Data is divided into 100 sec bins |
 |
|
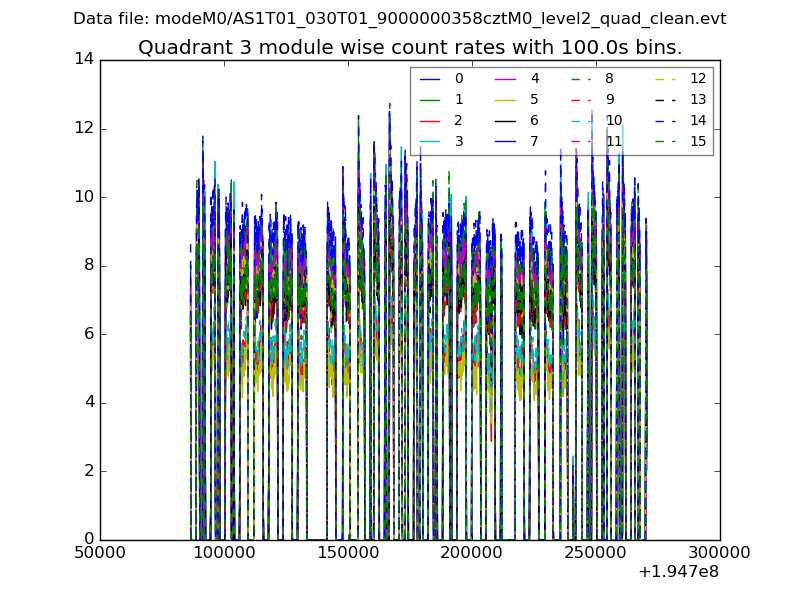
| Module-wise count rates for Quadrant A Data is divided into 100 sec bins |
 |
 |
| Module-wise count rates for Quadrant B Data is divided into 100 sec bins |
 |
 |
| Module-wise count rates for Quadrant C Data is divided into 100 sec bins |
 |
 |
| Module-wise count rates for Quadrant D Data is divided into 100 sec bins |
 |
 |
| Parameter | Plot |
|---|---|
| CZT HV Monitor |  |
| D_VDD | 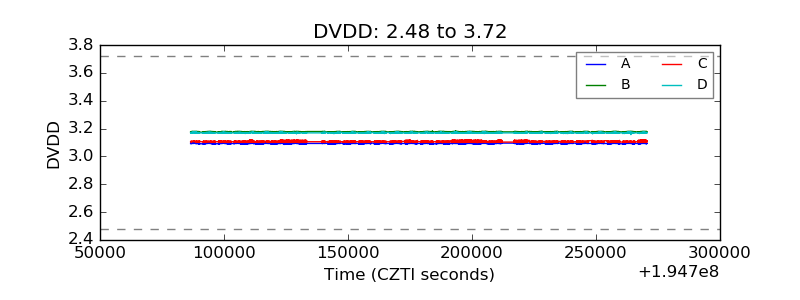 |
| Temperature 1 |  |
| Veto HV Monitor |  |
| Veto LLD |  |
| Alpha Counter |  |
| _CPM_Rate |  |
| CZT Counter |  |
| +2.5 Volts monitor |  |
| +5 Volts monitor |  |
| _ROLL_ROT |  |
| _Roll_DEC |  |
| _Roll_RA |  |
| Veto Counter |  |