| Param | Original file | Final file |
|---|---|---|
| Filename | modeM0/AS1T01_028T01_9000000360cztM0_level2.fits | modeM0/AS1T01_028T01_9000000360cztM0_level2_quad_clean.evt |
| Size (bytes) | 406,192,320 | 410,644,800 |
| Size | 387.4 MB | 391.6 MB |
| Events in quadrant A | 2,410,504 | 2,386,962 |
| Events in quadrant B | 2,342,898 | 2,436,536 |
| Events in quadrant C | 2,382,634 | 2,346,965 |
| Events in quadrant D | 1,992,548 | 2,094,132 |
| Mode M9 | |||
|---|---|---|---|
| Quadrant | BADHDUFLAG | Total packets | Discarded packets |
| A | 0 | 116 | 0 |
| B | 0 | 116 | 0 |
| C | 0 | 116 | 0 |
| D | 0 | 116 | 0 |
| Mode M0 | |||
|---|---|---|---|
| Quadrant | BADHDUFLAG | Total packets | Discarded packets |
| A | 0 | 93673 | 0 |
| B | 0 | 93768 | 0 |
| C | 0 | 91961 | 0 |
| D | 0 | 116858 | 0 |
| Mode SS | |||
|---|---|---|---|
| Quadrant | BADHDUFLAG | Total packets | Discarded packets |
| A | 0 | 1668 | 0 |
| B | 0 | 914 | 0 |
| C | 0 | 1668 | 0 |
| D | 0 | 1668 | 0 |
| Quadrant | Total seconds | Saturated seconds | Saturation percentage |
|---|---|---|---|
| A | 44394 | 747 | 1.682660% |
| B | 44374 | 713 | 1.606797% |
| C | 44355 | 496 | 1.118250% |
| D | 44355 | 2331 | 5.255326% |
Noise dominated data is calculated using 1-second bins in cleaned event files. If a bin has >2000 counts, and if more than 50% of those come from <1% of pixels, then it is considered to be noise-dominated and hence unusable.
| Quadrant | # 1 sec bins | Bins with >0 counts | Bins with >2000 counts | High rate bins dominated by noise | Noise dominated (total time) | Noise dominated (detector-on time) | Marked lightcurve |
|---|---|---|---|---|---|---|---|
| A | 93546 | 44394 | 0 | 0 | 0.00% | 0.00% |  |
| B | 93546 | 44378 | 0 | 0 | 0.00% | 0.00% |  |
| C | 93546 | 44357 | 0 | 0 | 0.00% | 0.00% |  |
| D | 93546 | 44350 | 0 | 0 | 0.00% | 0.00% |  |
Top three noisy pixels from each quadrant. If the there are fewer than three noisy pixels in the level2.evt file, extra rows are filled as -1
| Pixel properties | Quadrant properties | ||||||
|---|---|---|---|---|---|---|---|
| Quadrant | DetID | PixID | Counts | Sigma | Mean | Median | Sigma |
| A | 0 | 29 | 2297 | 10.43 | 625 | 581 | 164.5 |
| A | 14 | 188 | 2291 | 10.4 | 625 | 581 | 164.5 |
| A | 7 | 110 | 2124 | 9.38 | 625 | 581 | 164.5 |
| B | 2 | 9 | 1991 | 11.62 | 616 | 587 | 120.8 |
| B | 12 | 226 | 1766 | 9.76 | 616 | 587 | 120.8 |
| B | 14 | 254 | 1676 | 9.01 | 616 | 587 | 120.8 |
| C | 12 | 241 | 1672 | 6.46 | 629 | 581 | 168.9 |
| C | 7 | 111 | 1632 | 6.22 | 629 | 581 | 168.9 |
| C | 1 | 65 | 1582 | 5.93 | 629 | 581 | 168.9 |
| D | 7 | 5 | 1448 | 5.82 | 569 | 516 | 160.1 |
| D | 7 | 3 | 1445 | 5.8 | 569 | 516 | 160.1 |
| D | 1 | 19 | 1440 | 5.77 | 569 | 516 | 160.1 |
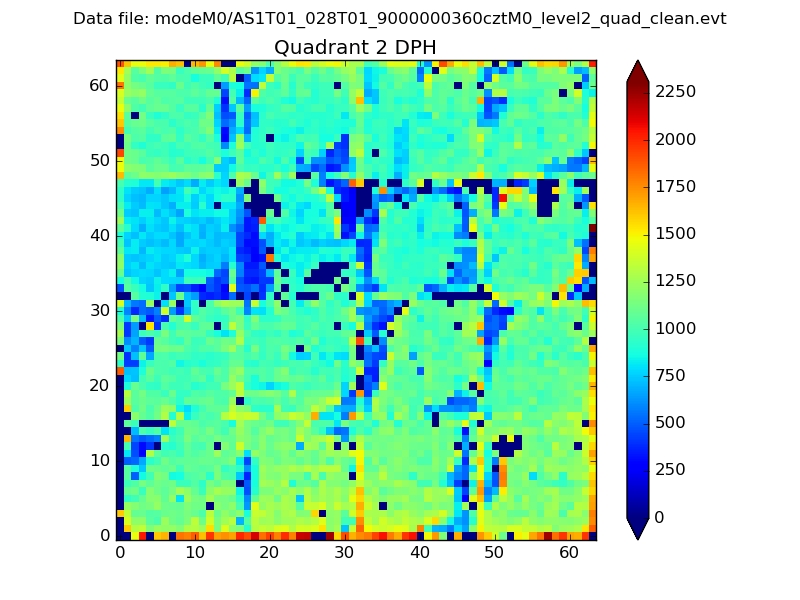
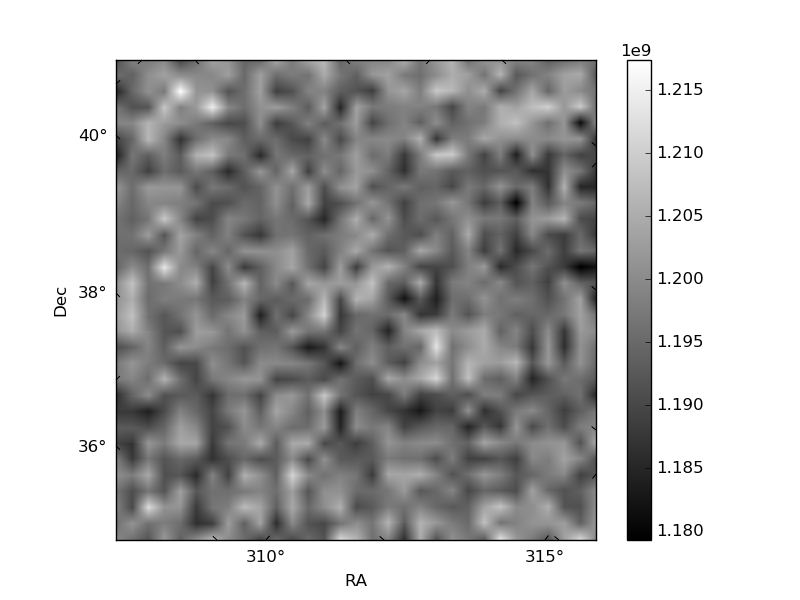
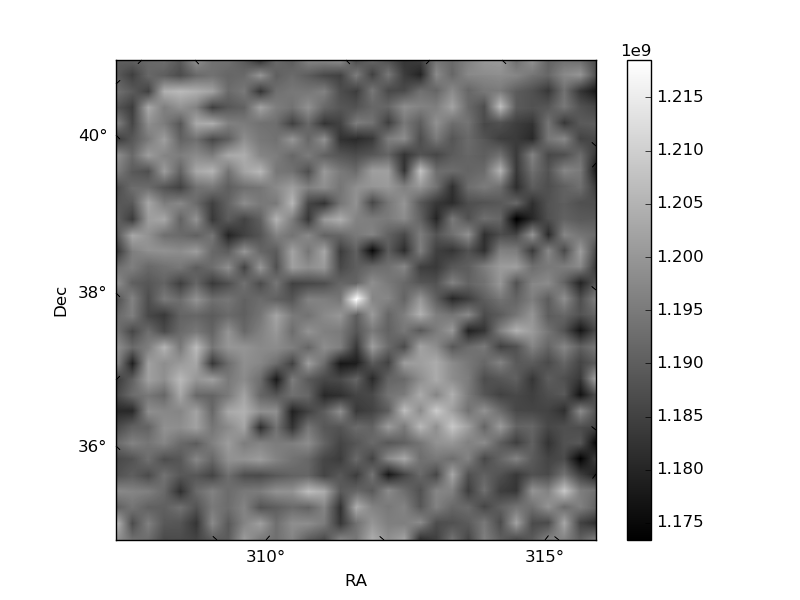
Histogram calculated using DETX and DETY for each event in the final _common_clean file
| Quadrant A | 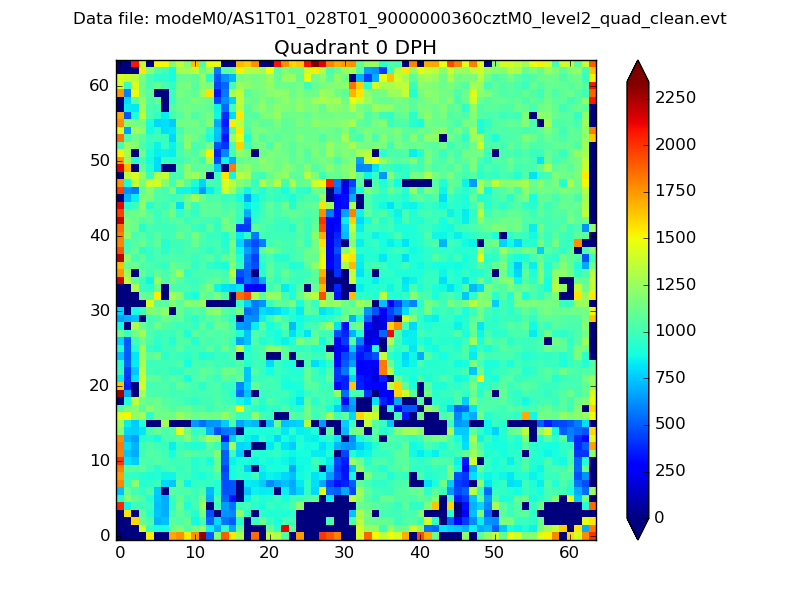 |
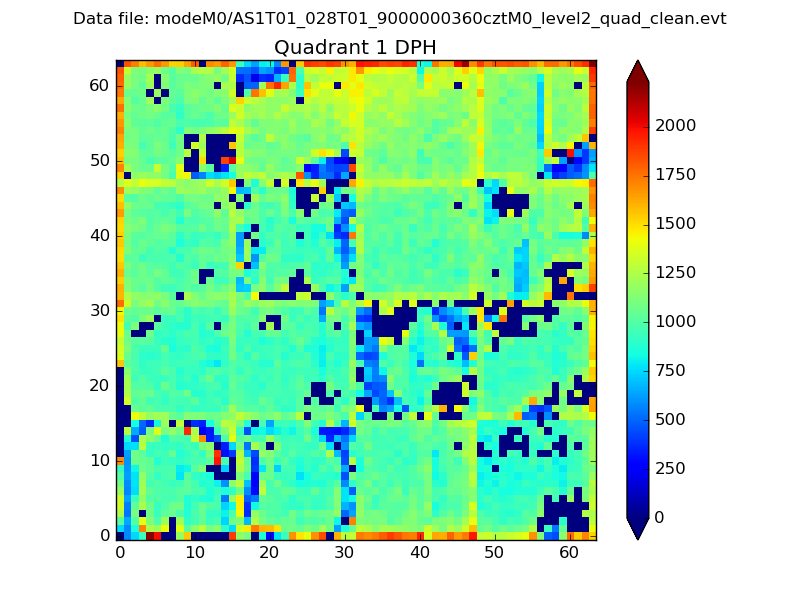 |
Quadrant B |
|---|---|---|---|
| Quadrant D | 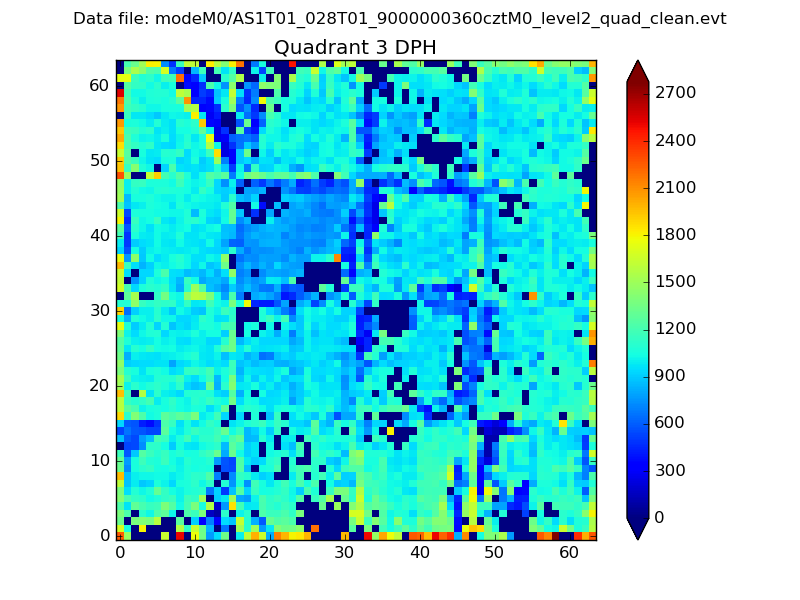 |
 |
Quadrant C |
| Plot type | Count rate plots | Images |
|---|---|---|
| Comparison with Poisson distribution Blue bars denote a histogram of data divided into 1 sec bins. Red curve is a Poisson curve with rate = median count rate of data. |
 |
 |
| Quadrant-wise count rates Data is divided into 100 sec bins |
 |
|
| Module-wise count rates for Quadrant A Data is divided into 100 sec bins |
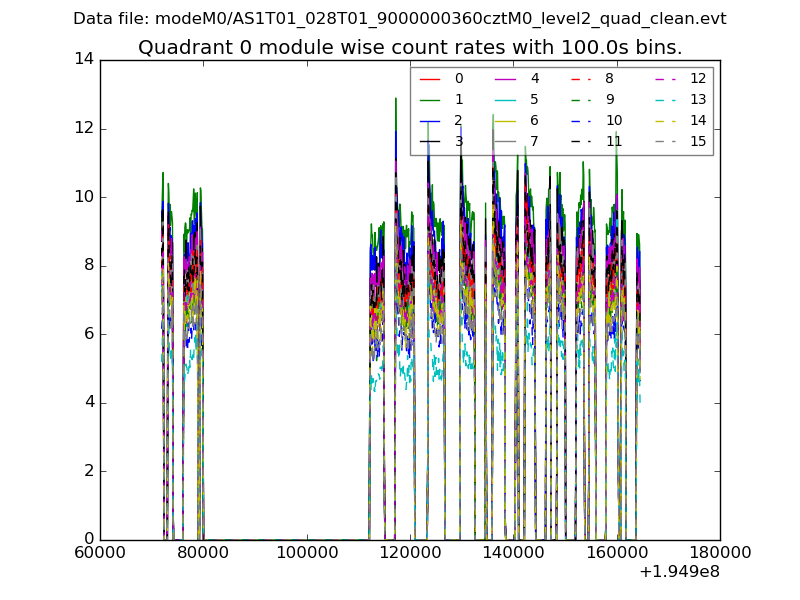 |
 |
| Module-wise count rates for Quadrant B Data is divided into 100 sec bins |
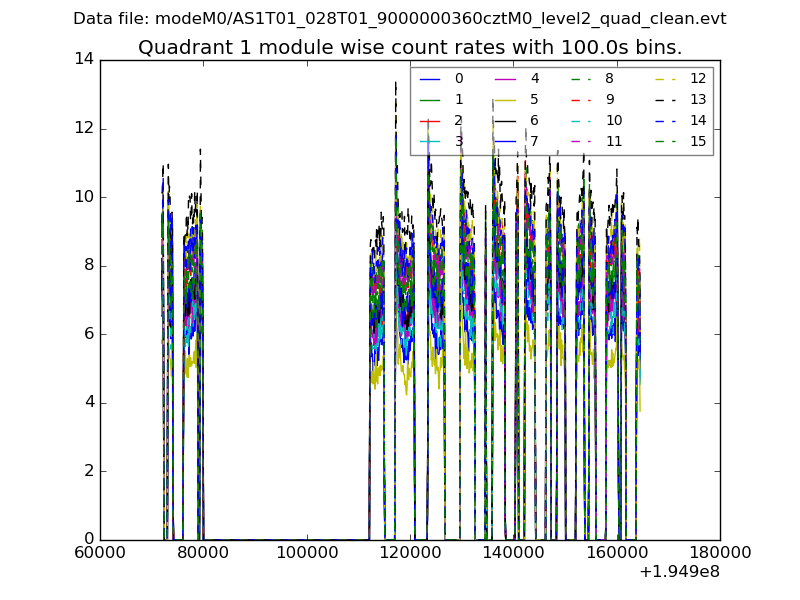 |
 |
| Module-wise count rates for Quadrant C Data is divided into 100 sec bins |
 |
 |
| Module-wise count rates for Quadrant D Data is divided into 100 sec bins |
 |
 |
| Parameter | Plot |
|---|---|
| CZT HV Monitor |  |
| D_VDD |  |
| Temperature 1 |  |
| Veto HV Monitor |  |
| Veto LLD |  |
| Alpha Counter |  |
| _CPM_Rate |  |
| CZT Counter |  |
| +2.5 Volts monitor |  |
| +5 Volts monitor |  |
| _ROLL_ROT |  |
| _Roll_DEC |  |
| _Roll_RA |  |
| Veto Counter |  |