| Param | Original file | Final file |
|---|---|---|
| Filename | modeM0/AS1T01_041T01_9000000362_02407cztM0_level2.evt | modeM0/AS1T01_041T01_9000000362_02407cztM0_level2_quad_clean.evt |
| Size (bytes) | 717,269,760 | 68,520,960 |
| Size | 684.0 MB | 65.3 MB |
| Events in quadrant A | 4,275,488 | 384,471 |
| Events in quadrant B | 3,792,996 | 390,750 |
| Events in quadrant C | 5,663,322 | 376,736 |
| Events in quadrant D | 7,458,616 | 376,191 |
| Mode SS | |||
|---|---|---|---|
| Quadrant | BADHDUFLAG | Total packets | Discarded packets |
| A | 0 | 162 | 0 |
| B | 0 | 162 | 0 |
| C | 0 | 162 | 0 |
| D | 0 | 162 | 0 |
| Mode M9 | |||
|---|---|---|---|
| Quadrant | BADHDUFLAG | Total packets | Discarded packets |
| A | 0 | 3 | 0 |
| B | 0 | 3 | 0 |
| C | 0 | 3 | 0 |
| D | 0 | 3 | 0 |
| Mode M0 | |||
|---|---|---|---|
| Quadrant | BADHDUFLAG | Total packets | Discarded packets |
| A | 0 | 17993 | 2 |
| B | 0 | 16738 | 1 |
| C | 0 | 22072 | 1 |
| D | 0 | 27846 | 1 |
| Quadrant | Total seconds | Saturated seconds | Saturation percentage |
|---|---|---|---|
| A | 7853 | 375 | 4.775245% |
| B | 7853 | 192 | 2.444926% |
| C | 7853 | 387 | 4.928053% |
| D | 7853 | 1793 | 22.832039% |
Noise dominated data is calculated using 1-second bins in cleaned event files. If a bin has >2000 counts, and if more than 50% of those come from <1% of pixels, then it is considered to be noise-dominated and hence unusable.
| Quadrant | # 1 sec bins | Bins with >0 counts | Bins with >2000 counts | High rate bins dominated by noise | Noise dominated (total time) | Noise dominated (detector-on time) | Marked lightcurve |
|---|---|---|---|---|---|---|---|
| A | 8138 | 7855 | 124 | 124 | 1.52% | 1.58% | 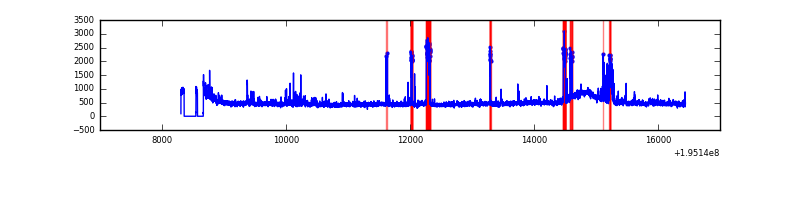 |
| B | 8138 | 7855 | 4 | 4 | 0.05% | 0.05% | 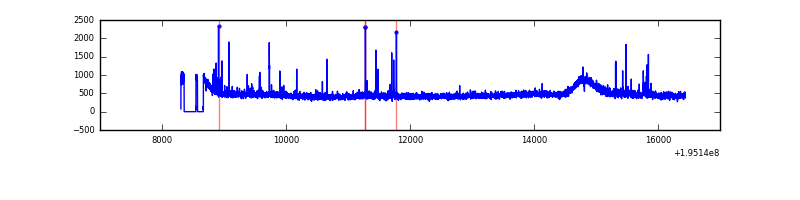 |
| C | 8138 | 7855 | 298 | 298 | 3.66% | 3.79% | 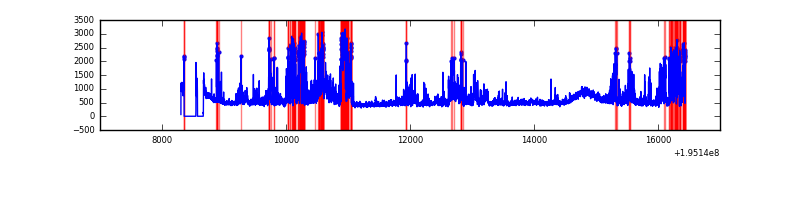 |
| D | 8138 | 7855 | 1268 | 1268 | 15.58% | 16.14% | 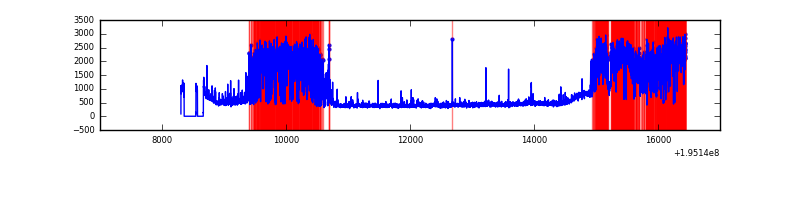 |
Top three noisy pixels from each quadrant. If the there are fewer than three noisy pixels in the level2.evt file, extra rows are filled as -1
| Pixel properties | Quadrant properties | ||||||
|---|---|---|---|---|---|---|---|
| Quadrant | DetID | PixID | Counts | Sigma | Mean | Median | Sigma |
| A | 8 | 14 | 475779 | 2450.1 | 935 | 913 | 193.8 |
| A | 8 | 15 | 124664 | 638.5 | 935 | 913 | 193.8 |
| A | 3 | 1 | 48092 | 243.42 | 935 | 913 | 193.8 |
| B | 15 | 85 | 42343 | 219.34 | 955 | 929 | 188.8 |
| B | 4 | 200 | 30071 | 154.35 | 955 | 929 | 188.8 |
| B | 10 | 244 | 26851 | 137.29 | 955 | 929 | 188.8 |
| C | 5 | 234 | 2053309 | 9599.53 | 904 | 907 | 213.8 |
| C | 14 | 223 | 61099 | 281.53 | 904 | 907 | 213.8 |
| C | 1 | 3 | 8853 | 37.17 | 904 | 907 | 213.8 |
| D | 9 | 66 | 4122487 | 20694.67 | 828 | 805 | 199.2 |
| D | 11 | 130 | 61798 | 306.24 | 828 | 805 | 199.2 |
| D | 2 | 31 | 30982 | 151.52 | 828 | 805 | 199.2 |
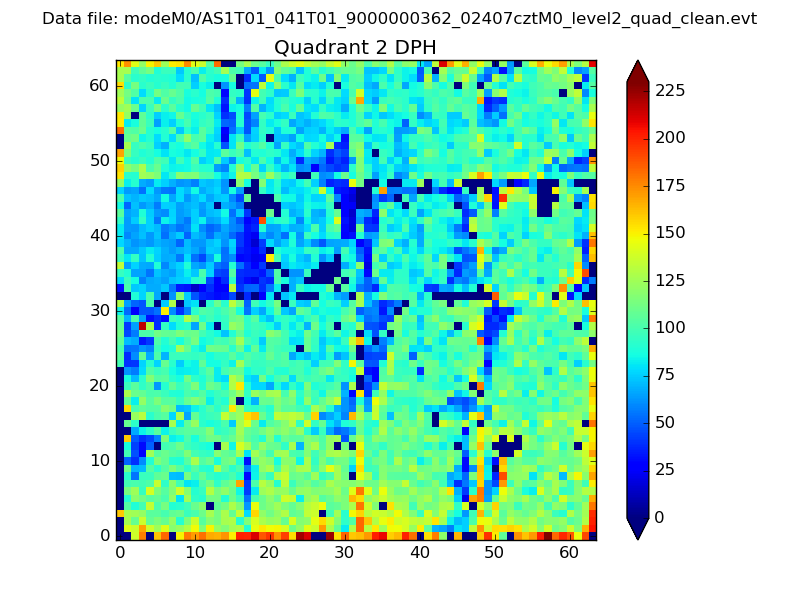
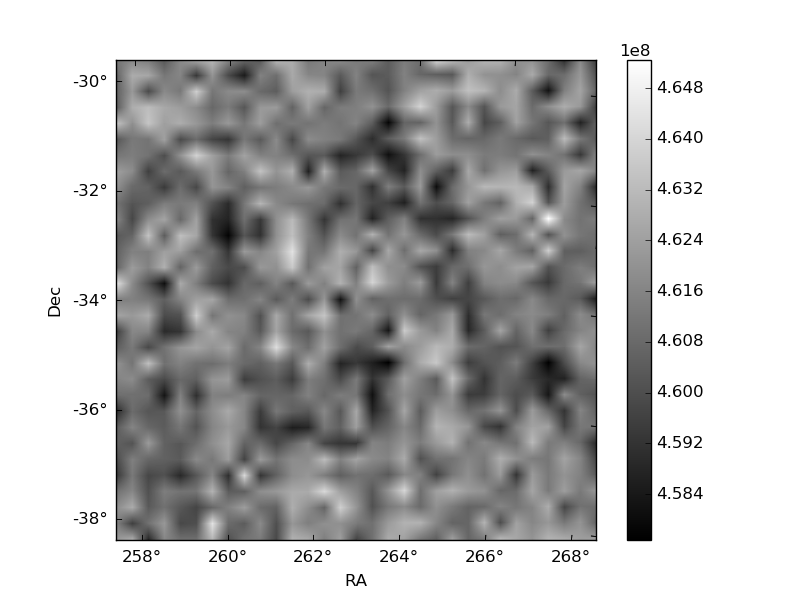
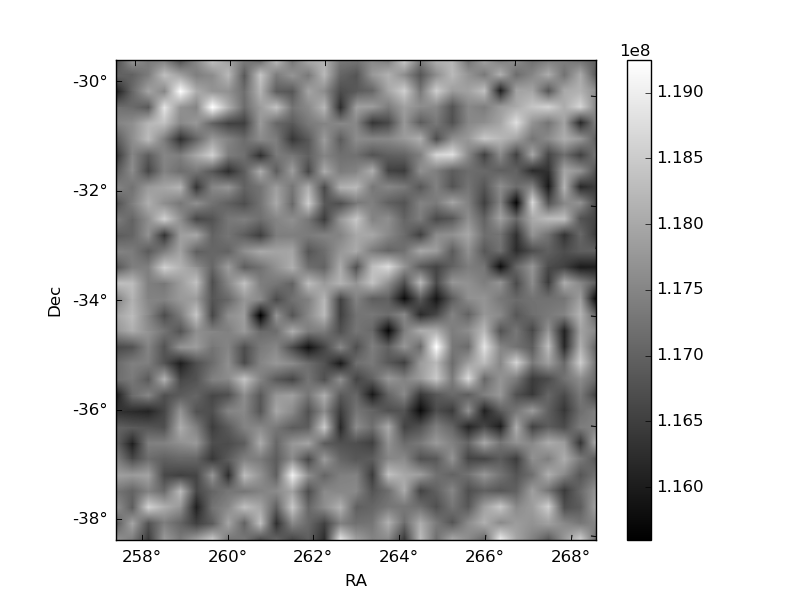
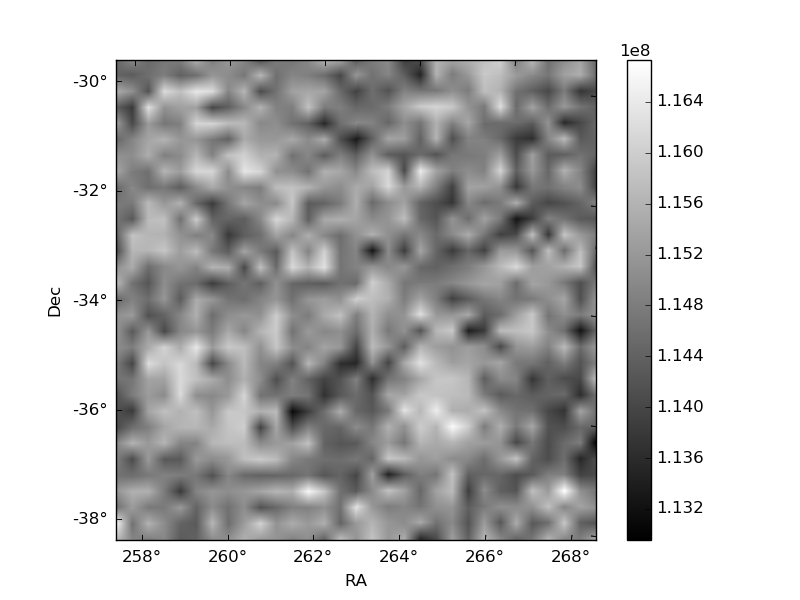
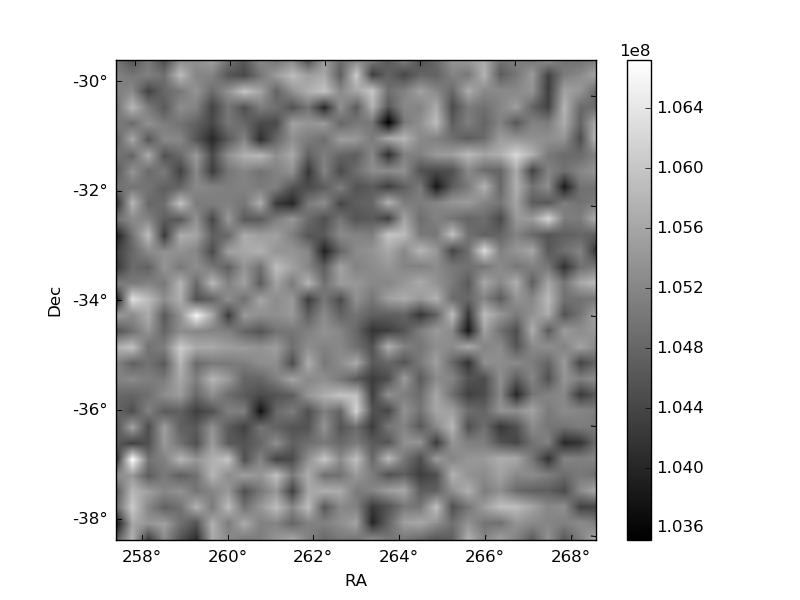
Histogram calculated using DETX and DETY for each event in the final _common_clean file
| Quadrant A | 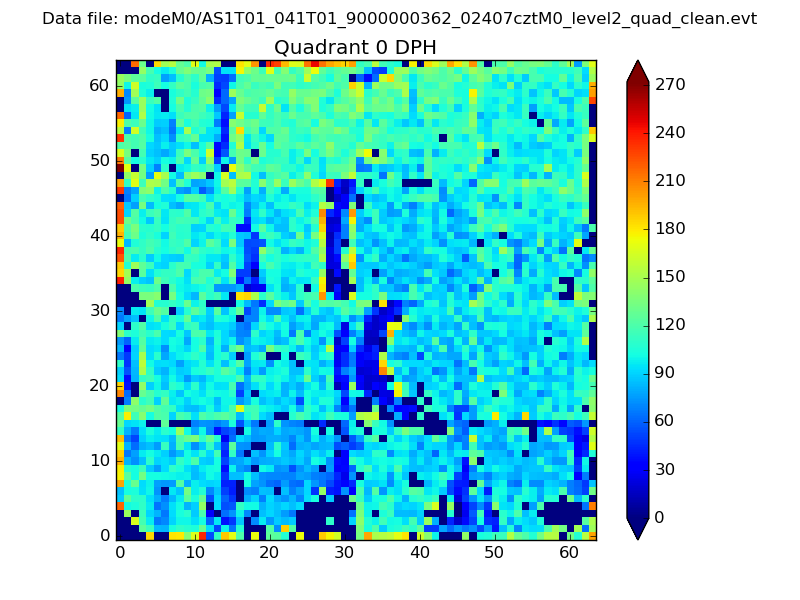 |
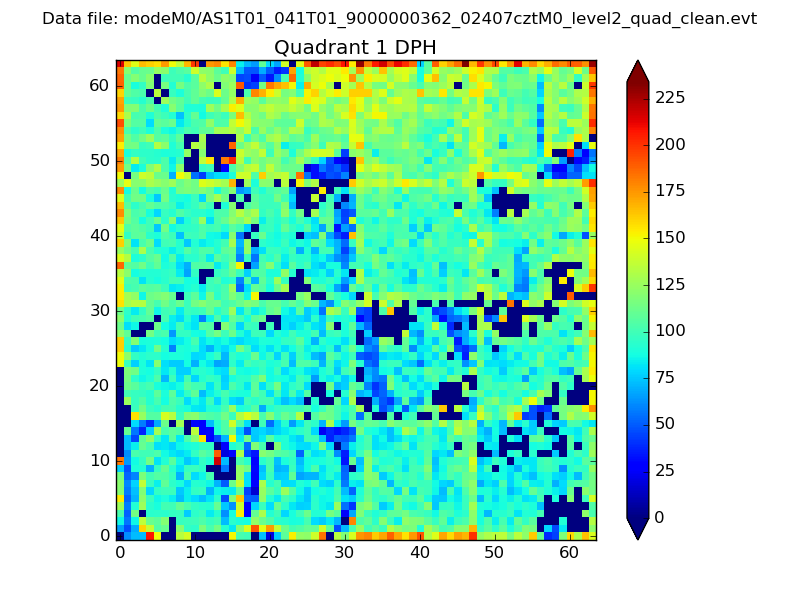 |
Quadrant B |
|---|---|---|---|
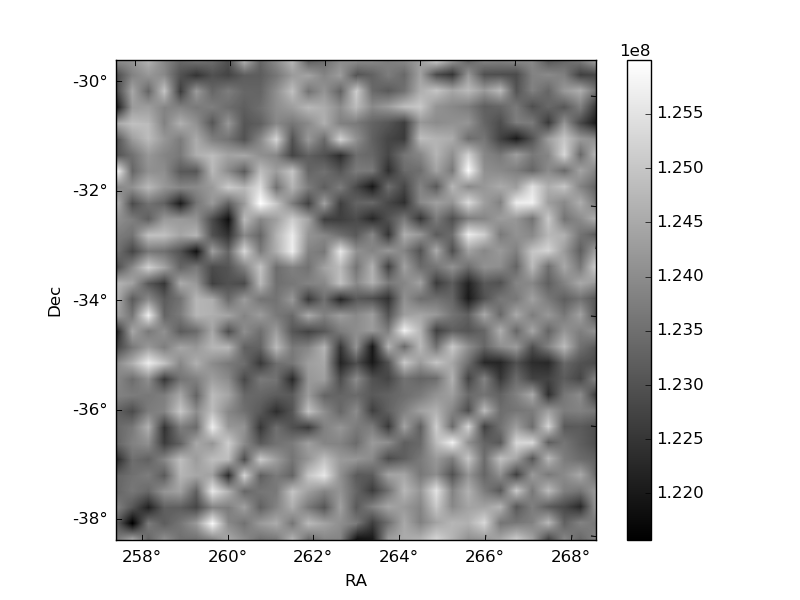
| Quadrant D | 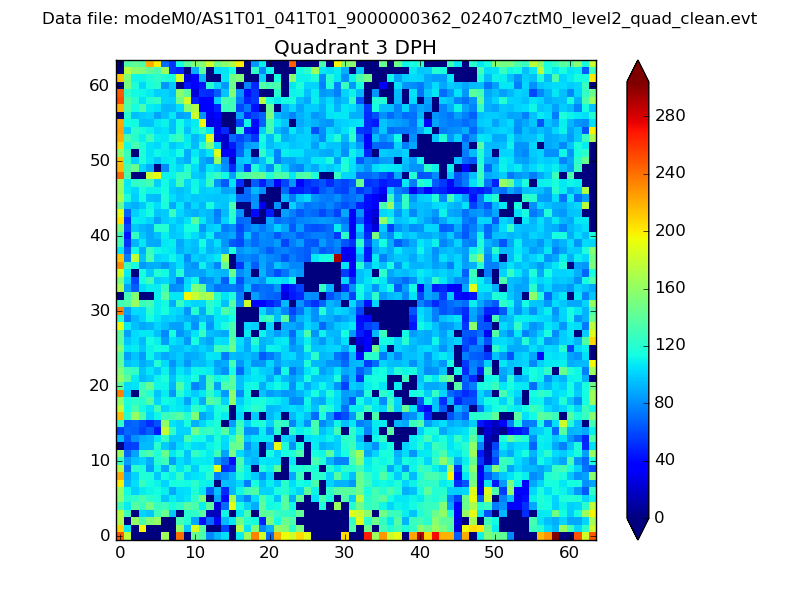 |
 |
Quadrant C |
| Plot type | Count rate plots | Images |
|---|---|---|
| Comparison with Poisson distribution Blue bars denote a histogram of data divided into 1 sec bins. Red curve is a Poisson curve with rate = median count rate of data. |
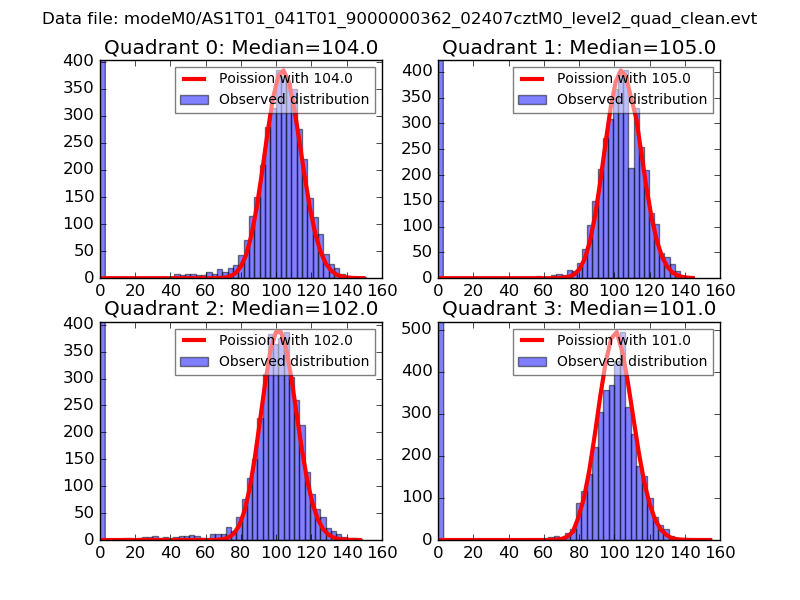 |
 |
| Quadrant-wise count rates Data is divided into 100 sec bins |
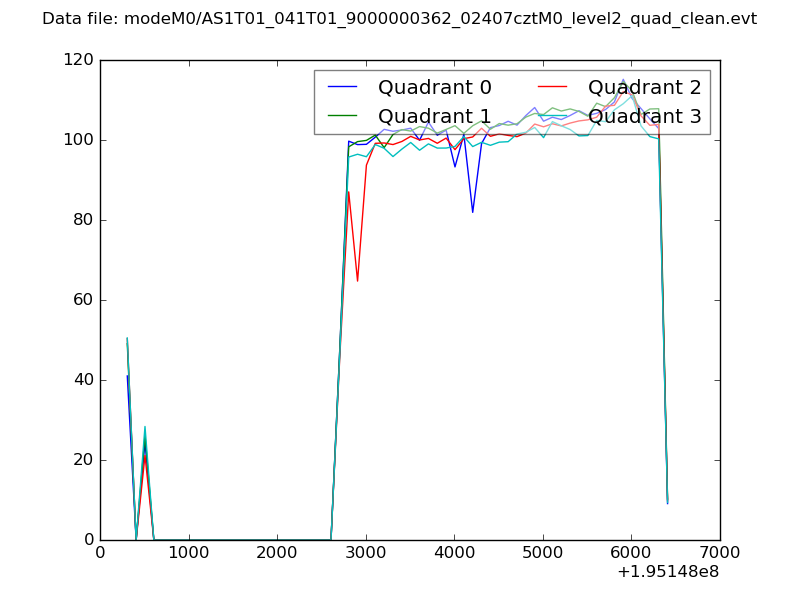 |
|
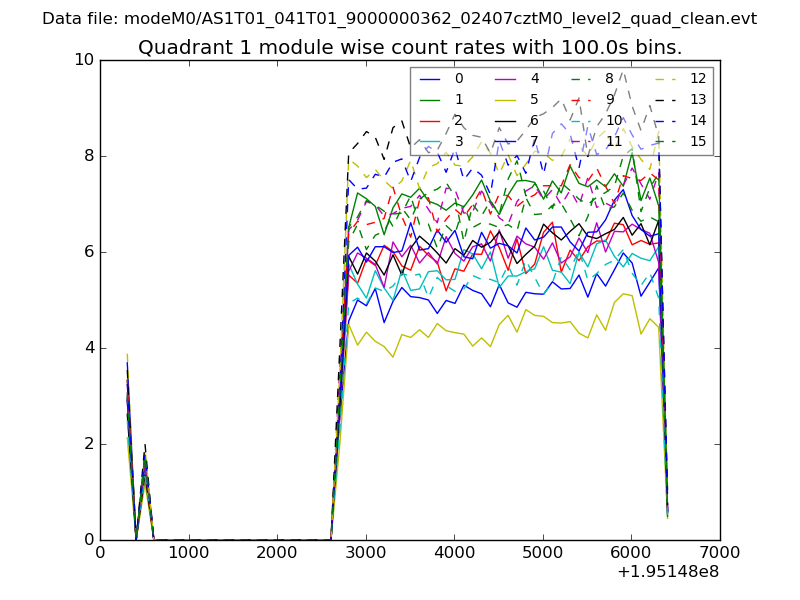
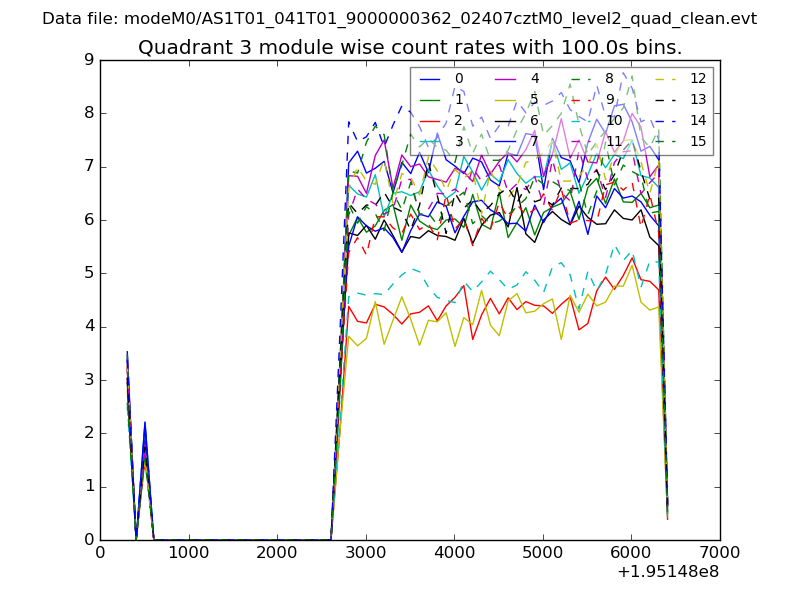
| Module-wise count rates for Quadrant A Data is divided into 100 sec bins |
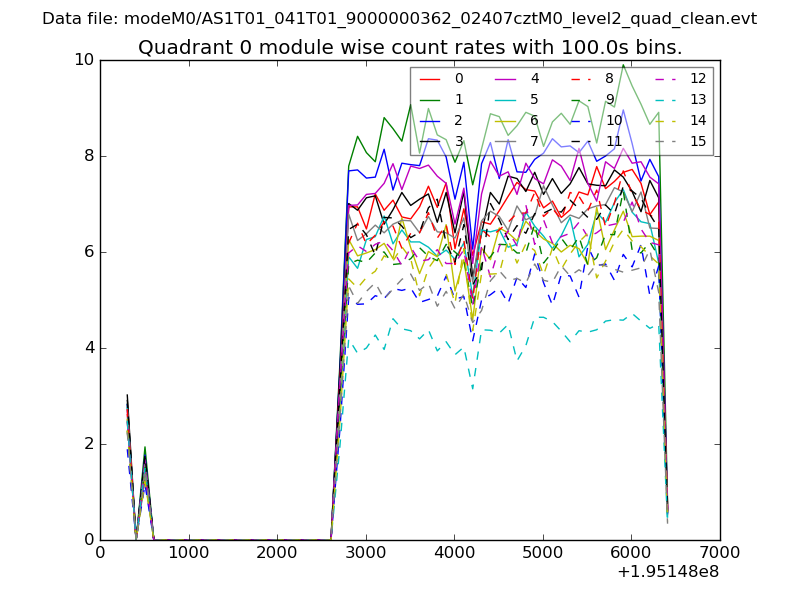 |
 |
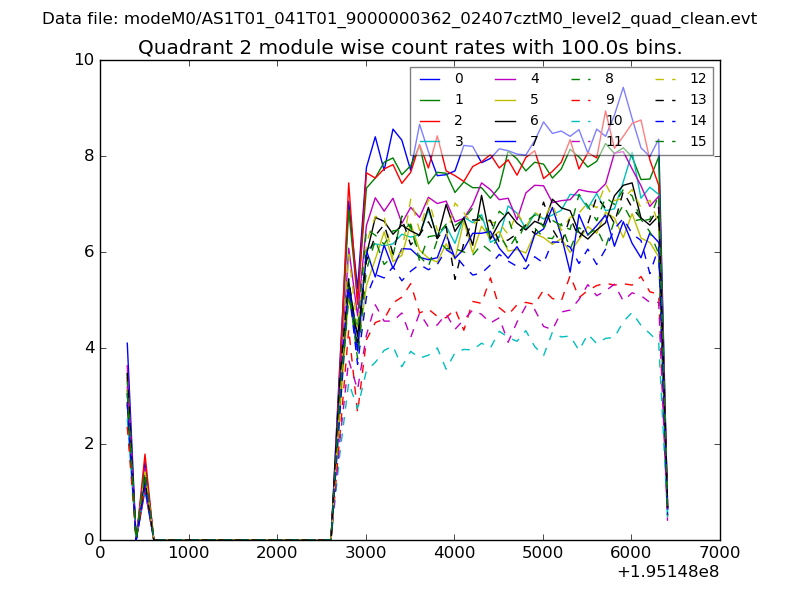
| Module-wise count rates for Quadrant B Data is divided into 100 sec bins |
 |
 |
| Module-wise count rates for Quadrant C Data is divided into 100 sec bins |
 |
 |
| Module-wise count rates for Quadrant D Data is divided into 100 sec bins |
 |
 |
| Parameter | Plot |
|---|---|
| CZT HV Monitor | 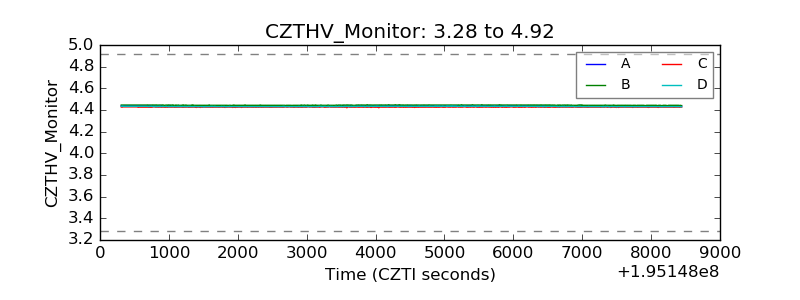 |
| D_VDD | 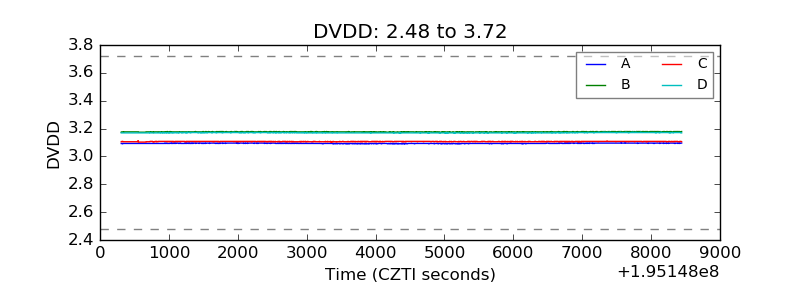 |
| Temperature 1 | 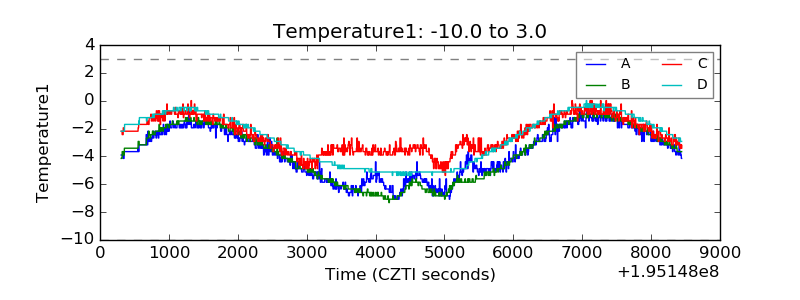 |
| Veto HV Monitor | 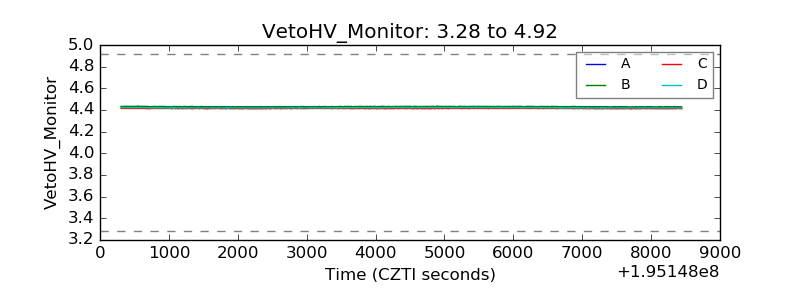 |
| Veto LLD | 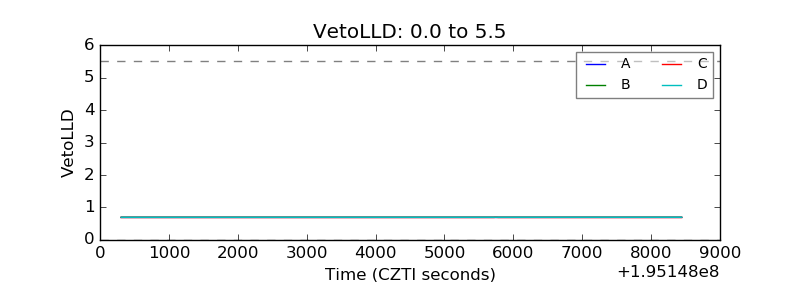 |
| Alpha Counter | 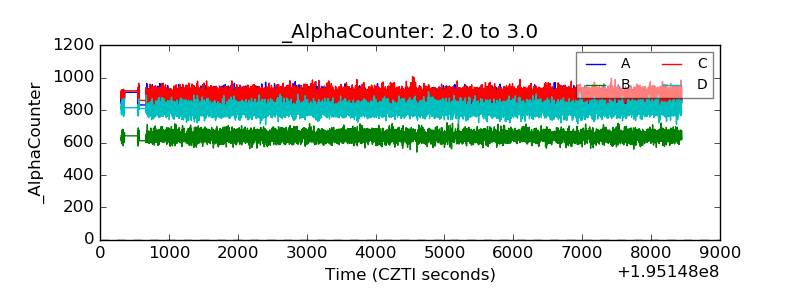 |
| _CPM_Rate | 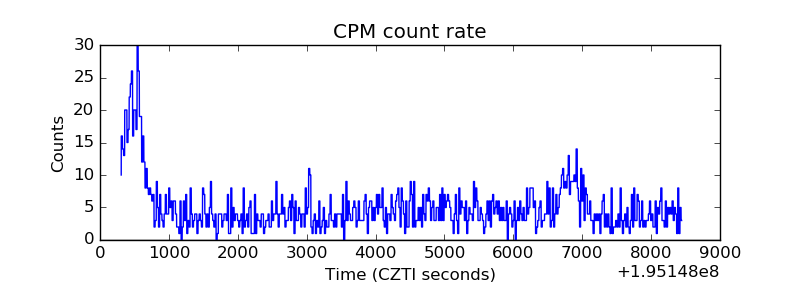 |
| CZT Counter | 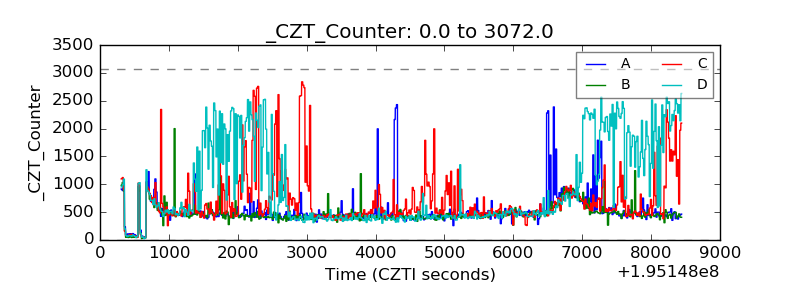 |
| +2.5 Volts monitor |  |
| +5 Volts monitor | 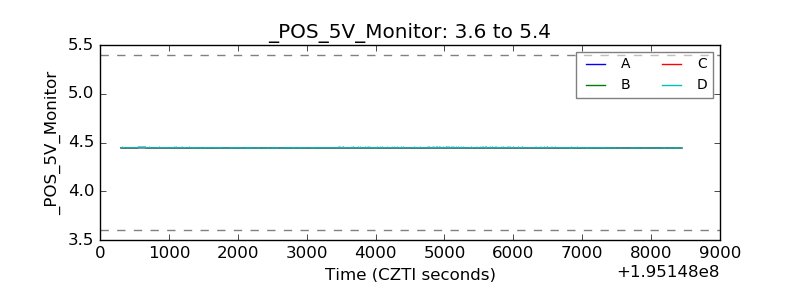 |
| _ROLL_ROT | 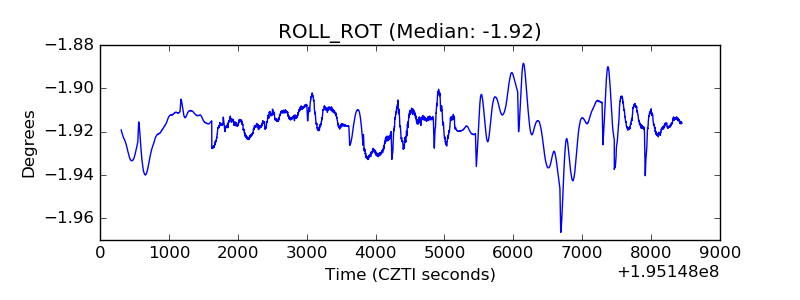 |
| _Roll_DEC | 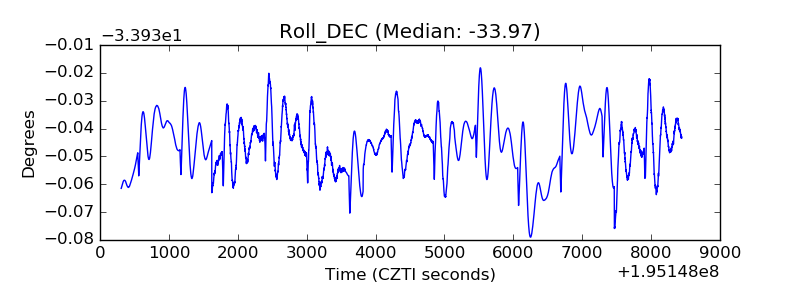 |
| _Roll_RA | 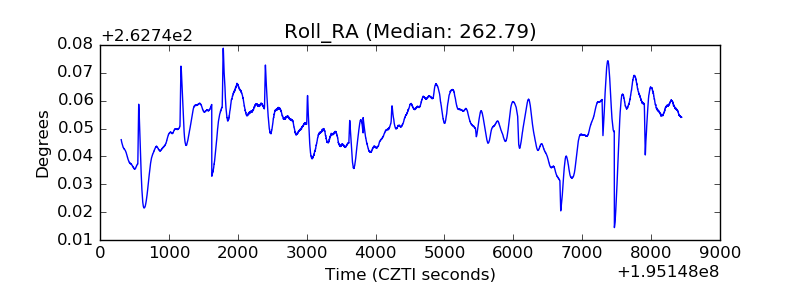 |
| Veto Counter | 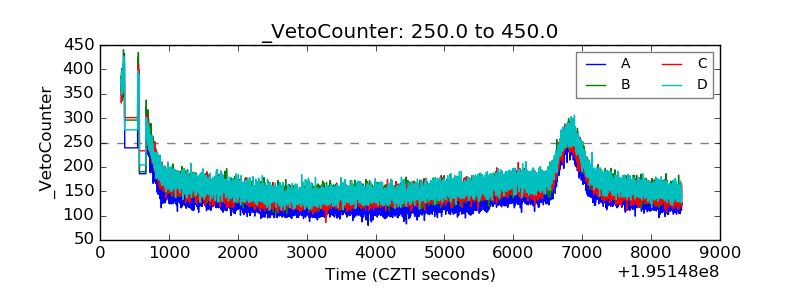 |