| Param | Original file | Final file |
|---|---|---|
| Filename | modeM0/AS1T01_042T01_9000000366_02426cztM0_level2.evt | modeM0/AS1T01_042T01_9000000366_02426cztM0_level2_quad_clean.evt |
| Size (bytes) | 547,744,320 | 82,218,240 |
| Size | 522.4 MB | 78.4 MB |
| Events in quadrant A | 5,239,174 | 498,110 |
| Events in quadrant B | 3,372,233 | 516,011 |
| Events in quadrant C | 3,995,417 | 504,338 |
| Events in quadrant D | 3,506,544 | 483,396 |
| Mode M9 | |||
|---|---|---|---|
| Quadrant | BADHDUFLAG | Total packets | Discarded packets |
| A | 0 | 16 | 0 |
| B | 0 | 16 | 0 |
| C | 0 | 16 | 0 |
| D | 0 | 16 | 0 |
| Mode SS | |||
|---|---|---|---|
| Quadrant | BADHDUFLAG | Total packets | Discarded packets |
| A | 0 | 144 | 0 |
| B | 0 | 144 | 0 |
| C | 0 | 144 | 0 |
| D | 0 | 144 | 0 |
| Mode M0 | |||
|---|---|---|---|
| Quadrant | BADHDUFLAG | Total packets | Discarded packets |
| A | 0 | 20391 | 3 |
| B | 0 | 14726 | 2 |
| C | 0 | 16351 | 2 |
| D | 0 | 15503 | 2 |
| Quadrant | Total seconds | Saturated seconds | Saturation percentage |
|---|---|---|---|
| A | 7003 | 613 | 8.753391% |
| B | 7003 | 34 | 0.485506% |
| C | 7003 | 58 | 0.828216% |
| D | 7003 | 120 | 1.713551% |
Noise dominated data is calculated using 1-second bins in cleaned event files. If a bin has >2000 counts, and if more than 50% of those come from <1% of pixels, then it is considered to be noise-dominated and hence unusable.
| Quadrant | # 1 sec bins | Bins with >0 counts | Bins with >2000 counts | High rate bins dominated by noise | Noise dominated (total time) | Noise dominated (detector-on time) | Marked lightcurve |
|---|---|---|---|---|---|---|---|
| A | 8593 | 7005 | 404 | 404 | 4.70% | 5.77% | 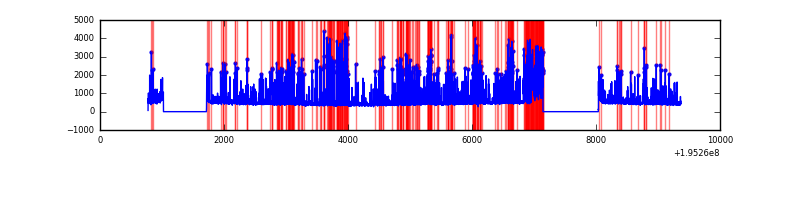 |
| B | 8593 | 7005 | 1 | 1 | 0.01% | 0.01% | 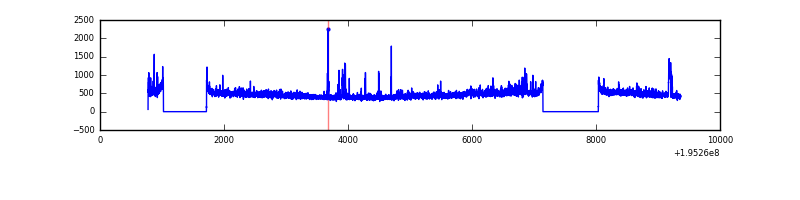 |
| C | 8593 | 7005 | 12 | 12 | 0.14% | 0.17% | 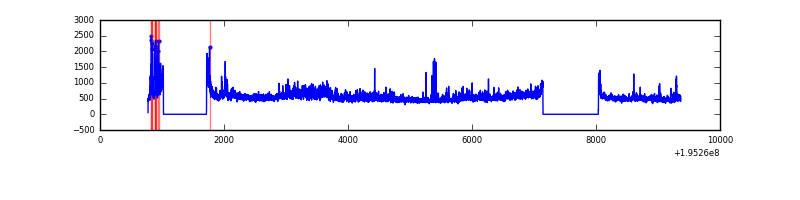 |
| D | 8593 | 7004 | 74 | 74 | 0.86% | 1.06% | 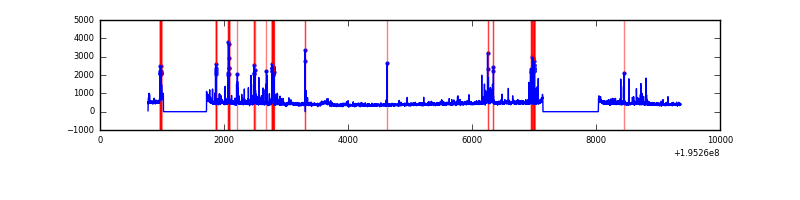 |
Top three noisy pixels from each quadrant. If the there are fewer than three noisy pixels in the level2.evt file, extra rows are filled as -1
| Pixel properties | Quadrant properties | ||||||
|---|---|---|---|---|---|---|---|
| Quadrant | DetID | PixID | Counts | Sigma | Mean | Median | Sigma |
| A | 8 | 14 | 2016769 | 12535.85 | 781 | 763 | 160.8 |
| A | 8 | 15 | 104272 | 643.63 | 781 | 763 | 160.8 |
| A | 15 | 31 | 73577 | 452.77 | 781 | 763 | 160.8 |
| B | 6 | 36 | 55411 | 343.39 | 825 | 804 | 159.0 |
| B | 4 | 200 | 47499 | 293.64 | 825 | 804 | 159.0 |
| B | 0 | 182 | 25671 | 156.38 | 825 | 804 | 159.0 |
| C | 5 | 234 | 887323 | 4738.28 | 790 | 793 | 187.1 |
| C | 1 | 3 | 8454 | 40.95 | 790 | 793 | 187.1 |
| C | 13 | 61 | 7025 | 33.31 | 790 | 793 | 187.1 |
| D | 7 | 67 | 128237 | 683.97 | 773 | 755 | 186.4 |
| D | 13 | 53 | 120746 | 643.78 | 773 | 755 | 186.4 |
| D | 13 | 169 | 81897 | 435.35 | 773 | 755 | 186.4 |
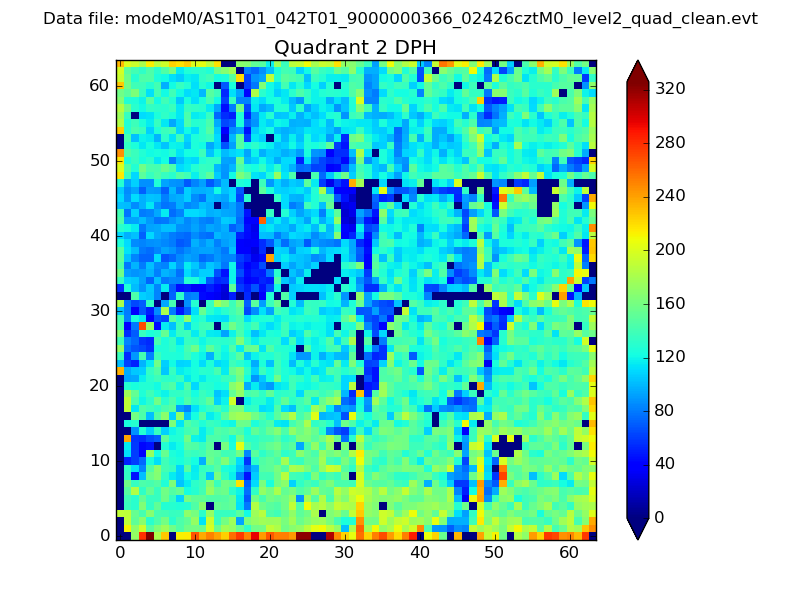
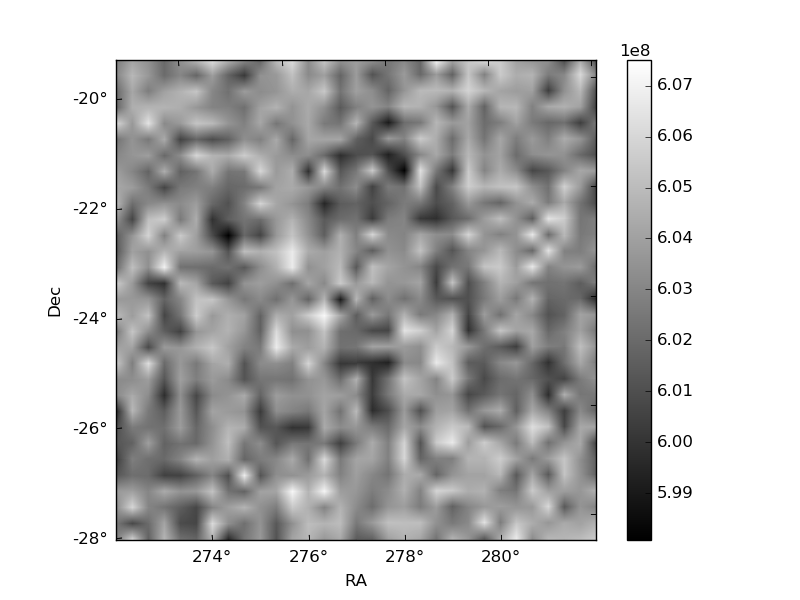
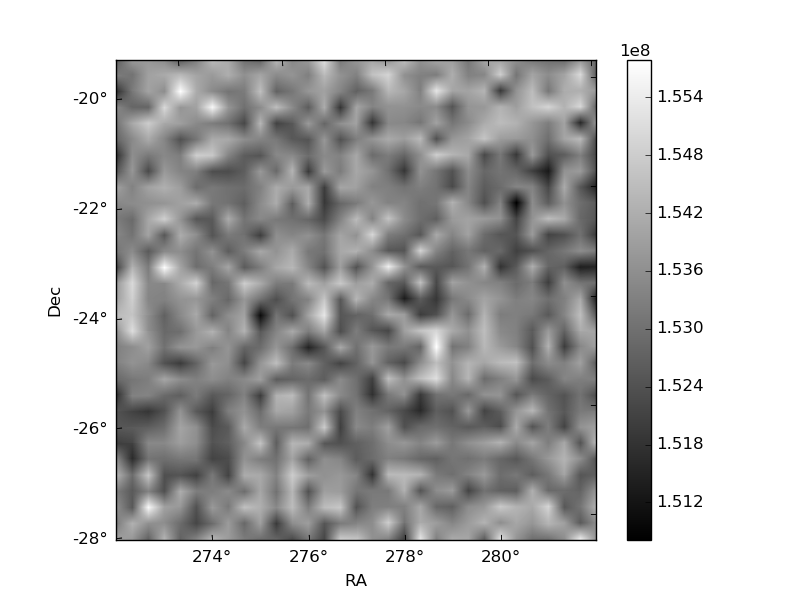
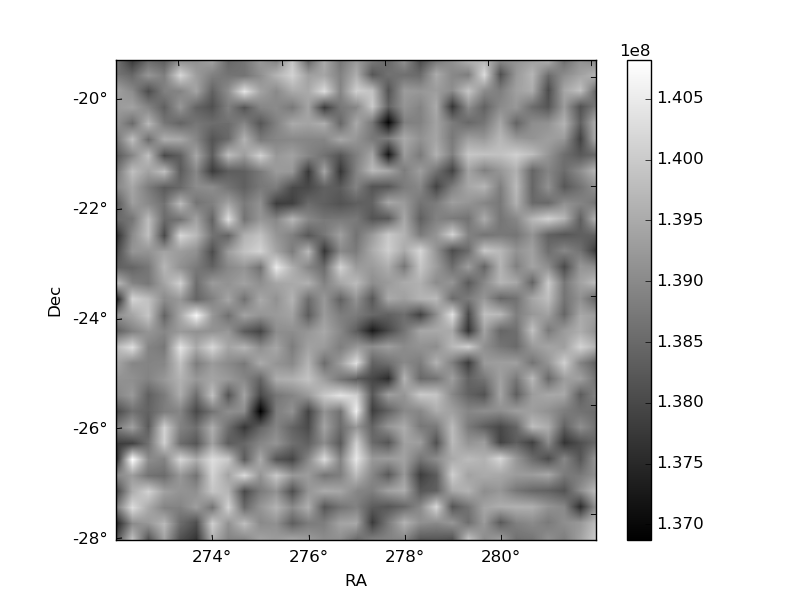
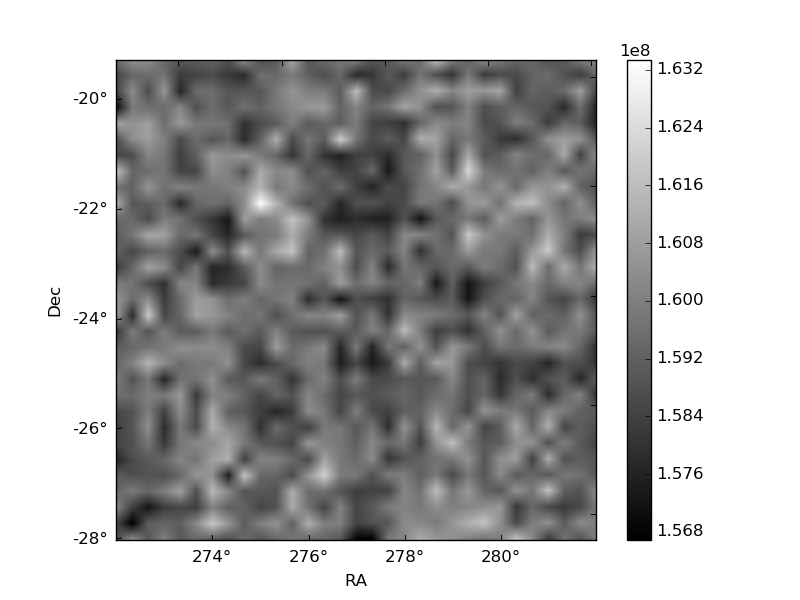
Histogram calculated using DETX and DETY for each event in the final _common_clean file
| Quadrant A | 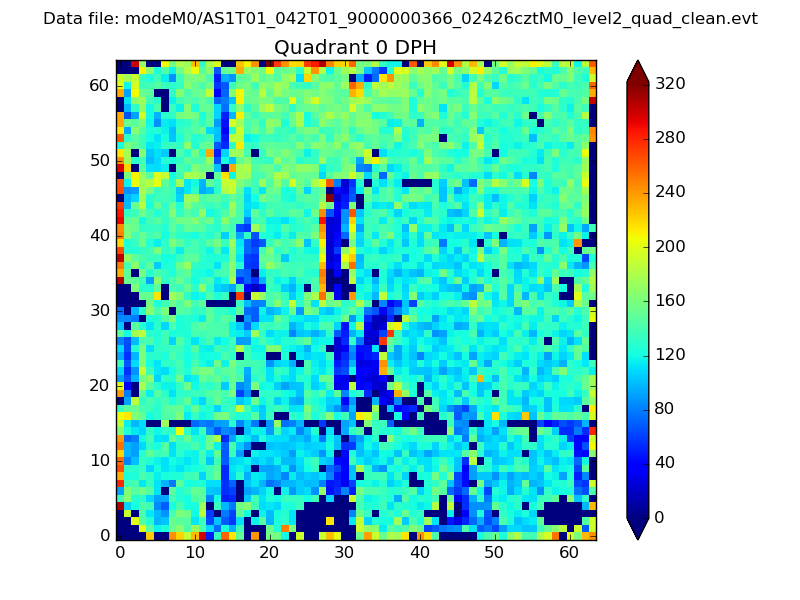 |
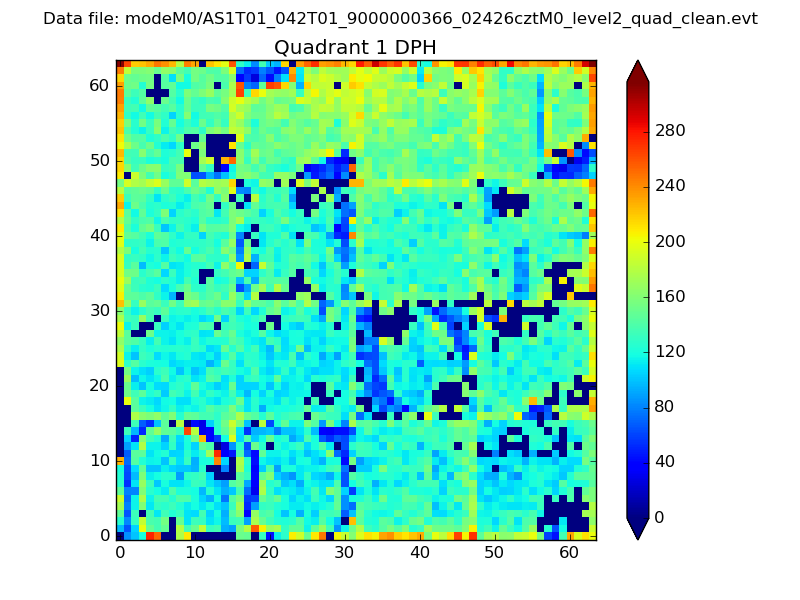 |
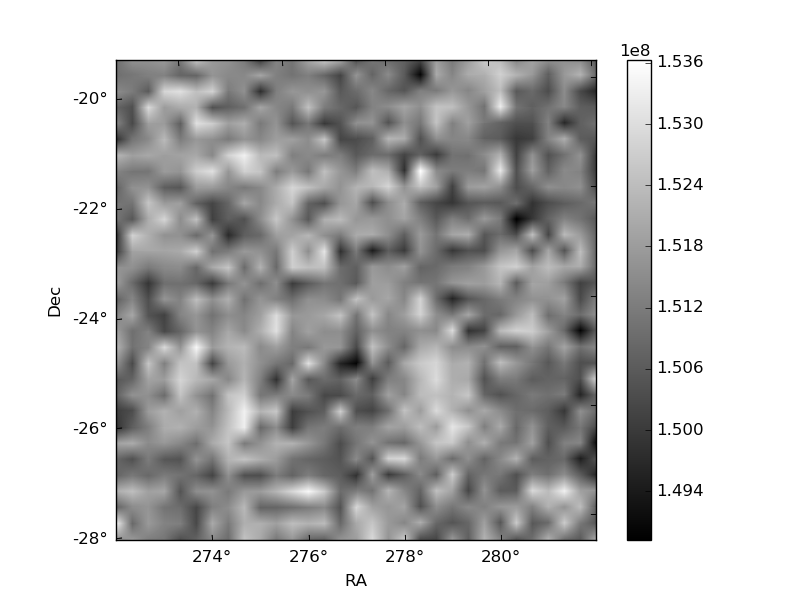
Quadrant B |
|---|---|---|---|
| Quadrant D | 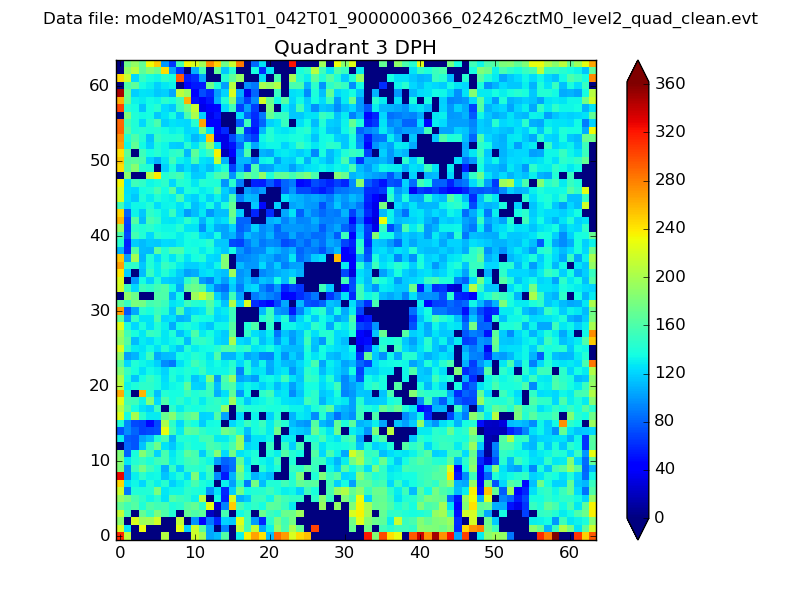 |
 |
Quadrant C |
| Plot type | Count rate plots | Images |
|---|---|---|
| Comparison with Poisson distribution Blue bars denote a histogram of data divided into 1 sec bins. Red curve is a Poisson curve with rate = median count rate of data. |
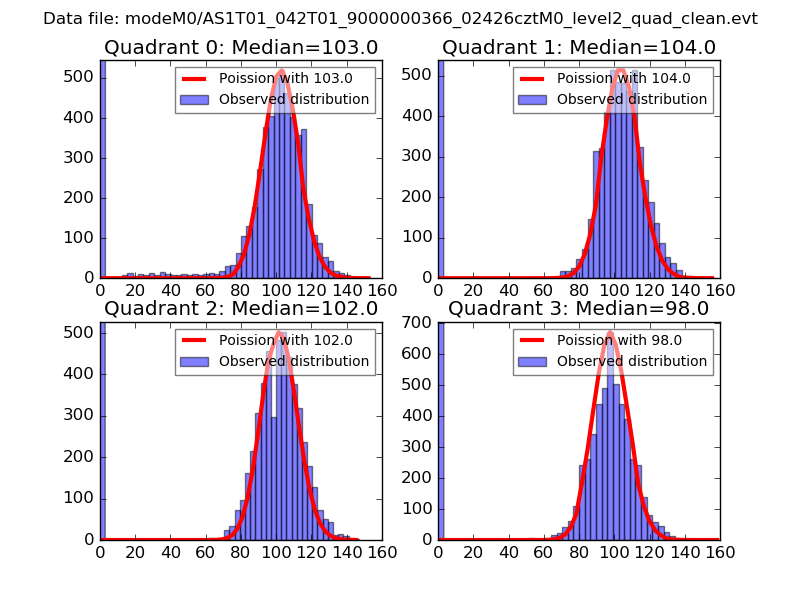 |
 |
| Quadrant-wise count rates Data is divided into 100 sec bins |
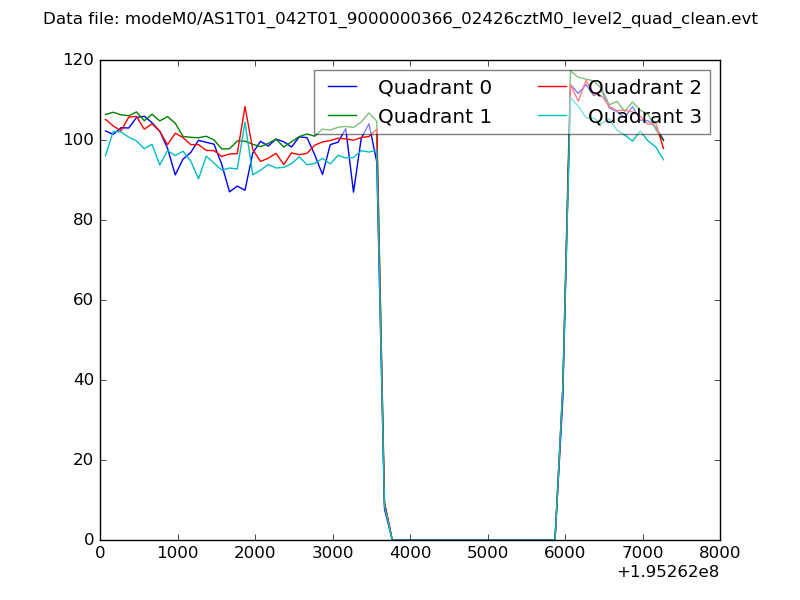 |
|
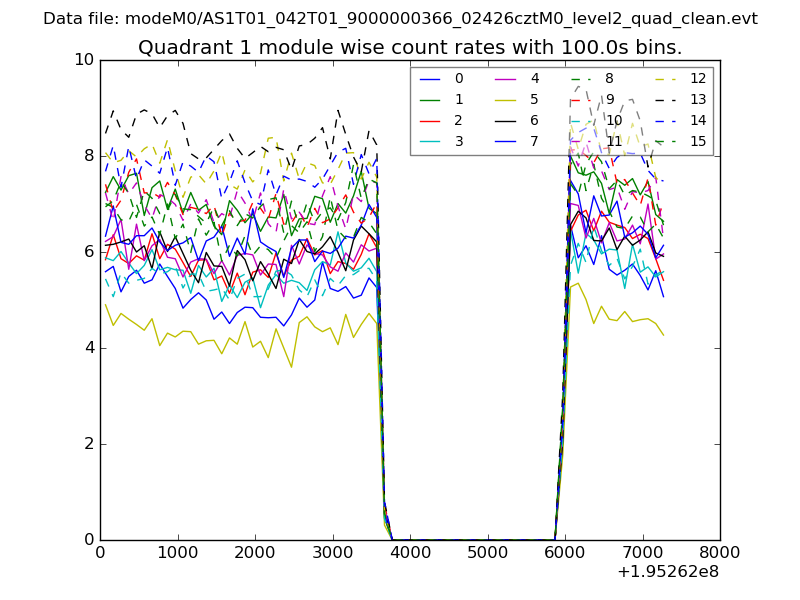
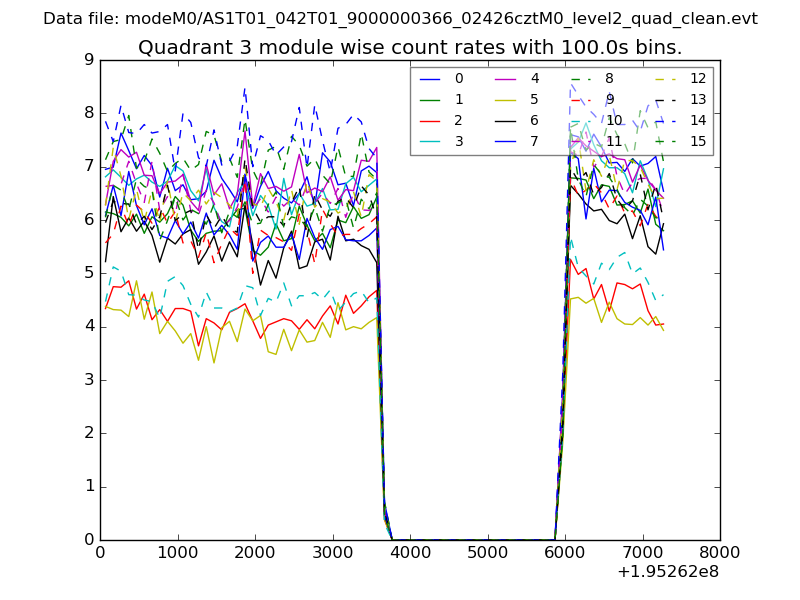
| Module-wise count rates for Quadrant A Data is divided into 100 sec bins |
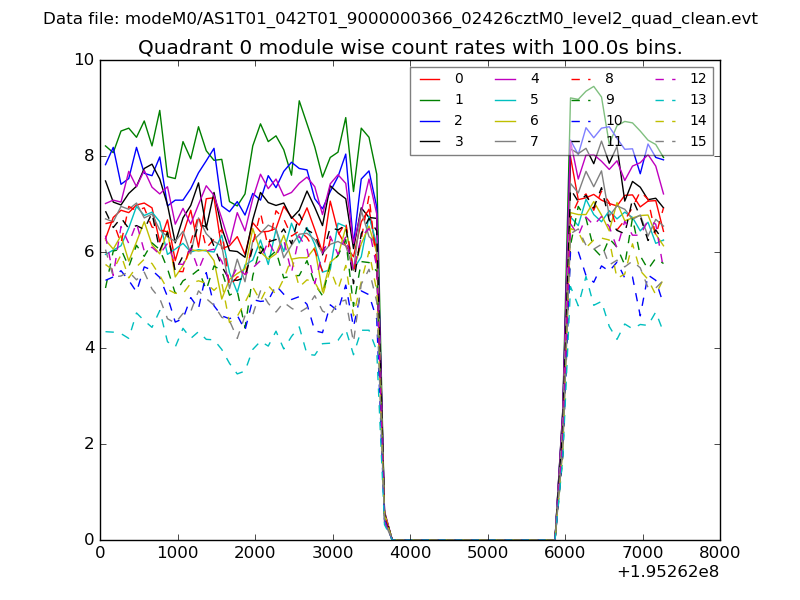 |
 |
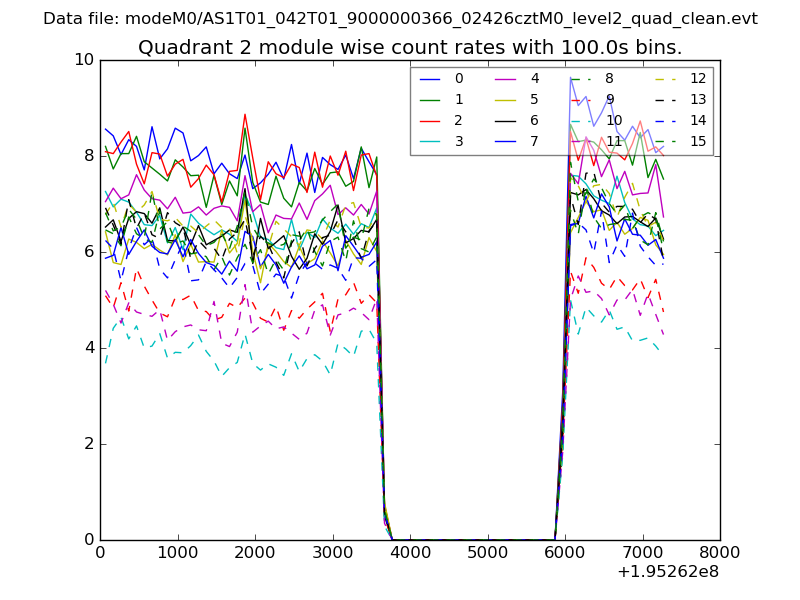
| Module-wise count rates for Quadrant B Data is divided into 100 sec bins |
 |
 |
| Module-wise count rates for Quadrant C Data is divided into 100 sec bins |
 |
 |
| Module-wise count rates for Quadrant D Data is divided into 100 sec bins |
 |
 |
| Parameter | Plot |
|---|---|
| CZT HV Monitor |  |
| D_VDD | 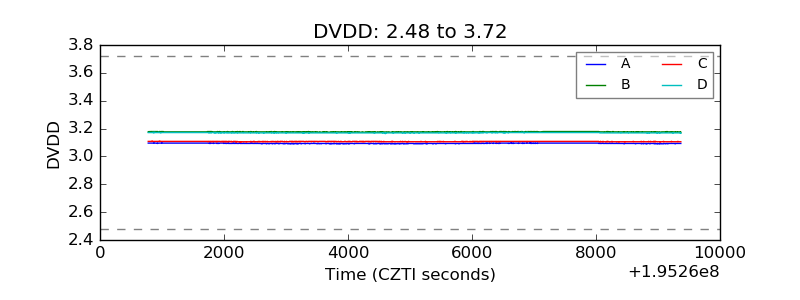 |
| Temperature 1 | 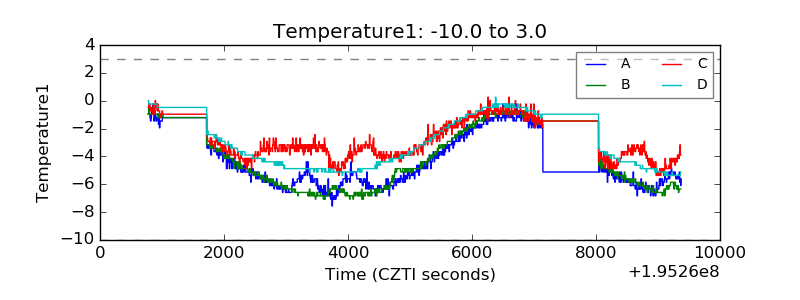 |
| Veto HV Monitor | 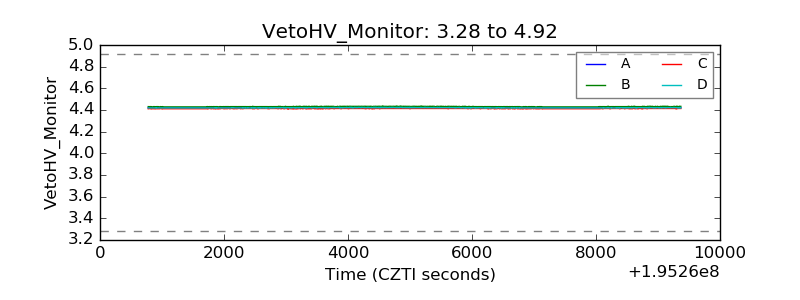 |
| Veto LLD | 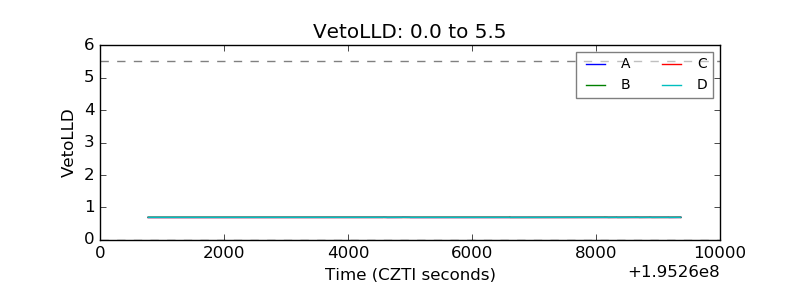 |
| Alpha Counter | 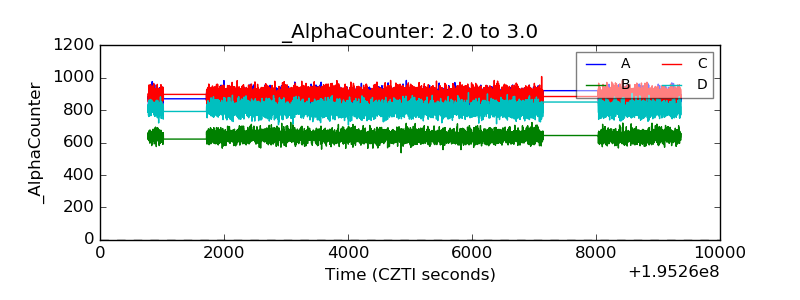 |
| _CPM_Rate | 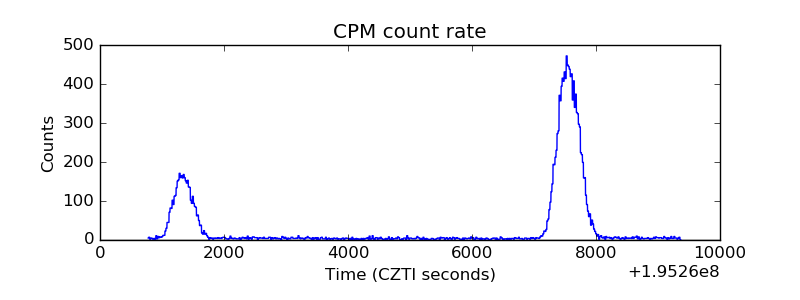 |
| CZT Counter | 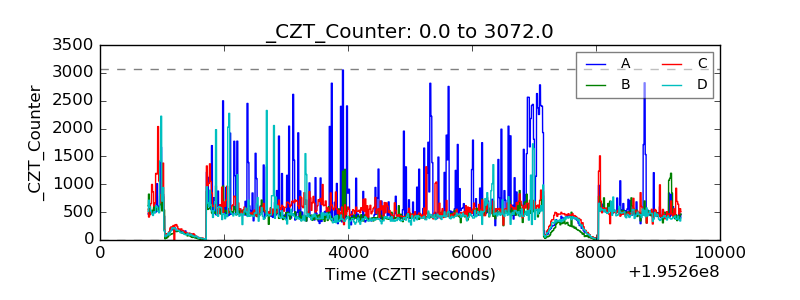 |
| +2.5 Volts monitor | 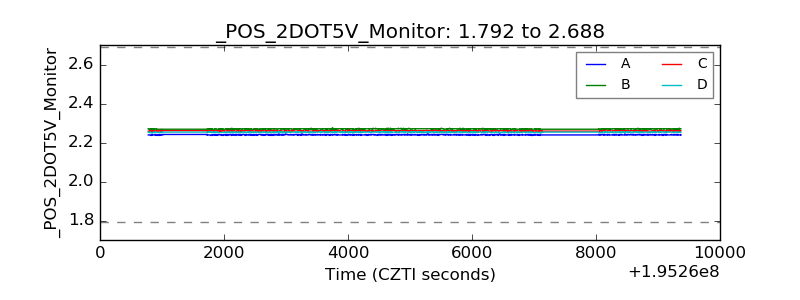 |
| +5 Volts monitor | 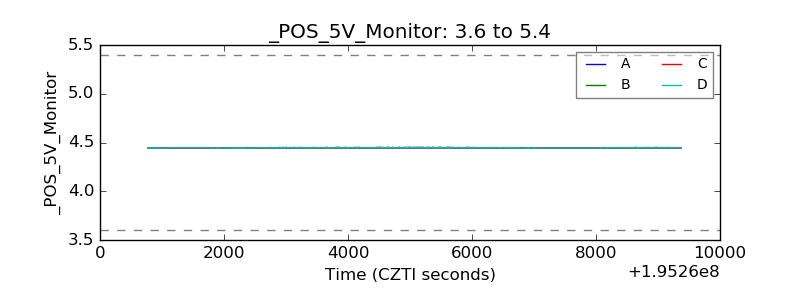 |
| _ROLL_ROT | 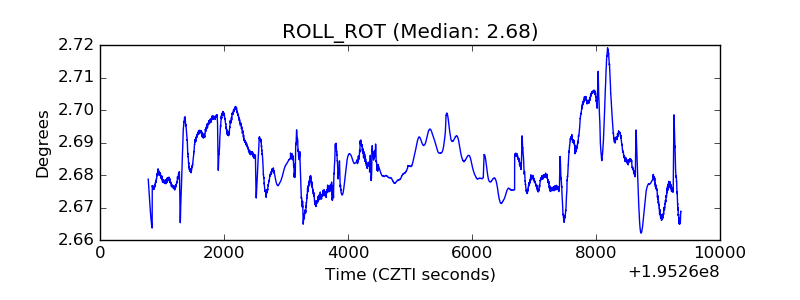 |
| _Roll_DEC | 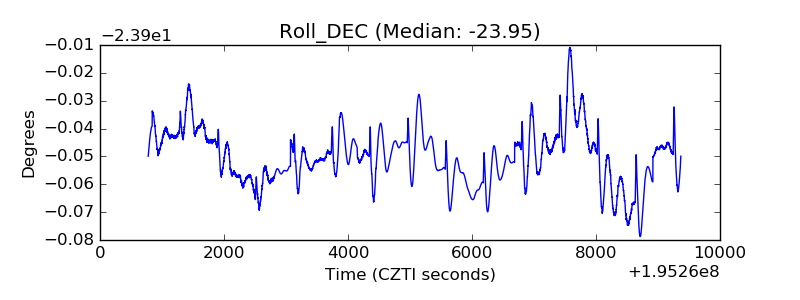 |
| _Roll_RA | 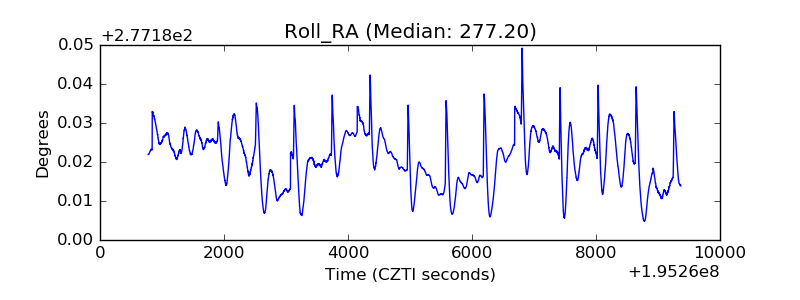 |
| Veto Counter | 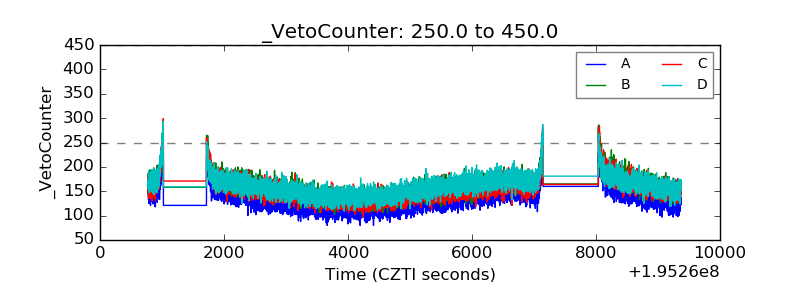 |