| Param | Original file | Final file |
|---|---|---|
| Filename | modeM0/AS1T01_042T01_9000000366_02431cztM0_level2.evt | modeM0/AS1T01_042T01_9000000366_02431cztM0_level2_quad_clean.evt |
| Size (bytes) | 431,879,040 | 77,198,400 |
| Size | 411.9 MB | 73.6 MB |
| Events in quadrant A | 3,021,282 | 483,813 |
| Events in quadrant B | 3,035,784 | 488,763 |
| Events in quadrant C | 3,326,796 | 473,611 |
| Events in quadrant D | 3,270,649 | 455,163 |
| Mode M9 | |||
|---|---|---|---|
| Quadrant | BADHDUFLAG | Total packets | Discarded packets |
| A | 0 | 12 | 0 |
| B | 0 | 12 | 0 |
| C | 0 | 12 | 0 |
| D | 0 | 12 | 0 |
| Mode SS | |||
|---|---|---|---|
| Quadrant | BADHDUFLAG | Total packets | Discarded packets |
| A | 0 | 128 | 0 |
| B | 0 | 128 | 0 |
| C | 0 | 128 | 0 |
| D | 0 | 128 | 0 |
| Mode M0 | |||
|---|---|---|---|
| Quadrant | BADHDUFLAG | Total packets | Discarded packets |
| A | 0 | 12920 | 2 |
| B | 0 | 13007 | 1 |
| C | 0 | 13822 | 1 |
| D | 0 | 13889 | 1 |
| Quadrant | Total seconds | Saturated seconds | Saturation percentage |
|---|---|---|---|
| A | 6246 | 50 | 0.800512% |
| B | 6246 | 62 | 0.992635% |
| C | 6246 | 41 | 0.656420% |
| D | 6246 | 114 | 1.825168% |
Noise dominated data is calculated using 1-second bins in cleaned event files. If a bin has >2000 counts, and if more than 50% of those come from <1% of pixels, then it is considered to be noise-dominated and hence unusable.
| Quadrant | # 1 sec bins | Bins with >0 counts | Bins with >2000 counts | High rate bins dominated by noise | Noise dominated (total time) | Noise dominated (detector-on time) | Marked lightcurve |
|---|---|---|---|---|---|---|---|
| A | 7506 | 6247 | 0 | 0 | 0.00% | 0.00% | 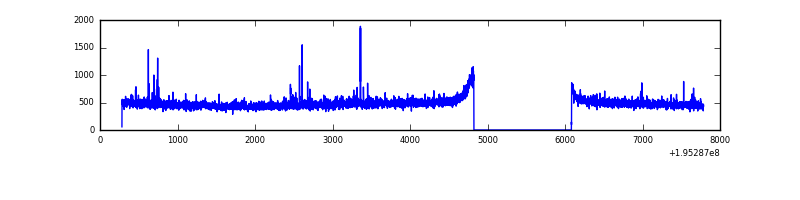 |
| B | 7506 | 6247 | 3 | 3 | 0.04% | 0.05% | 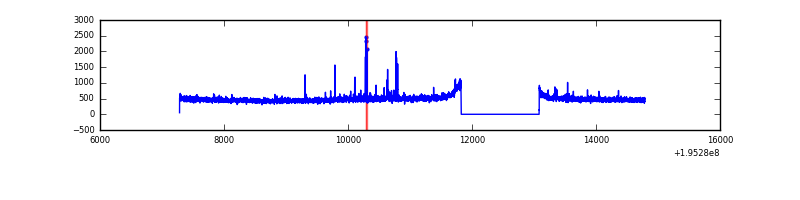 |
| C | 7506 | 6247 | 0 | 0 | 0.00% | 0.00% | 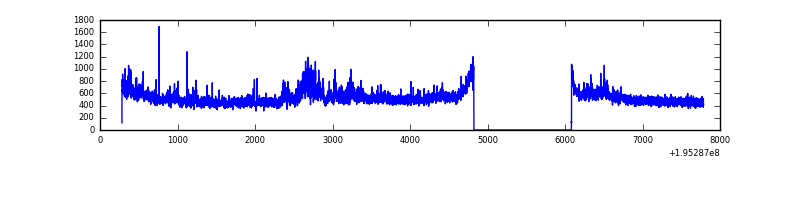 |
| D | 7506 | 6247 | 69 | 69 | 0.92% | 1.10% | 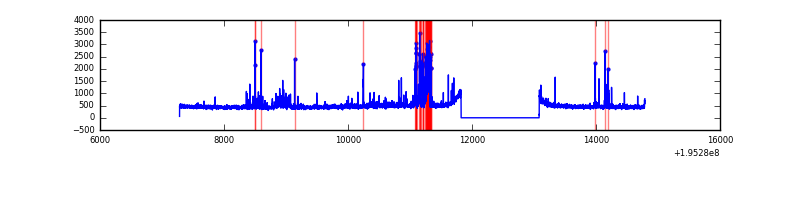 |
Top three noisy pixels from each quadrant. If the there are fewer than three noisy pixels in the level2.evt file, extra rows are filled as -1
| Pixel properties | Quadrant properties | ||||||
|---|---|---|---|---|---|---|---|
| Quadrant | DetID | PixID | Counts | Sigma | Mean | Median | Sigma |
| A | 8 | 14 | 35063 | 222.23 | 765 | 748 | 154.4 |
| A | 15 | 236 | 16193 | 100.02 | 765 | 748 | 154.4 |
| A | 12 | 194 | 8717 | 51.61 | 765 | 748 | 154.4 |
| B | 0 | 228 | 33987 | 227.48 | 770 | 752 | 146.1 |
| B | 15 | 85 | 28134 | 187.42 | 770 | 752 | 146.1 |
| B | 12 | 111 | 9665 | 61.01 | 770 | 752 | 146.1 |
| C | 5 | 234 | 403364 | 2313.44 | 744 | 749 | 174.0 |
| C | 13 | 61 | 6795 | 34.74 | 744 | 749 | 174.0 |
| C | 1 | 3 | 5332 | 26.33 | 744 | 749 | 174.0 |
| D | 13 | 53 | 233614 | 1328.46 | 735 | 719 | 175.3 |
| D | 7 | 67 | 100683 | 570.21 | 735 | 719 | 175.3 |
| D | 9 | 66 | 53057 | 298.54 | 735 | 719 | 175.3 |
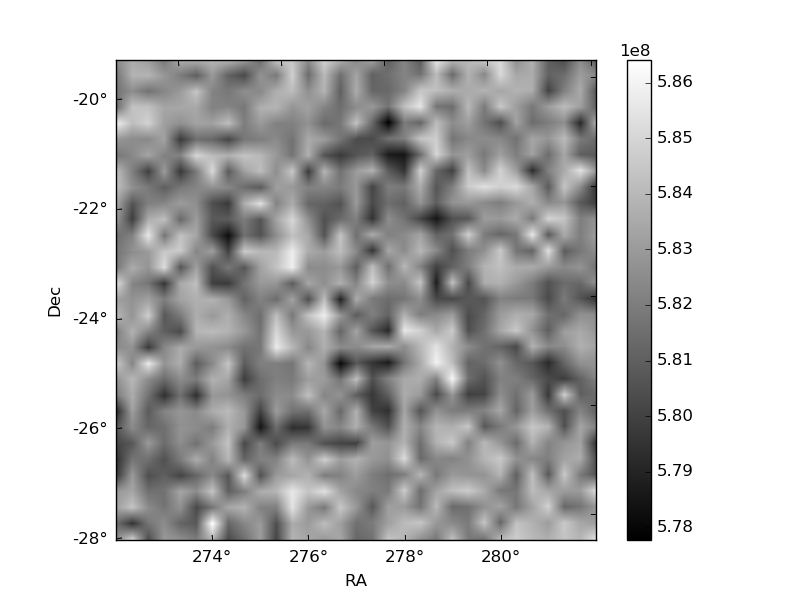
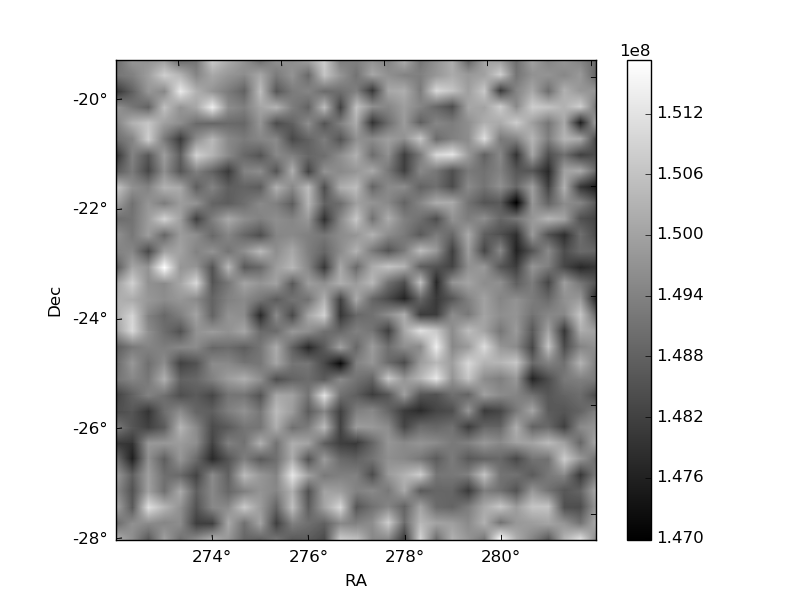
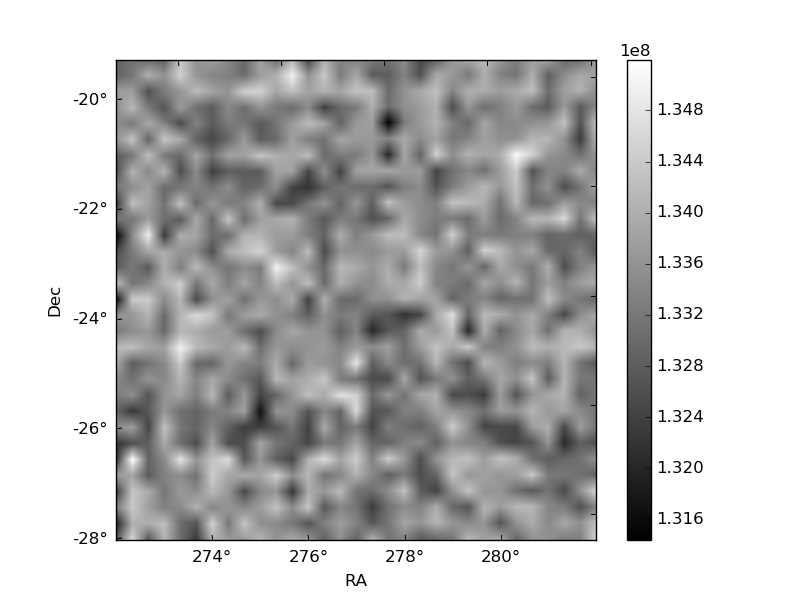
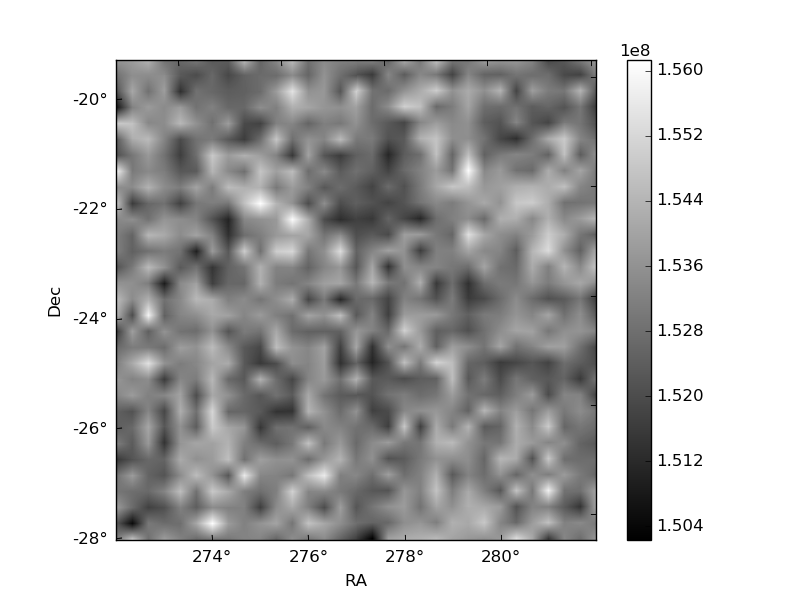
Histogram calculated using DETX and DETY for each event in the final _common_clean file
| Quadrant A | 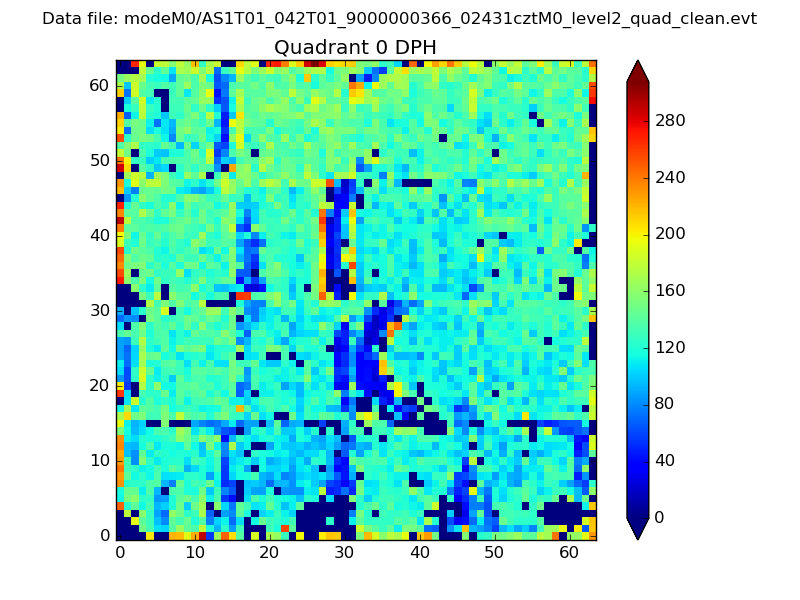 |
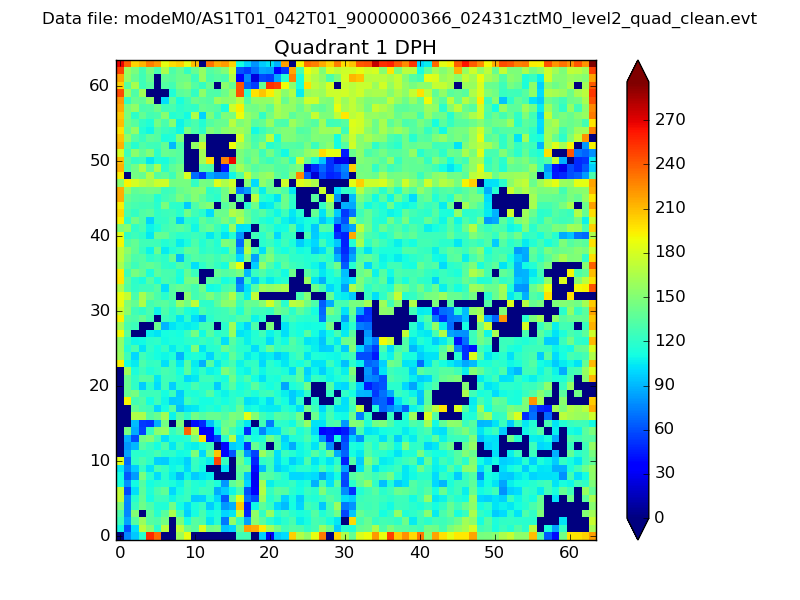 |
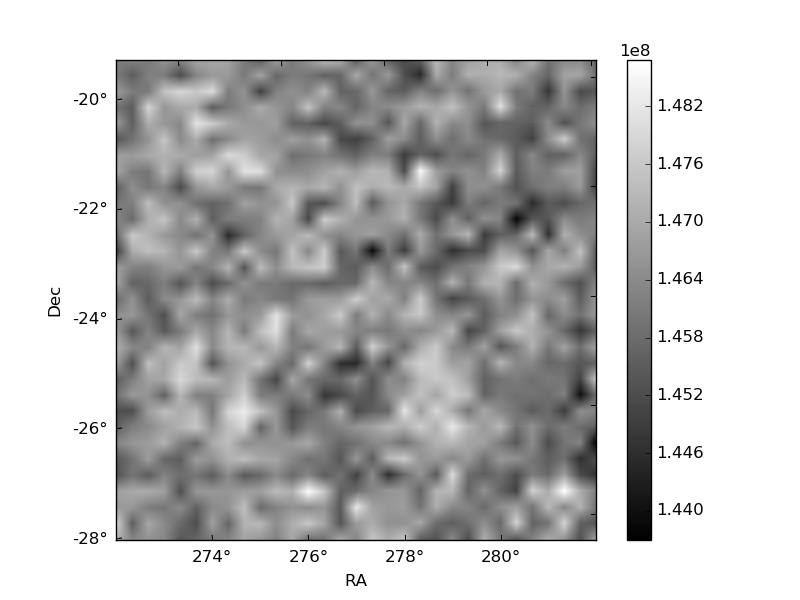
Quadrant B |
|---|---|---|---|
| Quadrant D | 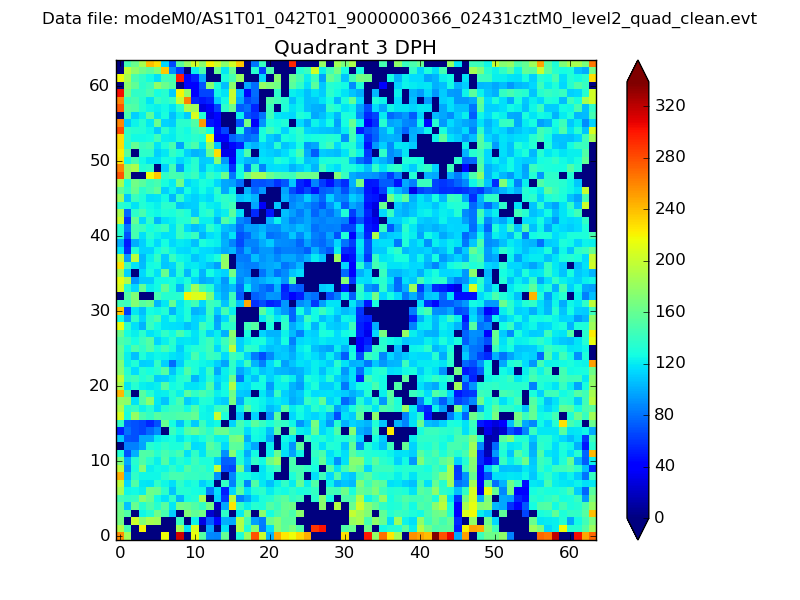 |
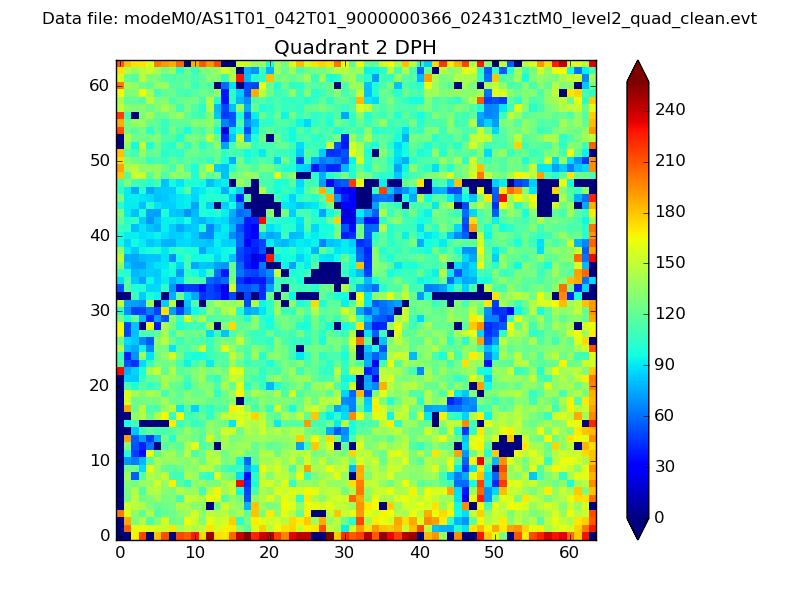 |
Quadrant C |
| Plot type | Count rate plots | Images |
|---|---|---|
| Comparison with Poisson distribution Blue bars denote a histogram of data divided into 1 sec bins. Red curve is a Poisson curve with rate = median count rate of data. |
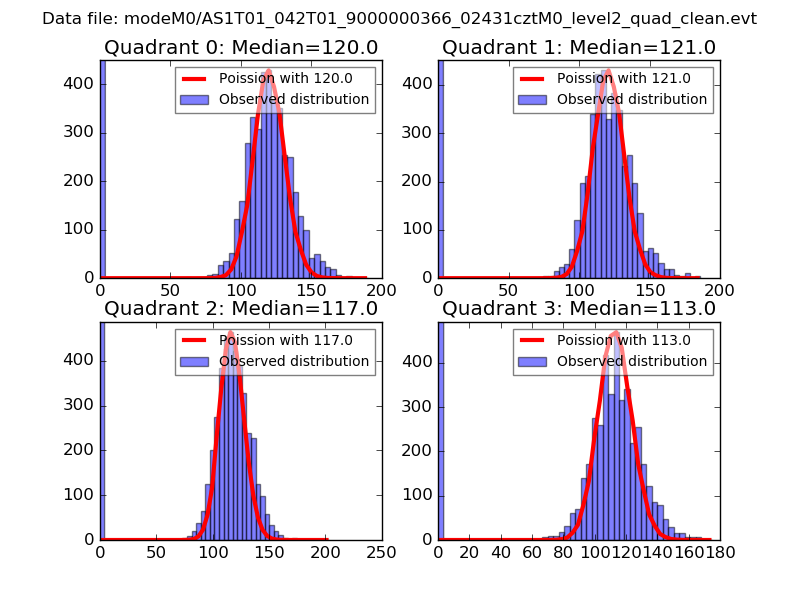 |
 |
| Quadrant-wise count rates Data is divided into 100 sec bins |
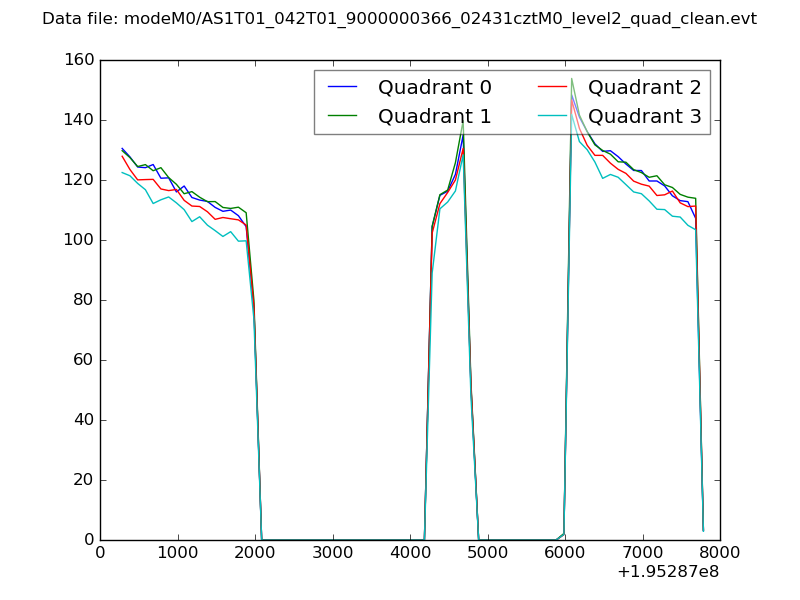 |
|
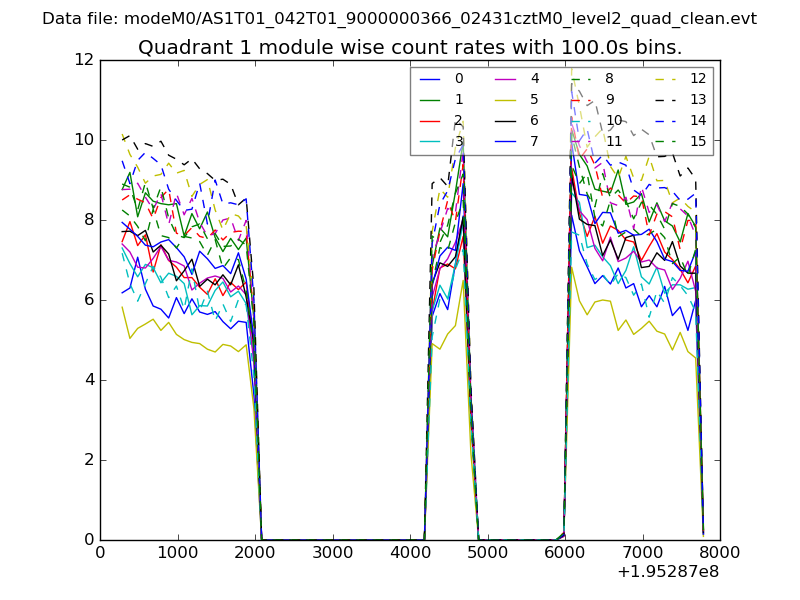
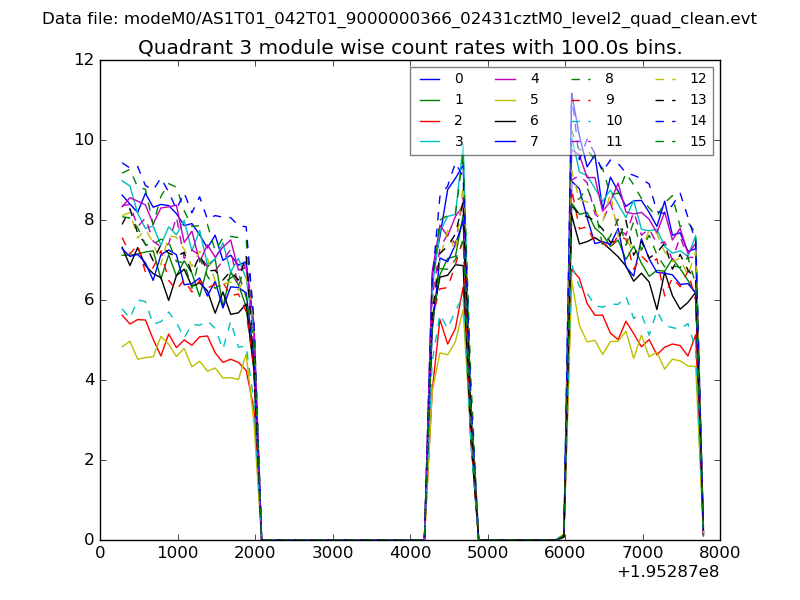
| Module-wise count rates for Quadrant A Data is divided into 100 sec bins |
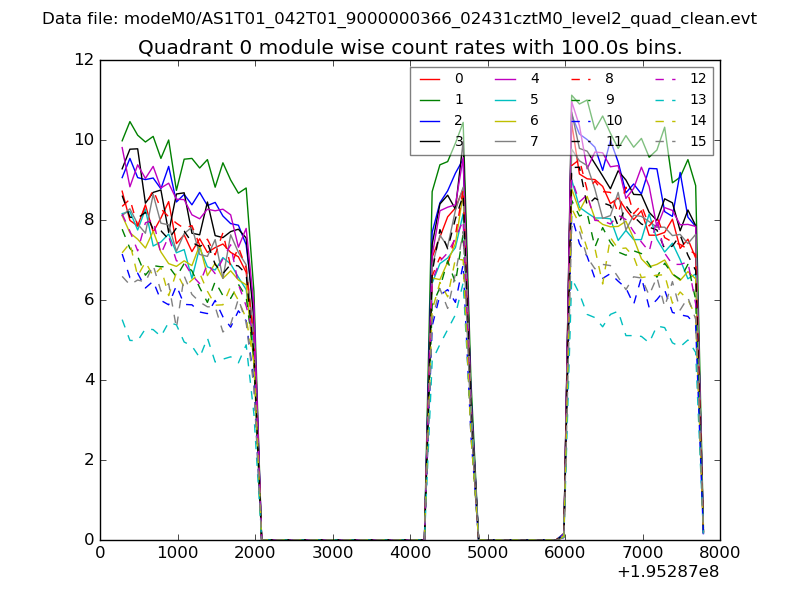 |
 |
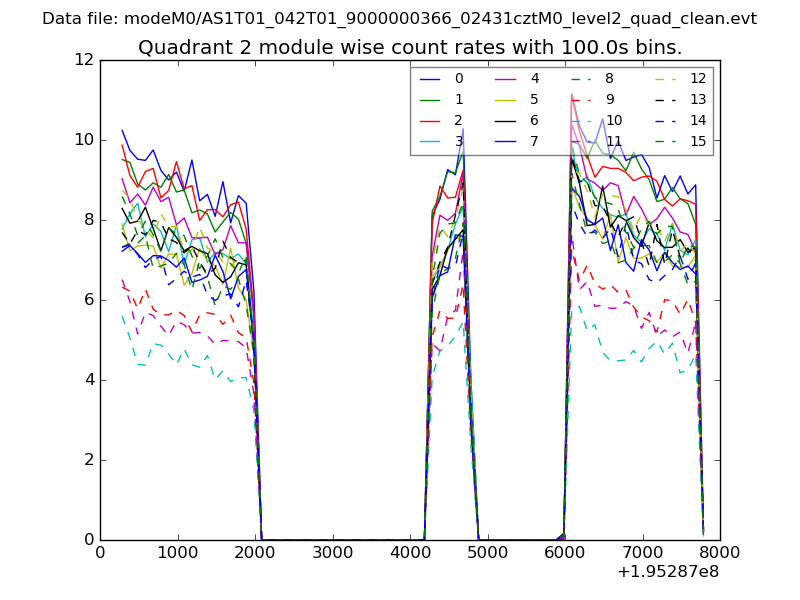
| Module-wise count rates for Quadrant B Data is divided into 100 sec bins |
 |
 |
| Module-wise count rates for Quadrant C Data is divided into 100 sec bins |
 |
 |
| Module-wise count rates for Quadrant D Data is divided into 100 sec bins |
 |
 |
| Parameter | Plot |
|---|---|
| CZT HV Monitor |  |
| D_VDD | 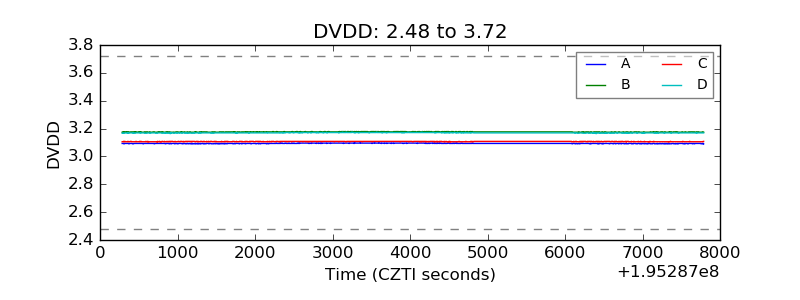 |
| Temperature 1 | 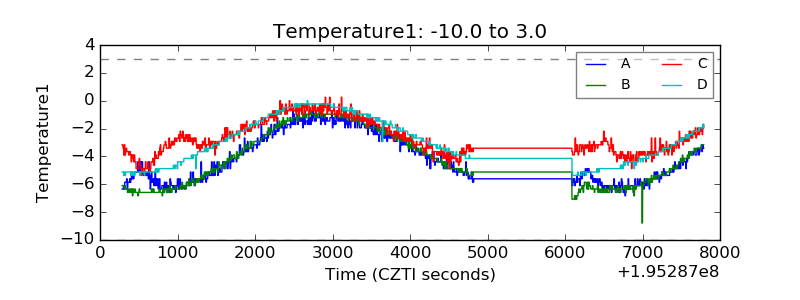 |
| Veto HV Monitor | 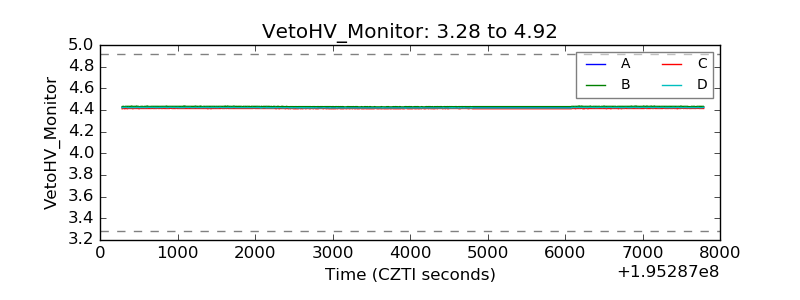 |
| Veto LLD | 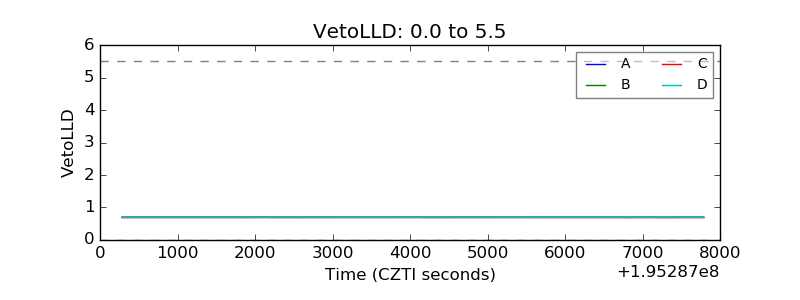 |
| Alpha Counter | 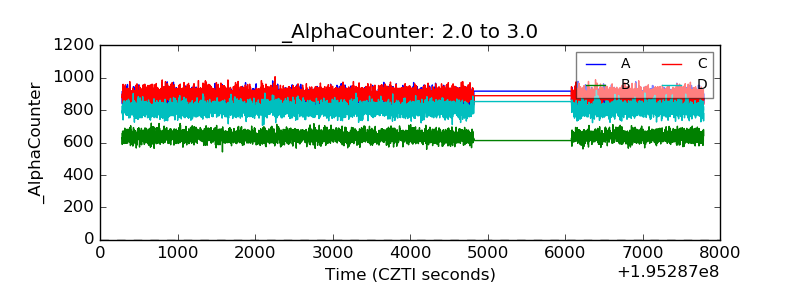 |
| _CPM_Rate | 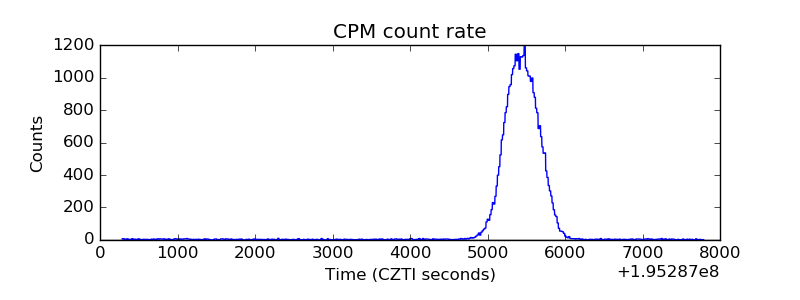 |
| CZT Counter |  |
| +2.5 Volts monitor | 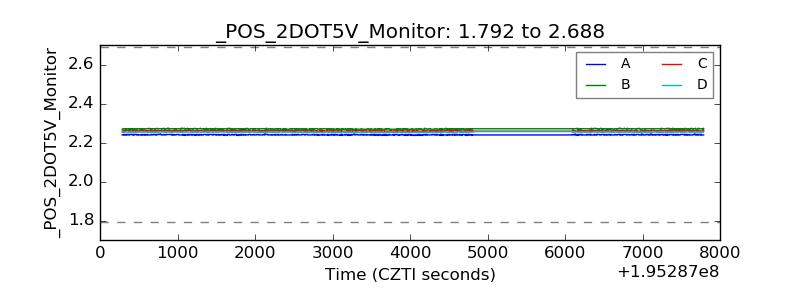 |
| +5 Volts monitor | 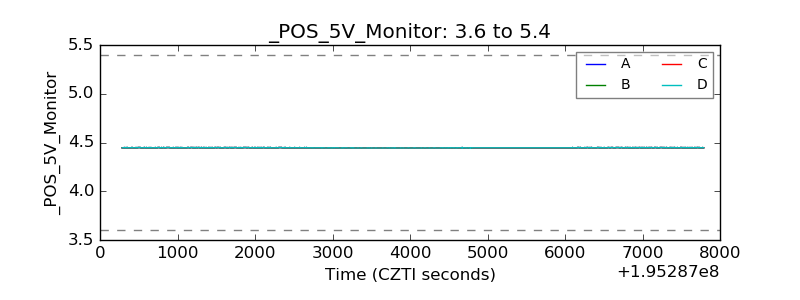 |
| _ROLL_ROT | 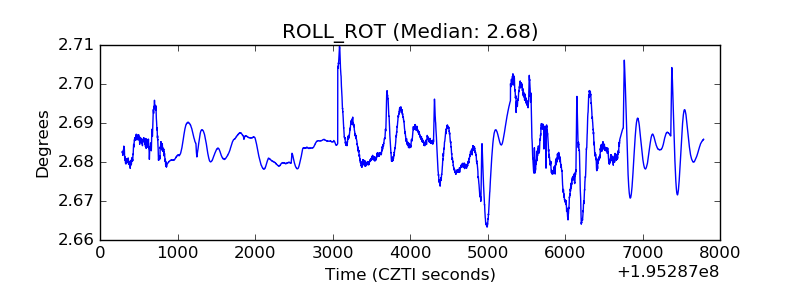 |
| _Roll_DEC | 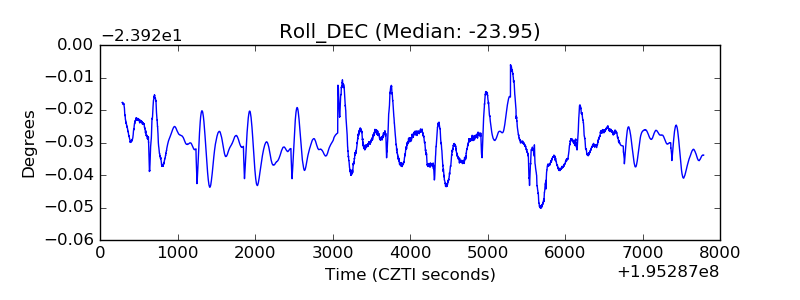 |
| _Roll_RA | 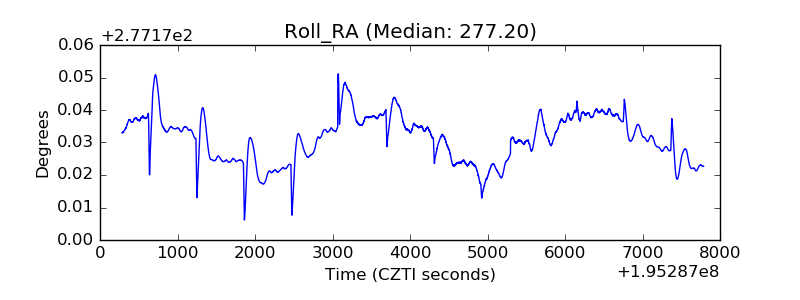 |
| Veto Counter | 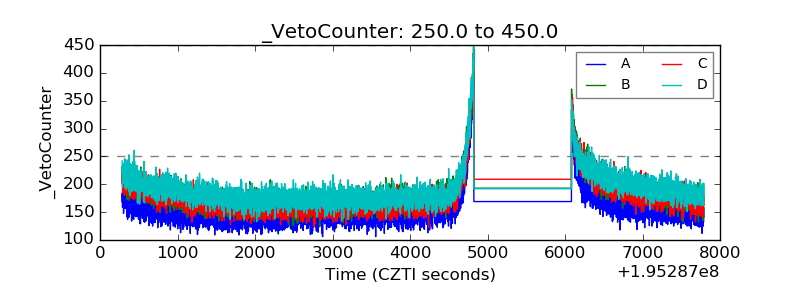 |