| Param | Original file | Final file |
|---|---|---|
| Filename | modeM0/AS1T01_042T01_9000000366_02436cztM0_level2.evt | modeM0/AS1T01_042T01_9000000366_02436cztM0_level2_quad_clean.evt |
| Size (bytes) | 518,351,040 | 78,186,240 |
| Size | 494.3 MB | 74.6 MB |
| Events in quadrant A | 3,876,645 | 462,155 |
| Events in quadrant B | 3,817,538 | 468,267 |
| Events in quadrant C | 3,810,016 | 453,815 |
| Events in quadrant D | 3,663,653 | 440,229 |
| Mode SS | |||
|---|---|---|---|
| Quadrant | BADHDUFLAG | Total packets | Discarded packets |
| A | 0 | 158 | 0 |
| B | 0 | 158 | 0 |
| C | 0 | 158 | 0 |
| D | 0 | 158 | 0 |
| Mode M0 | |||
|---|---|---|---|
| Quadrant | BADHDUFLAG | Total packets | Discarded packets |
| A | 0 | 16883 | 1 |
| B | 0 | 16680 | 0 |
| C | 0 | 16848 | 0 |
| D | 0 | 16676 | 0 |
| Quadrant | Total seconds | Saturated seconds | Saturation percentage |
|---|---|---|---|
| A | 7802 | 205 | 2.627531% |
| B | 7802 | 160 | 2.050756% |
| C | 7802 | 92 | 1.179185% |
| D | 7802 | 89 | 1.140733% |
Noise dominated data is calculated using 1-second bins in cleaned event files. If a bin has >2000 counts, and if more than 50% of those come from <1% of pixels, then it is considered to be noise-dominated and hence unusable.
| Quadrant | # 1 sec bins | Bins with >0 counts | Bins with >2000 counts | High rate bins dominated by noise | Noise dominated (total time) | Noise dominated (detector-on time) | Marked lightcurve |
|---|---|---|---|---|---|---|---|
| A | 7803 | 7803 | 33 | 33 | 0.42% | 0.42% | 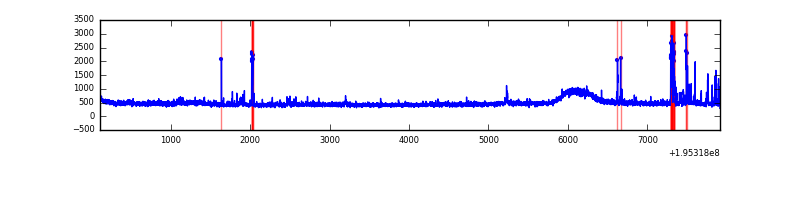 |
| B | 7803 | 7803 | 4 | 4 | 0.05% | 0.05% | 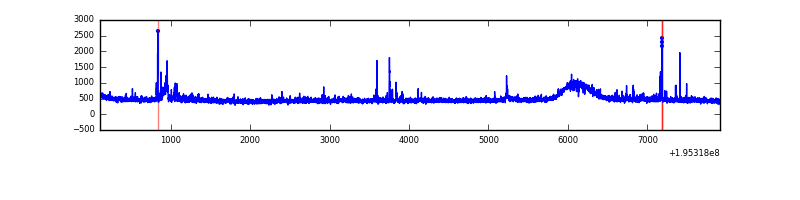 |
| C | 7803 | 7803 | 29 | 29 | 0.37% | 0.37% | 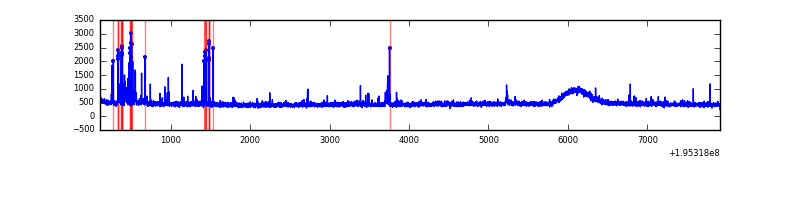 |
| D | 7803 | 7803 | 26 | 26 | 0.33% | 0.33% | 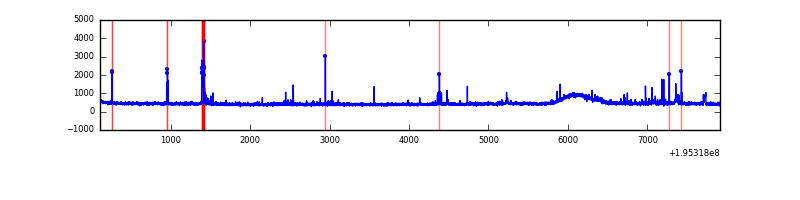 |
Top three noisy pixels from each quadrant. If the there are fewer than three noisy pixels in the level2.evt file, extra rows are filled as -1
| Pixel properties | Quadrant properties | ||||||
|---|---|---|---|---|---|---|---|
| Quadrant | DetID | PixID | Counts | Sigma | Mean | Median | Sigma |
| A | 15 | 236 | 208833 | 1068.31 | 939 | 914 | 194.6 |
| A | 3 | 1 | 25864 | 128.2 | 939 | 914 | 194.6 |
| A | 8 | 15 | 21568 | 106.12 | 939 | 914 | 194.6 |
| B | 4 | 200 | 87896 | 467.01 | 950 | 925 | 186.2 |
| B | 15 | 85 | 49035 | 258.34 | 950 | 925 | 186.2 |
| B | 12 | 111 | 12455 | 61.91 | 950 | 925 | 186.2 |
| C | 2 | 53 | 149303 | 689.78 | 909 | 911 | 215.1 |
| C | 14 | 223 | 64851 | 297.22 | 909 | 911 | 215.1 |
| C | 10 | 65 | 32484 | 146.76 | 909 | 911 | 215.1 |
| D | 13 | 53 | 109911 | 497.54 | 907 | 883 | 219.1 |
| D | 5 | 172 | 27395 | 120.99 | 907 | 883 | 219.1 |
| D | 12 | 109 | 22059 | 96.64 | 907 | 883 | 219.1 |
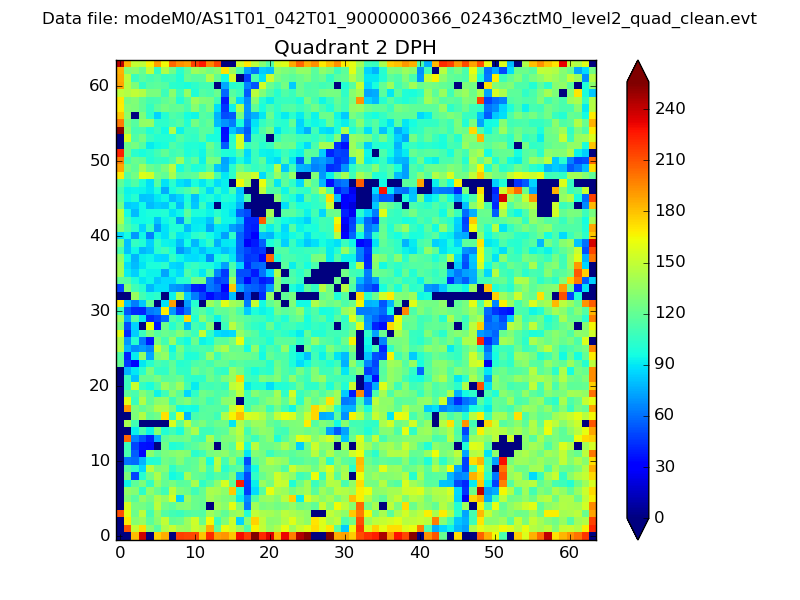
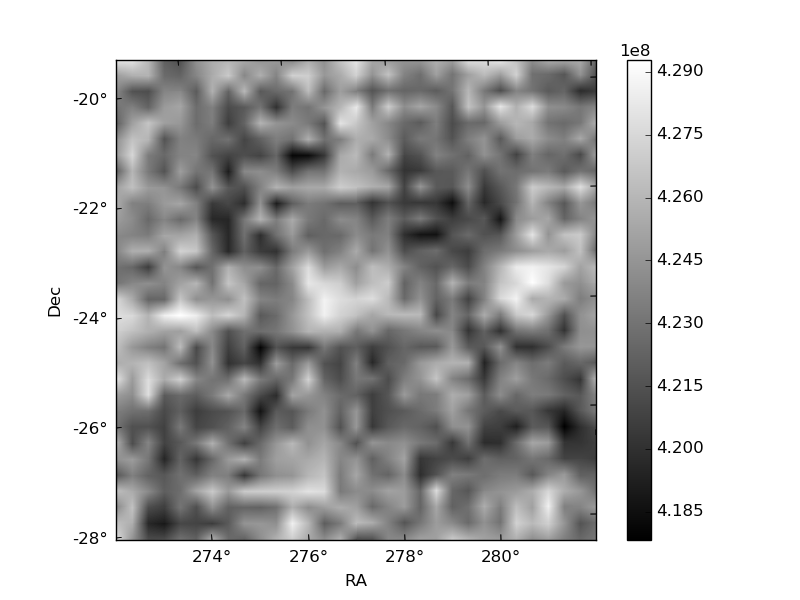
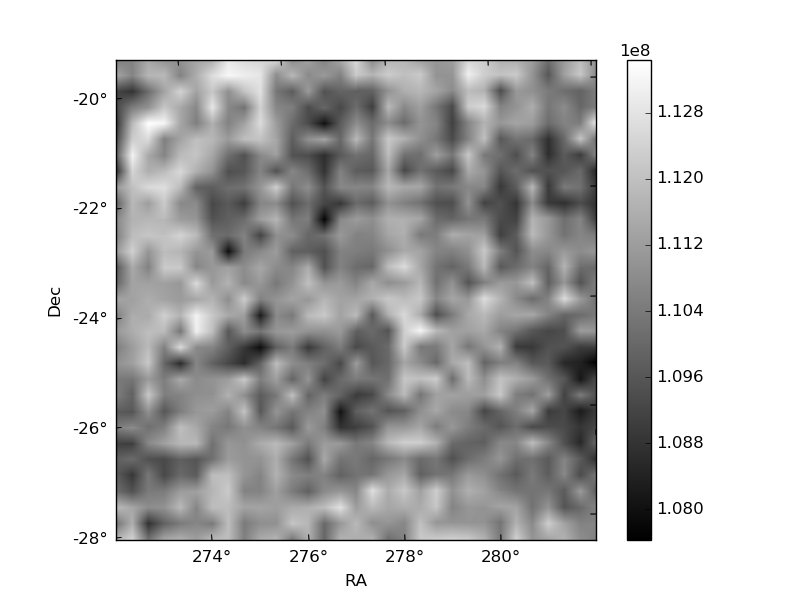
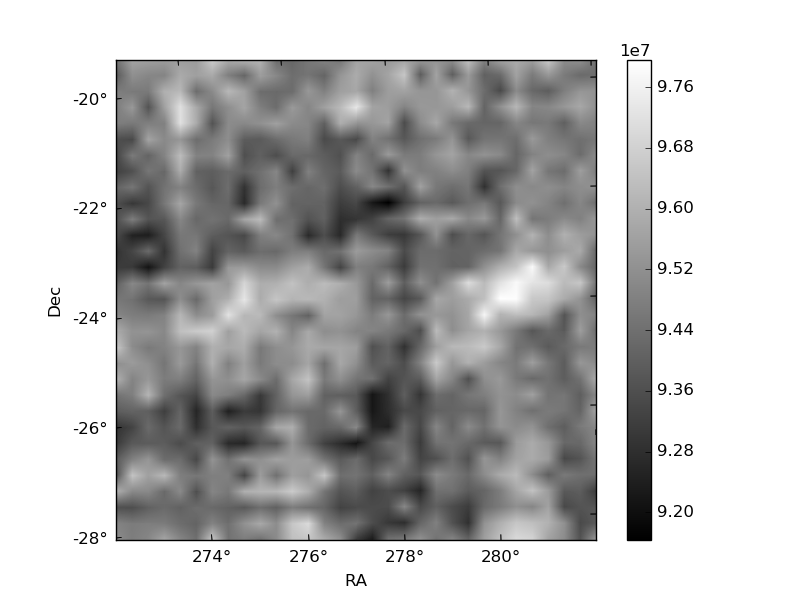
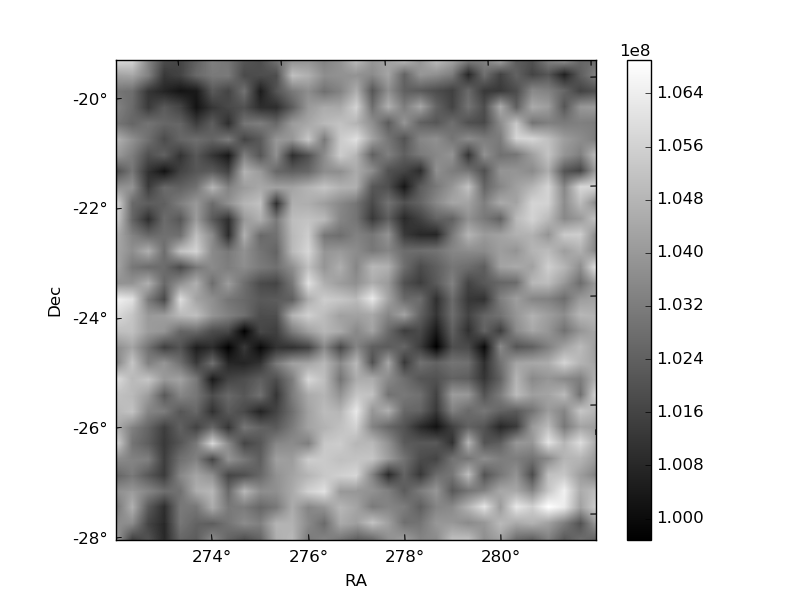
Histogram calculated using DETX and DETY for each event in the final _common_clean file
| Quadrant A | 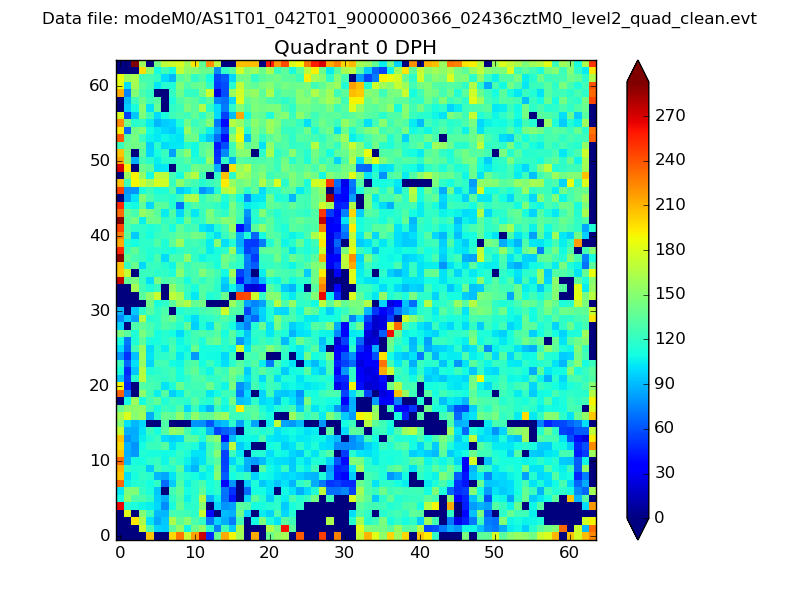 |
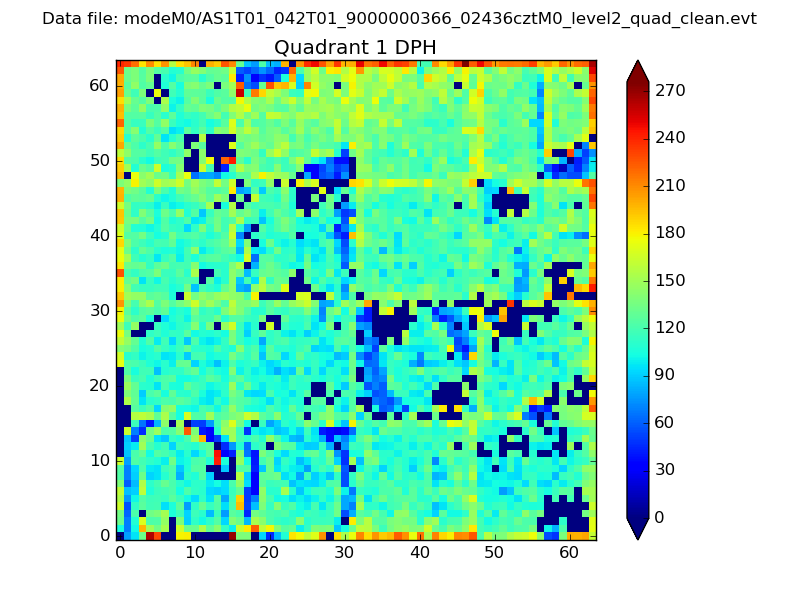 |
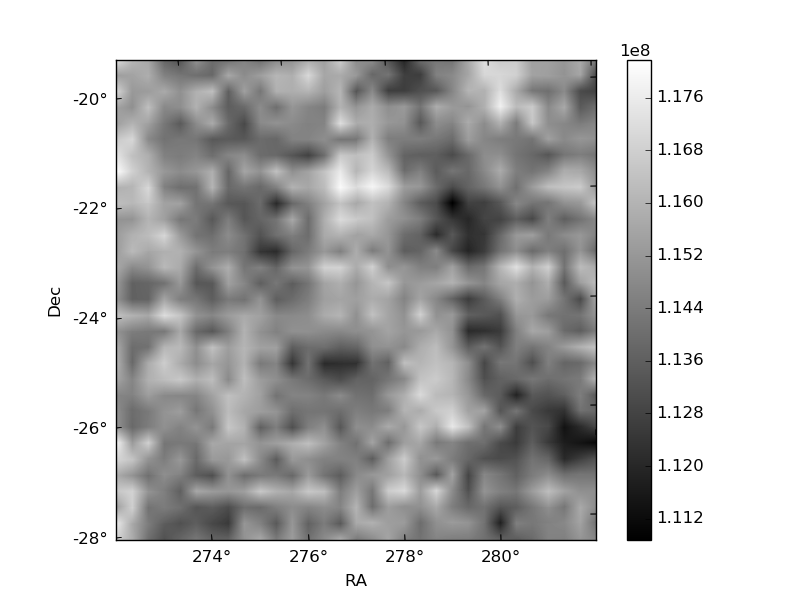
Quadrant B |
|---|---|---|---|
| Quadrant D | 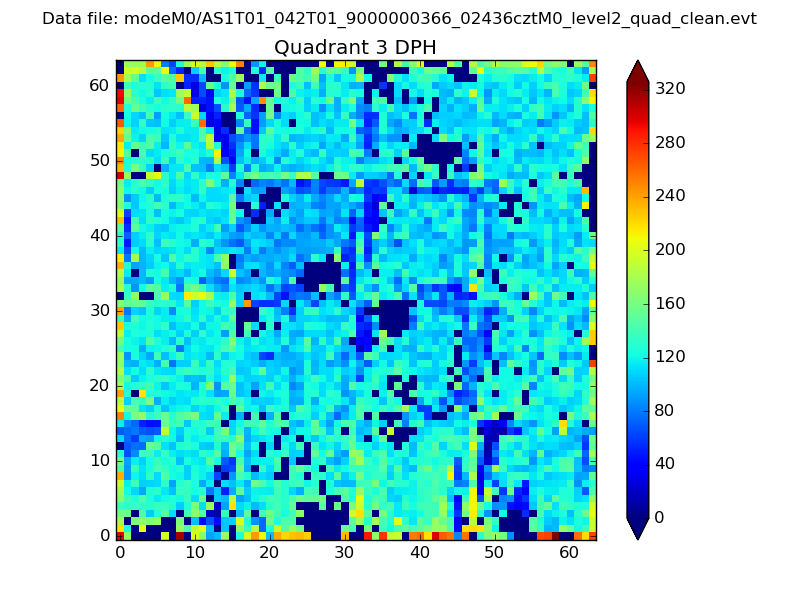 |
 |
Quadrant C |
| Plot type | Count rate plots | Images |
|---|---|---|
| Comparison with Poisson distribution Blue bars denote a histogram of data divided into 1 sec bins. Red curve is a Poisson curve with rate = median count rate of data. |
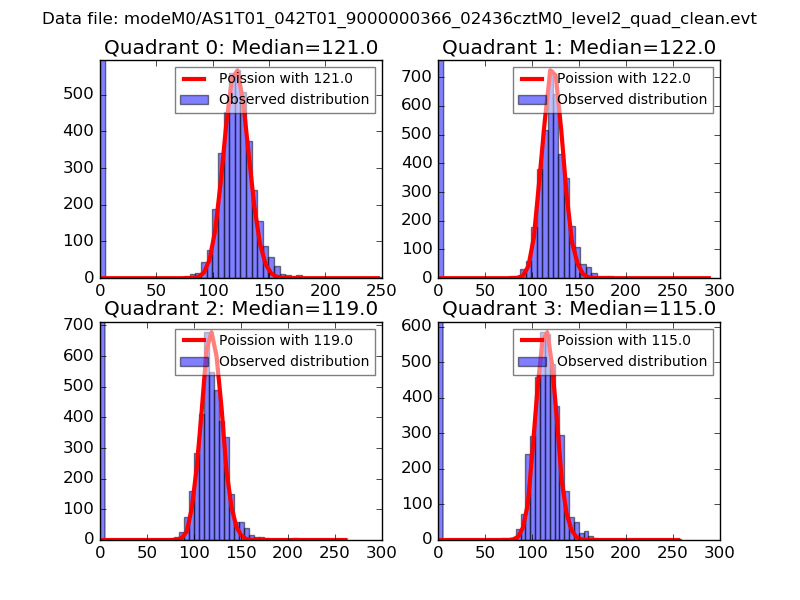 |
 |
| Quadrant-wise count rates Data is divided into 100 sec bins |
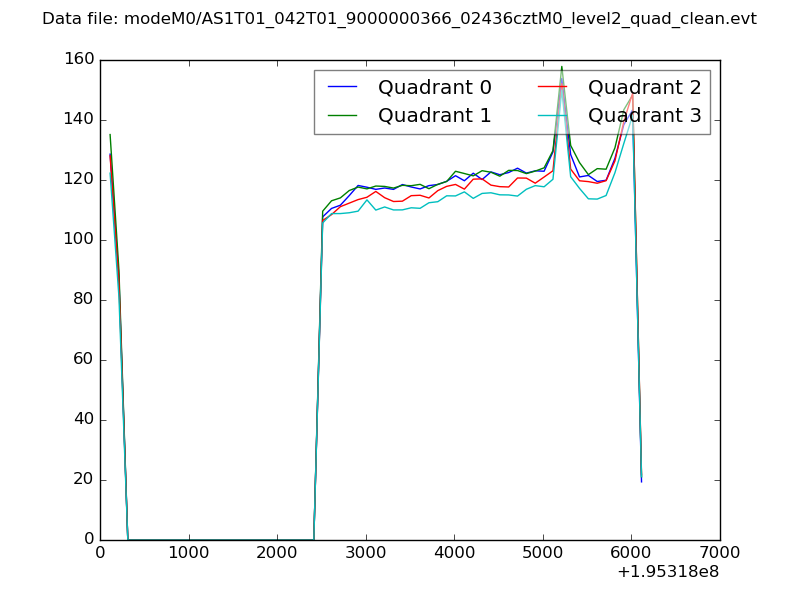 |
|
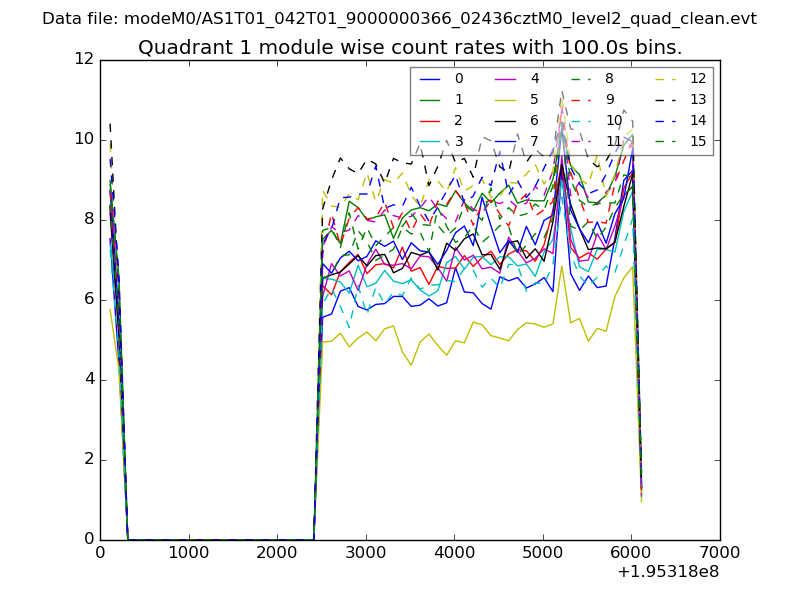
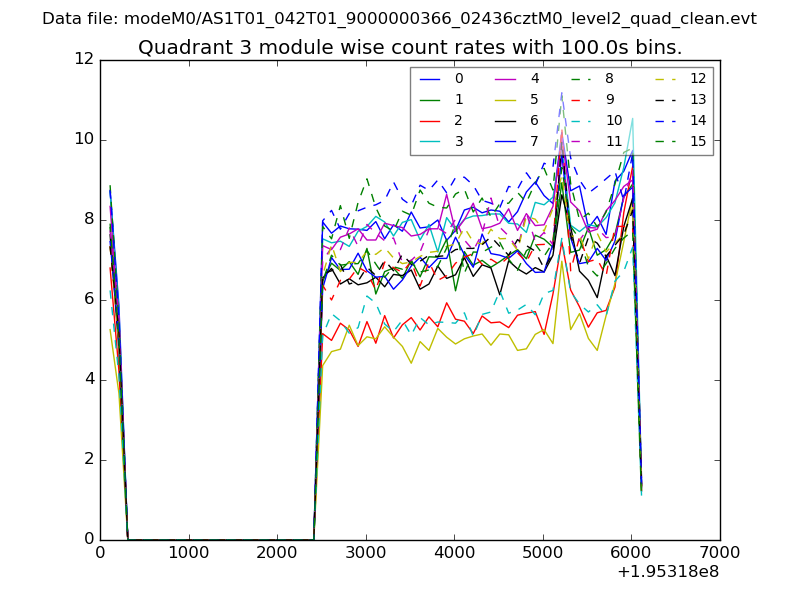
| Module-wise count rates for Quadrant A Data is divided into 100 sec bins |
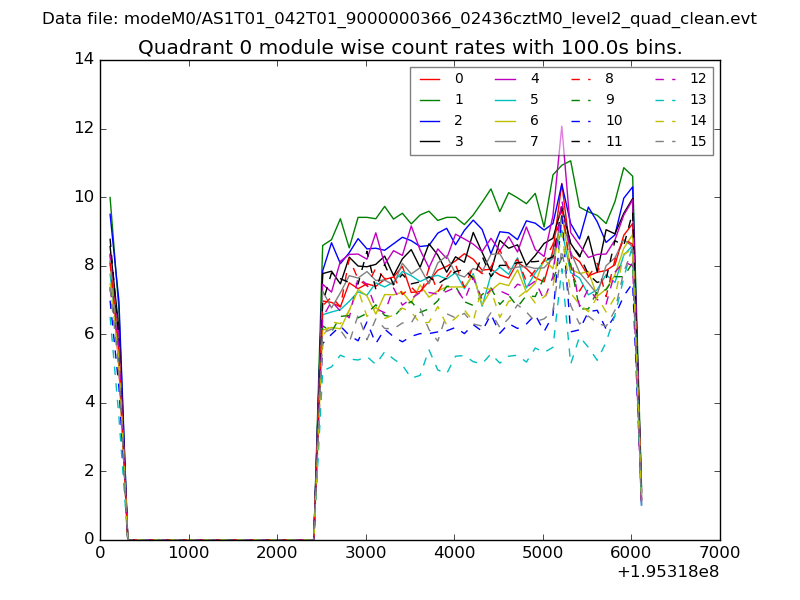 |
 |
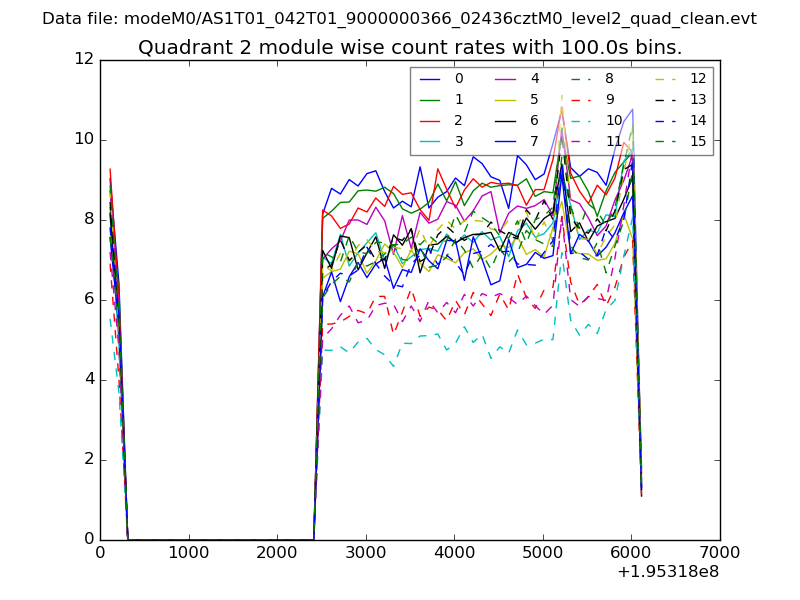
| Module-wise count rates for Quadrant B Data is divided into 100 sec bins |
 |
 |
| Module-wise count rates for Quadrant C Data is divided into 100 sec bins |
 |
 |
| Module-wise count rates for Quadrant D Data is divided into 100 sec bins |
 |
 |
| Parameter | Plot |
|---|---|
| CZT HV Monitor | 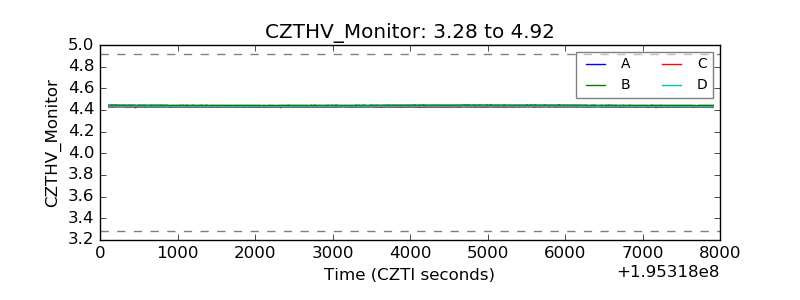 |
| D_VDD | 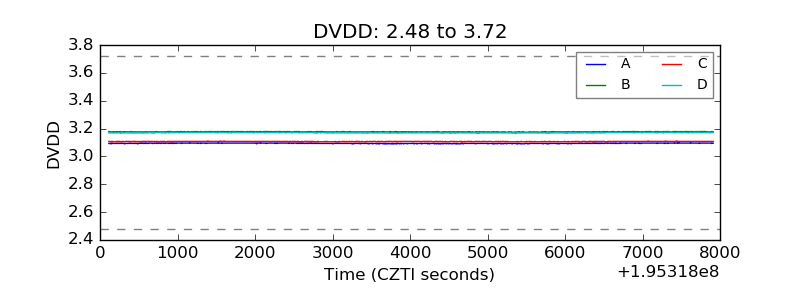 |
| Temperature 1 | 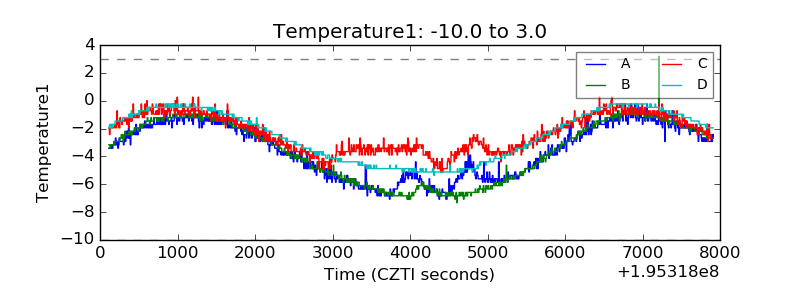 |
| Veto HV Monitor | 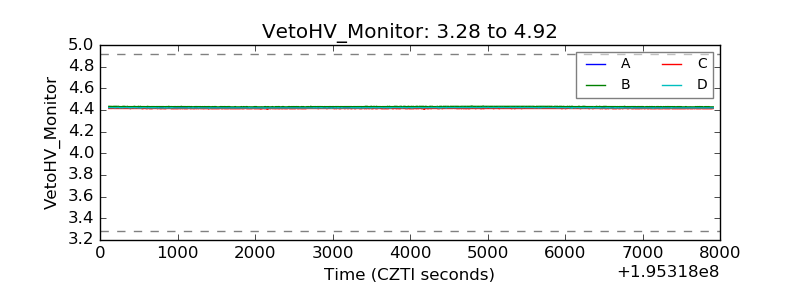 |
| Veto LLD | 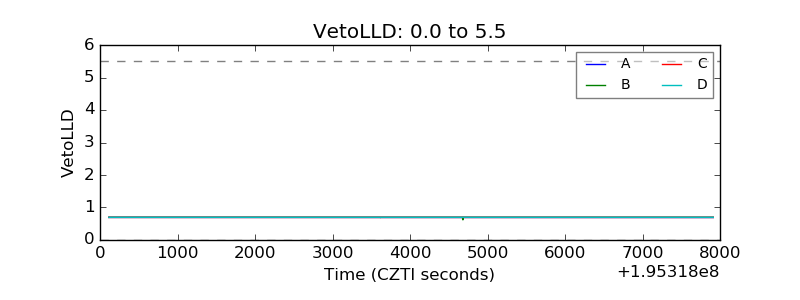 |
| Alpha Counter | 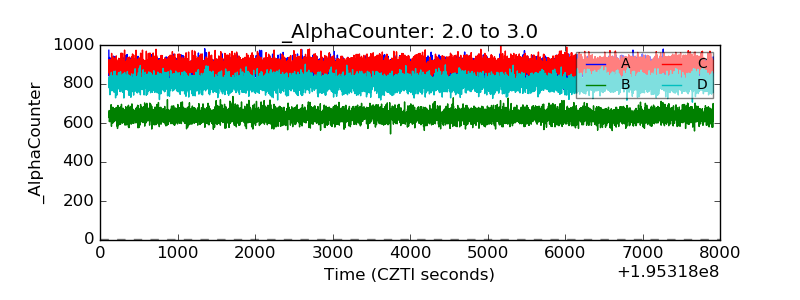 |
| _CPM_Rate | 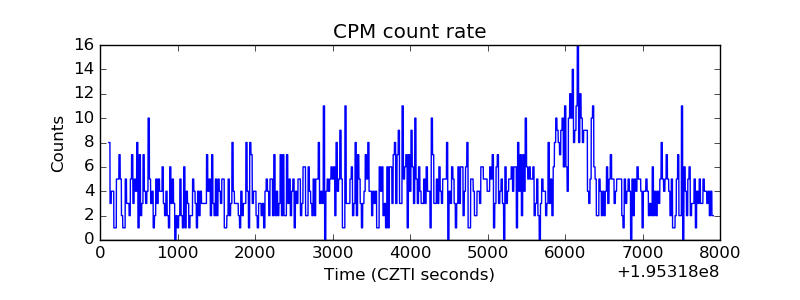 |
| CZT Counter |  |
| +2.5 Volts monitor | 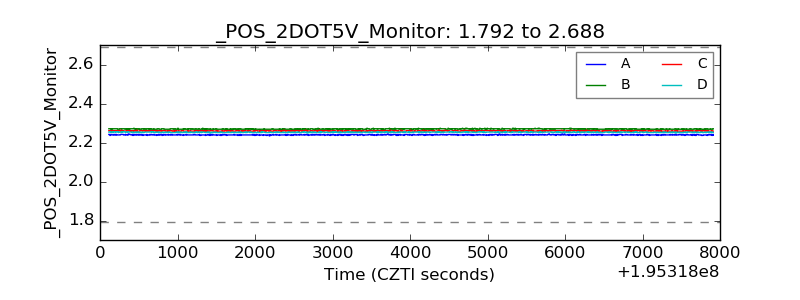 |
| +5 Volts monitor |  |
| _ROLL_ROT |  |
| _Roll_DEC | 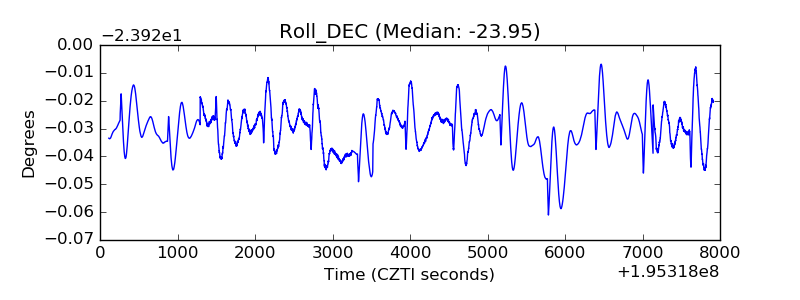 |
| _Roll_RA | 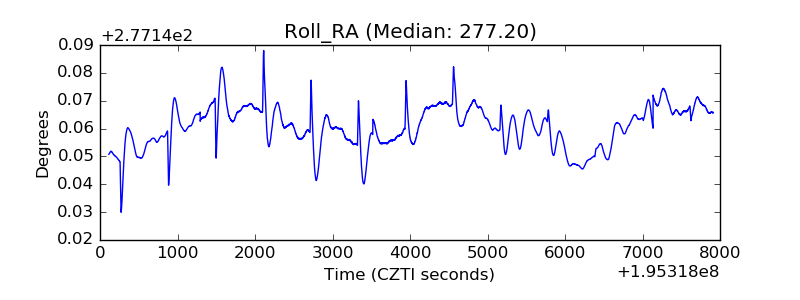 |
| Veto Counter | 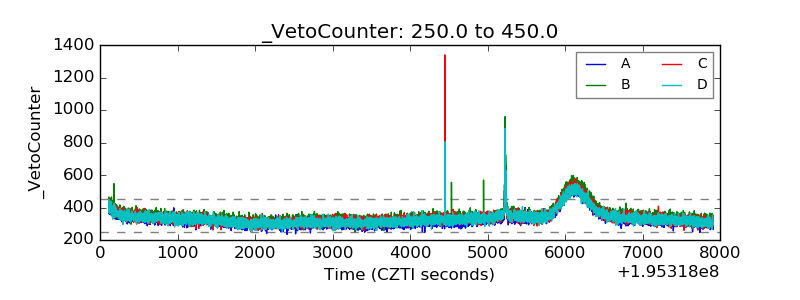 |