| Param | Original file | Final file |
|---|---|---|
| Filename | modeM0/AS1T01_045T01_9000000364cztM0_level2.fits | modeM0/AS1T01_045T01_9000000364cztM0_level2_quad_clean.evt |
| Size (bytes) | 258,912,000 | 258,108,480 |
| Size | 246.9 MB | 246.2 MB |
| Events in quadrant A | 1,551,166 | 1,523,495 |
| Events in quadrant B | 1,510,066 | 1,534,182 |
| Events in quadrant C | 1,507,874 | 1,439,606 |
| Events in quadrant D | 1,296,832 | 1,345,079 |
| Mode M9 | |||
|---|---|---|---|
| Quadrant | BADHDUFLAG | Total packets | Discarded packets |
| A | 0 | 27 | 0 |
| B | 0 | 27 | 0 |
| C | 0 | 27 | 0 |
| D | 0 | 27 | 0 |
| Mode SS | |||
|---|---|---|---|
| Quadrant | BADHDUFLAG | Total packets | Discarded packets |
| A | 0 | 584 | 0 |
| B | 0 | 584 | 0 |
| C | 0 | 584 | 0 |
| D | 0 | 584 | 0 |
| Mode M0 | |||
|---|---|---|---|
| Quadrant | BADHDUFLAG | Total packets | Discarded packets |
| A | 0 | 63898 | 0 |
| B | 0 | 63198 | 0 |
| C | 0 | 80904 | 0 |
| D | 0 | 70518 | 0 |
| Quadrant | Total seconds | Saturated seconds | Saturation percentage |
|---|---|---|---|
| A | 28699 | 870 | 3.031465% |
| B | 28699 | 836 | 2.912993% |
| C | 28699 | 1068 | 3.721384% |
| D | 28699 | 1368 | 4.766717% |
Noise dominated data is calculated using 1-second bins in cleaned event files. If a bin has >2000 counts, and if more than 50% of those come from <1% of pixels, then it is considered to be noise-dominated and hence unusable.
| Quadrant | # 1 sec bins | Bins with >0 counts | Bins with >2000 counts | High rate bins dominated by noise | Noise dominated (total time) | Noise dominated (detector-on time) | Marked lightcurve |
|---|---|---|---|---|---|---|---|
| A | 31584 | 28700 | 0 | 0 | 0.00% | 0.00% | 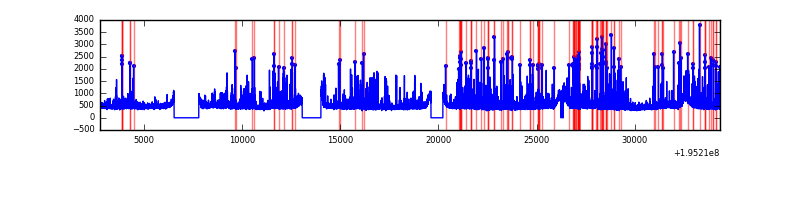 |
| B | 31583 | 28697 | 0 | 0 | 0.00% | 0.00% |  |
| C | 31584 | 28698 | 0 | 0 | 0.00% | 0.00% |  |
| D | 31584 | 28654 | 0 | 0 | 0.00% | 0.00% | 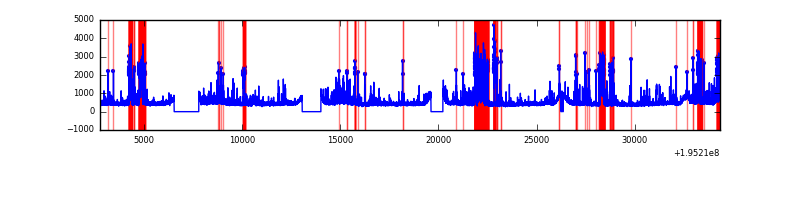 |
Top three noisy pixels from each quadrant. If the there are fewer than three noisy pixels in the level2.evt file, extra rows are filled as -1
| Pixel properties | Quadrant properties | ||||||
|---|---|---|---|---|---|---|---|
| Quadrant | DetID | PixID | Counts | Sigma | Mean | Median | Sigma |
| A | 14 | 188 | 1476 | 10.28 | 403 | 375 | 107.1 |
| A | 7 | 110 | 1436 | 9.91 | 403 | 375 | 107.1 |
| A | 0 | 29 | 1376 | 9.35 | 403 | 375 | 107.1 |
| B | 2 | 9 | 1283 | 11.26 | 397 | 376 | 80.6 |
| B | 12 | 226 | 1140 | 9.48 | 397 | 376 | 80.6 |
| B | 14 | 254 | 1105 | 9.05 | 397 | 376 | 80.6 |
| C | 7 | 111 | 1103 | 6.81 | 398 | 365 | 108.4 |
| C | 2 | 127 | 1102 | 6.8 | 398 | 365 | 108.4 |
| C | 3 | 158 | 1026 | 6.1 | 398 | 365 | 108.4 |
| D | 6 | 231 | 983 | 6.27 | 369 | 334 | 103.4 |
| D | 4 | 160 | 979 | 6.23 | 369 | 334 | 103.4 |
| D | 1 | 19 | 977 | 6.21 | 369 | 334 | 103.4 |
Histogram calculated using DETX and DETY for each event in the final _common_clean file
| Quadrant A | 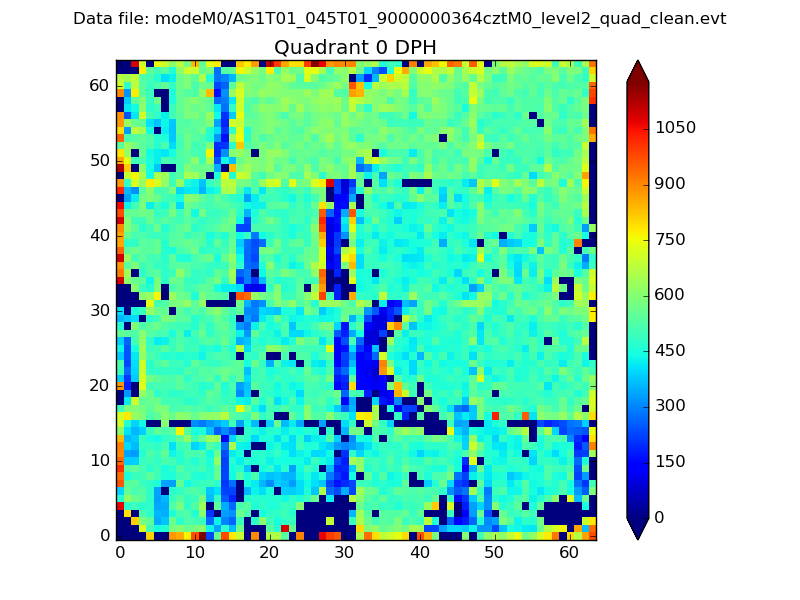 |
 |
Quadrant B |
|---|---|---|---|
| Quadrant D |  |
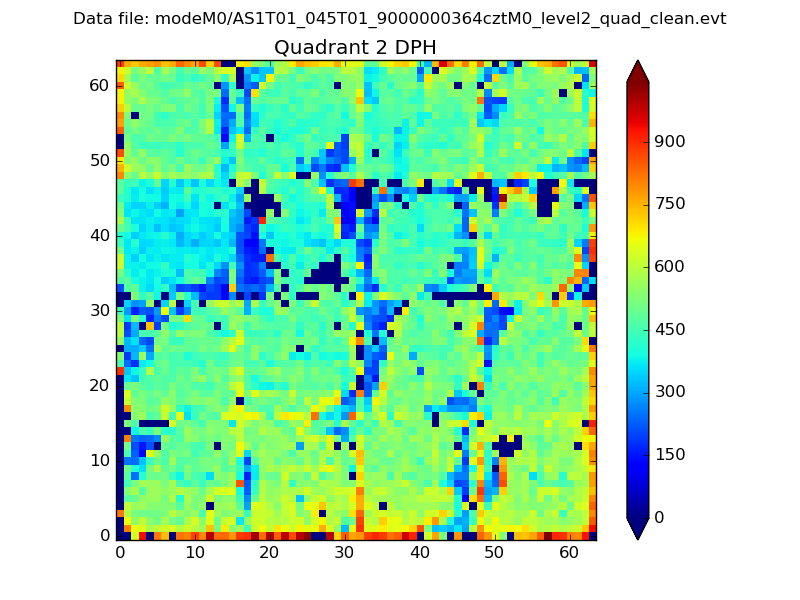 |
Quadrant C |
| Plot type | Count rate plots | Images |
|---|---|---|
| Comparison with Poisson distribution Blue bars denote a histogram of data divided into 1 sec bins. Red curve is a Poisson curve with rate = median count rate of data. |
 |
 |
| Quadrant-wise count rates Data is divided into 100 sec bins |
 |
|
| Module-wise count rates for Quadrant A Data is divided into 100 sec bins |
 |
 |
| Module-wise count rates for Quadrant B Data is divided into 100 sec bins |
 |
 |
| Module-wise count rates for Quadrant C Data is divided into 100 sec bins |
 |
 |
| Module-wise count rates for Quadrant D Data is divided into 100 sec bins |
 |
 |
| Parameter | Plot |
|---|---|
| CZT HV Monitor |  |
| D_VDD | 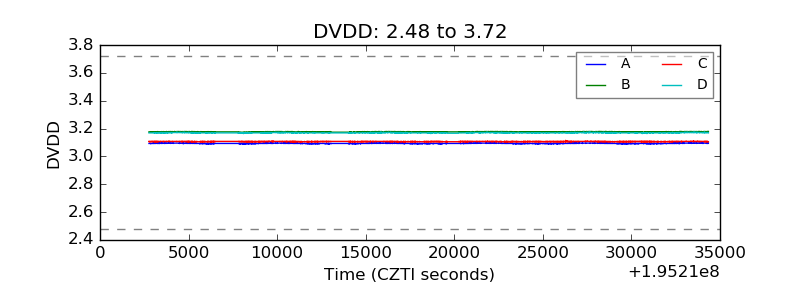 |
| Temperature 1 |  |
| Veto HV Monitor |  |
| Veto LLD |  |
| Alpha Counter | 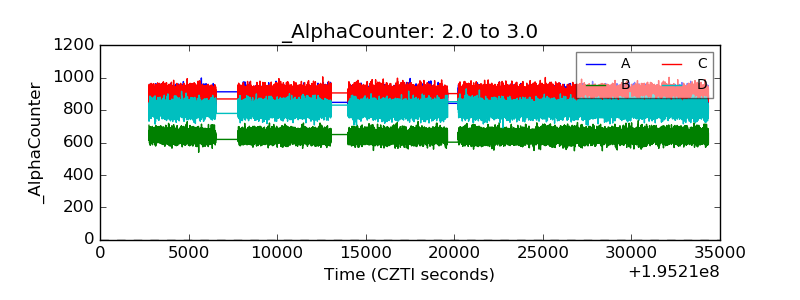 |
| _CPM_Rate |  |
| CZT Counter |  |
| +2.5 Volts monitor |  |
| +5 Volts monitor |  |
| _ROLL_ROT | 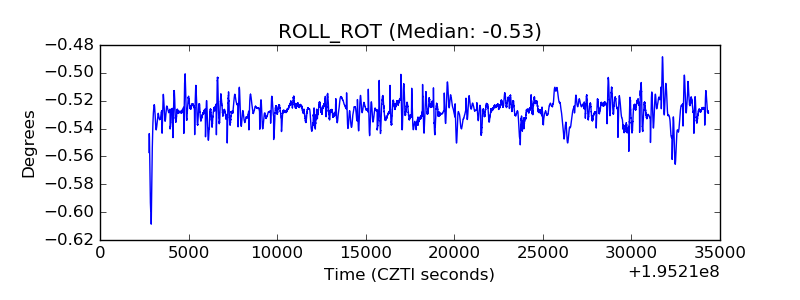 |
| _Roll_DEC | 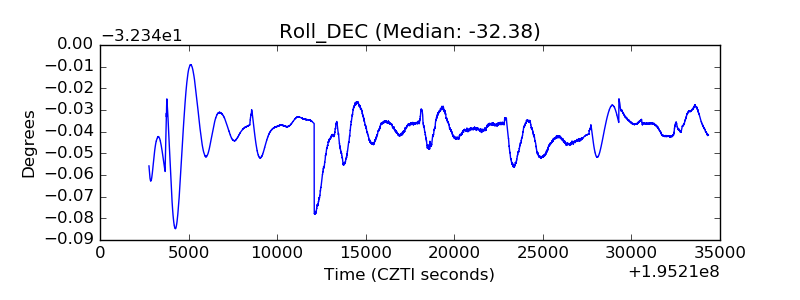 |
| _Roll_RA |  |
| Veto Counter |  |