| Param | Original file | Final file |
|---|---|---|
| Filename | modeM0/AS1G02_018T06_9000000370cztM0_level2.fits | modeM0/AS1G02_018T06_9000000370cztM0_level2_quad_clean.evt |
| Size (bytes) | 1,372,080,960 | 1,407,758,400 |
| Size | 1.3 GB | 1.3 GB |
| Events in quadrant A | 8,151,550 | 8,269,871 |
| Events in quadrant B | 8,019,832 | 8,462,735 |
| Events in quadrant C | 8,019,586 | 8,011,920 |
| Events in quadrant D | 6,938,954 | 7,470,736 |
| Mode M9 | |||
|---|---|---|---|
| Quadrant | BADHDUFLAG | Total packets | Discarded packets |
| A | 0 | 219 | 0 |
| B | 0 | 219 | 0 |
| C | 0 | 219 | 0 |
| D | 0 | 219 | 0 |
| Mode SS | |||
|---|---|---|---|
| Quadrant | BADHDUFLAG | Total packets | Discarded packets |
| A | 0 | 3106 | 0 |
| B | 0 | 3106 | 0 |
| C | 0 | 3106 | 0 |
| D | 0 | 3106 | 0 |
| Mode M0 | |||
|---|---|---|---|
| Quadrant | BADHDUFLAG | Total packets | Discarded packets |
| A | 0 | 314910 | 0 |
| B | 0 | 316134 | 0 |
| C | 0 | 335029 | 0 |
| D | 0 | 327354 | 0 |
| Quadrant | Total seconds | Saturated seconds | Saturation percentage |
|---|---|---|---|
| A | 152084 | 1988 | 1.307172% |
| B | 152084 | 1953 | 1.284159% |
| C | 152084 | 3895 | 2.561085% |
| D | 152084 | 2075 | 1.364378% |
Noise dominated data is calculated using 1-second bins in cleaned event files. If a bin has >2000 counts, and if more than 50% of those come from <1% of pixels, then it is considered to be noise-dominated and hence unusable.
| Quadrant | # 1 sec bins | Bins with >0 counts | Bins with >2000 counts | High rate bins dominated by noise | Noise dominated (total time) | Noise dominated (detector-on time) | Marked lightcurve |
|---|---|---|---|---|---|---|---|
| A | 177546 | 152080 | 0 | 0 | 0.00% | 0.00% |  |
| B | 177546 | 152087 | 0 | 0 | 0.00% | 0.00% |  |
| C | 177546 | 152059 | 0 | 0 | 0.00% | 0.00% |  |
| D | 177546 | 152083 | 0 | 0 | 0.00% | 0.00% | 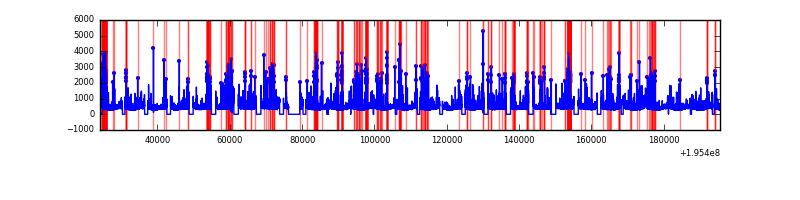 |
Top three noisy pixels from each quadrant. If the there are fewer than three noisy pixels in the level2.evt file, extra rows are filled as -1
| Pixel properties | Quadrant properties | ||||||
|---|---|---|---|---|---|---|---|
| Quadrant | DetID | PixID | Counts | Sigma | Mean | Median | Sigma |
| A | 0 | 29 | 7663 | 10.46 | 2120 | 1969 | 544.5 |
| A | 7 | 110 | 7100 | 9.42 | 2120 | 1969 | 544.5 |
| A | 9 | 19 | 5942 | 7.3 | 2120 | 1969 | 544.5 |
| B | 2 | 9 | 7031 | 12.31 | 2109 | 2001 | 408.6 |
| B | 12 | 226 | 6113 | 10.06 | 2109 | 2001 | 408.6 |
| B | 14 | 254 | 5595 | 8.79 | 2109 | 2001 | 408.6 |
| C | 9 | 188 | 5433 | 6.12 | 2123 | 1945 | 569.7 |
| C | 2 | 191 | 5372 | 6.02 | 2123 | 1945 | 569.7 |
| C | 9 | 242 | 5272 | 5.84 | 2123 | 1945 | 569.7 |
| D | 7 | 5 | 5234 | 6.21 | 1984 | 1791 | 554.7 |
| D | 6 | 231 | 5085 | 5.94 | 1984 | 1791 | 554.7 |
| D | 4 | 160 | 5058 | 5.89 | 1984 | 1791 | 554.7 |
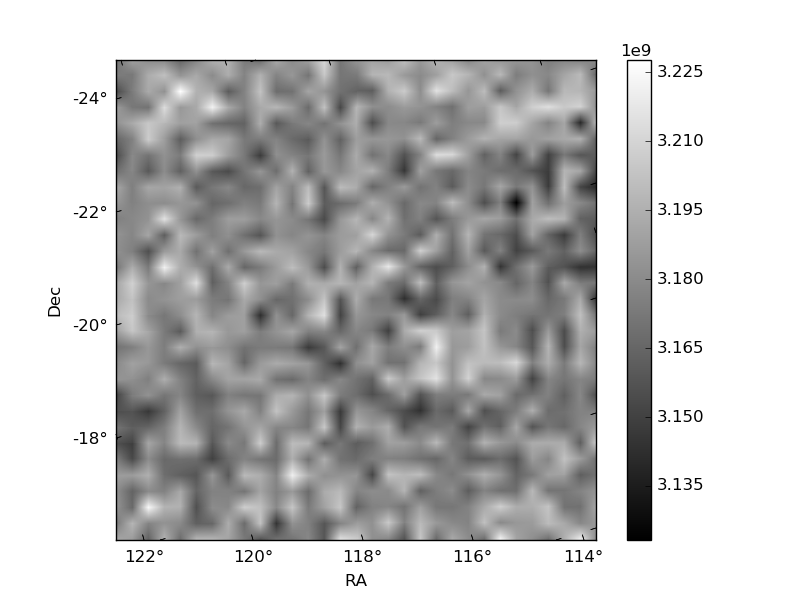
Histogram calculated using DETX and DETY for each event in the final _common_clean file
| Quadrant A | 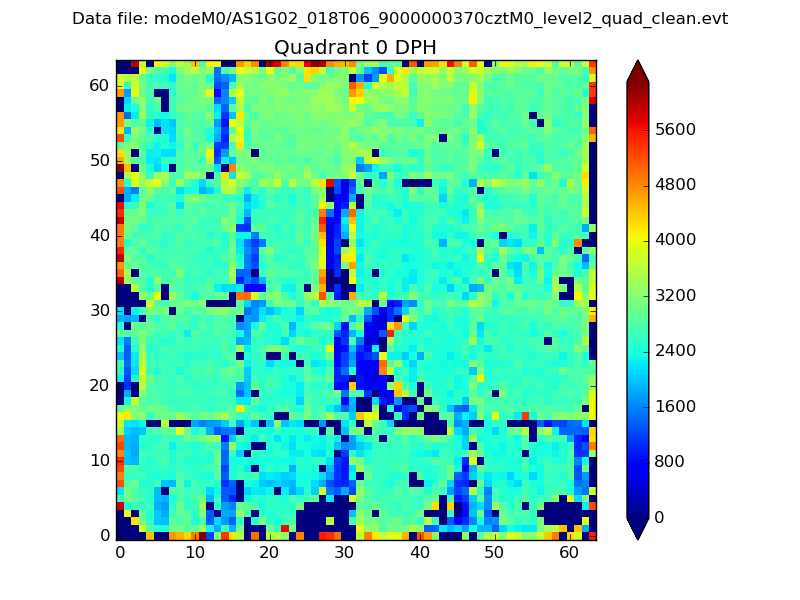 |
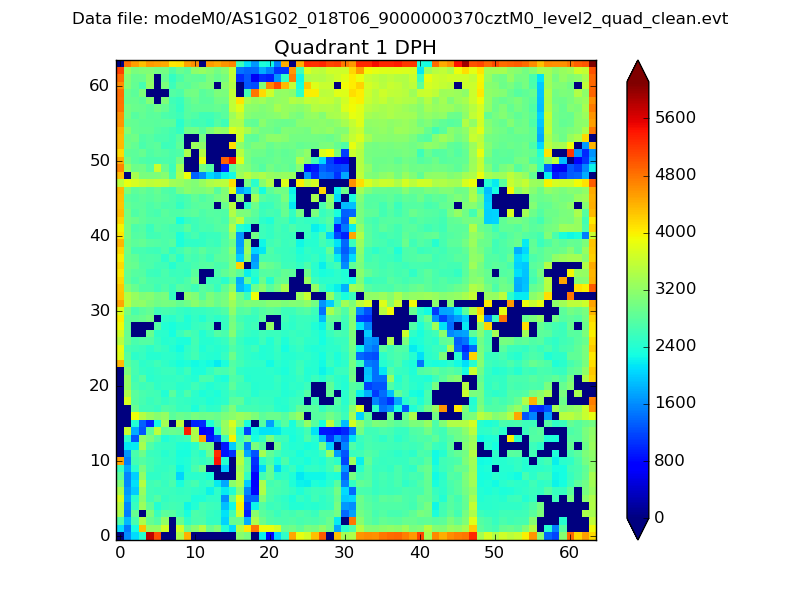 |
Quadrant B |
|---|---|---|---|
| Quadrant D |  |
 |
Quadrant C |
| Plot type | Count rate plots | Images |
|---|---|---|
| Comparison with Poisson distribution Blue bars denote a histogram of data divided into 1 sec bins. Red curve is a Poisson curve with rate = median count rate of data. |
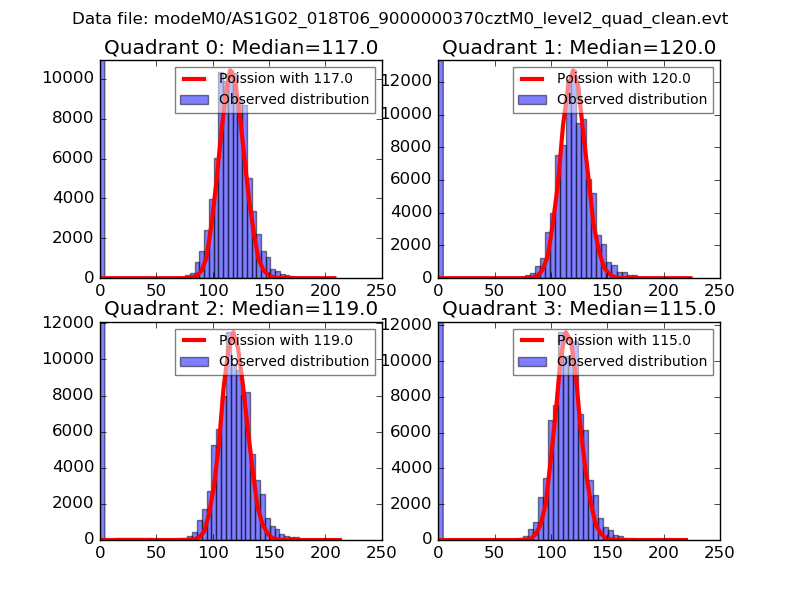 |
 |
| Quadrant-wise count rates Data is divided into 100 sec bins |
 |
|
| Module-wise count rates for Quadrant A Data is divided into 100 sec bins |
 |
 |
| Module-wise count rates for Quadrant B Data is divided into 100 sec bins |
 |
 |
| Module-wise count rates for Quadrant C Data is divided into 100 sec bins |
 |
 |
| Module-wise count rates for Quadrant D Data is divided into 100 sec bins |
 |
 |
| Parameter | Plot |
|---|---|
| CZT HV Monitor |  |
| D_VDD |  |
| Temperature 1 |  |
| Veto HV Monitor | 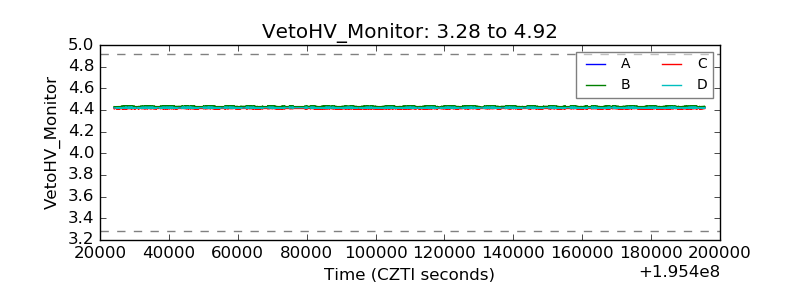 |
| Veto LLD |  |
| Alpha Counter |  |
| _CPM_Rate |  |
| CZT Counter |  |
| +2.5 Volts monitor |  |
| +5 Volts monitor | 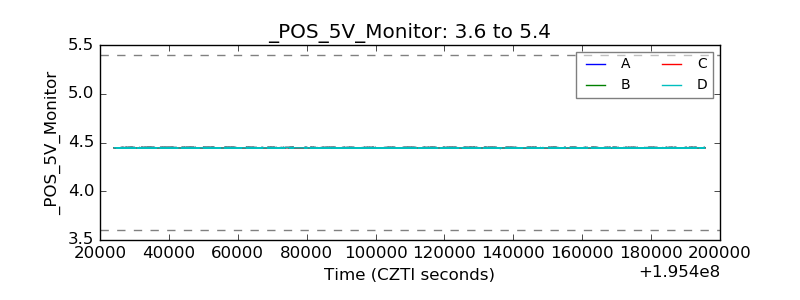 |
| _ROLL_ROT |  |
| _Roll_DEC |  |
| _Roll_RA | 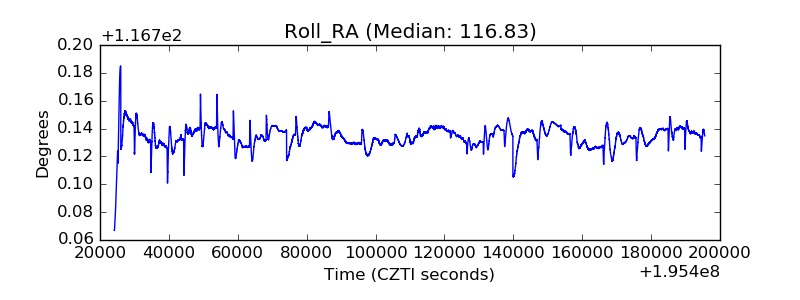 |
| Veto Counter |  |