| Param | Original file | Final file |
|---|---|---|
| Filename | modeM0/AS1G02_018T06_9000000370_02454cztM0_level2.evt | modeM0/AS1G02_018T06_9000000370_02454cztM0_level2_quad_clean.evt |
| Size (bytes) | 458,202,240 | 90,768,960 |
| Size | 437.0 MB | 86.6 MB |
| Events in quadrant A | 3,236,918 | 563,284 |
| Events in quadrant B | 3,337,202 | 575,191 |
| Events in quadrant C | 3,139,939 | 570,470 |
| Events in quadrant D | 3,677,637 | 543,171 |
| Mode M9 | |||
|---|---|---|---|
| Quadrant | BADHDUFLAG | Total packets | Discarded packets |
| A | 0 | 12 | 0 |
| B | 0 | 12 | 0 |
| C | 0 | 12 | 0 |
| D | 0 | 12 | 0 |
| Mode SS | |||
|---|---|---|---|
| Quadrant | BADHDUFLAG | Total packets | Discarded packets |
| A | 0 | 146 | 0 |
| B | 0 | 146 | 0 |
| C | 0 | 146 | 0 |
| D | 0 | 146 | 0 |
| Mode M0 | |||
|---|---|---|---|
| Quadrant | BADHDUFLAG | Total packets | Discarded packets |
| A | 0 | 14687 | 3 |
| B | 0 | 14959 | 2 |
| C | 0 | 14633 | 2 |
| D | 0 | 16325 | 2 |
| Quadrant | Total seconds | Saturated seconds | Saturation percentage |
|---|---|---|---|
| A | 7134 | 43 | 0.602747% |
| B | 7134 | 64 | 0.897112% |
| C | 7134 | 45 | 0.630782% |
| D | 7134 | 208 | 2.915615% |
Noise dominated data is calculated using 1-second bins in cleaned event files. If a bin has >2000 counts, and if more than 50% of those come from <1% of pixels, then it is considered to be noise-dominated and hence unusable.
| Quadrant | # 1 sec bins | Bins with >0 counts | Bins with >2000 counts | High rate bins dominated by noise | Noise dominated (total time) | Noise dominated (detector-on time) | Marked lightcurve |
|---|---|---|---|---|---|---|---|
| A | 8329 | 7136 | 9 | 9 | 0.11% | 0.13% | 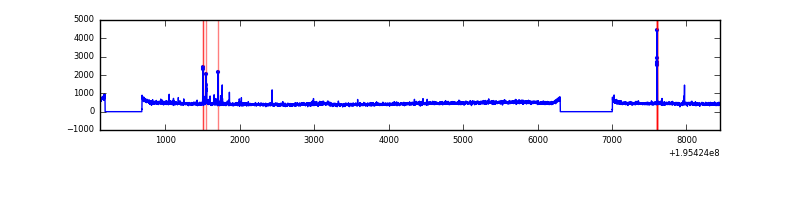 |
| B | 8329 | 7136 | 13 | 13 | 0.16% | 0.18% | 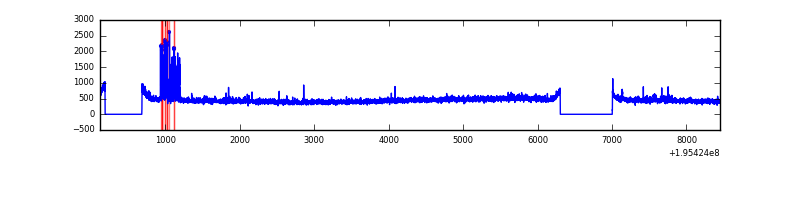 |
| C | 8329 | 7136 | 7 | 7 | 0.08% | 0.10% | 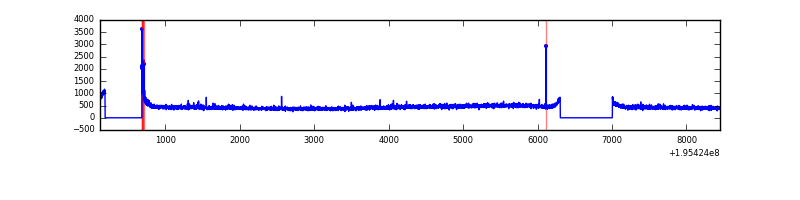 |
| D | 8329 | 7136 | 143 | 143 | 1.72% | 2.00% | 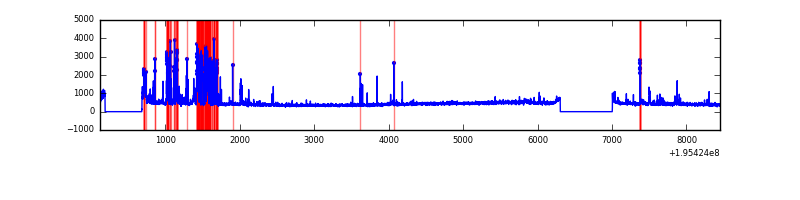 |
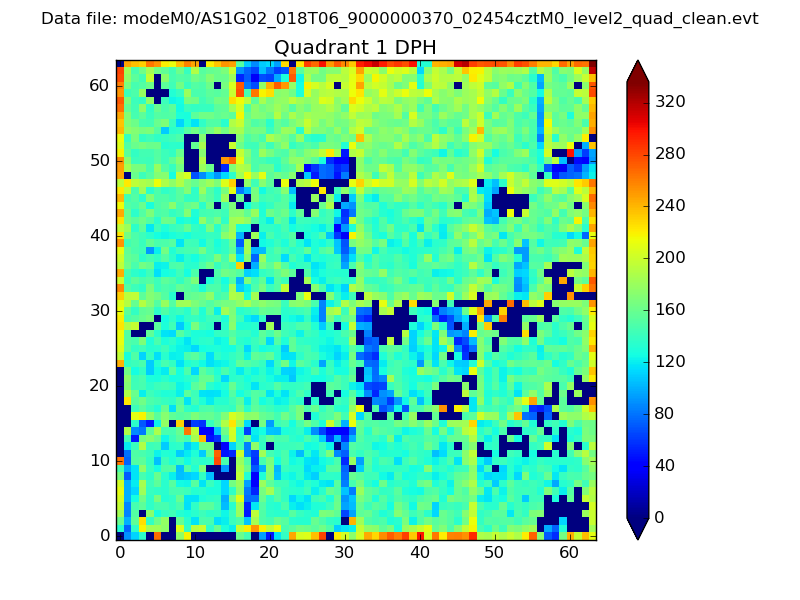
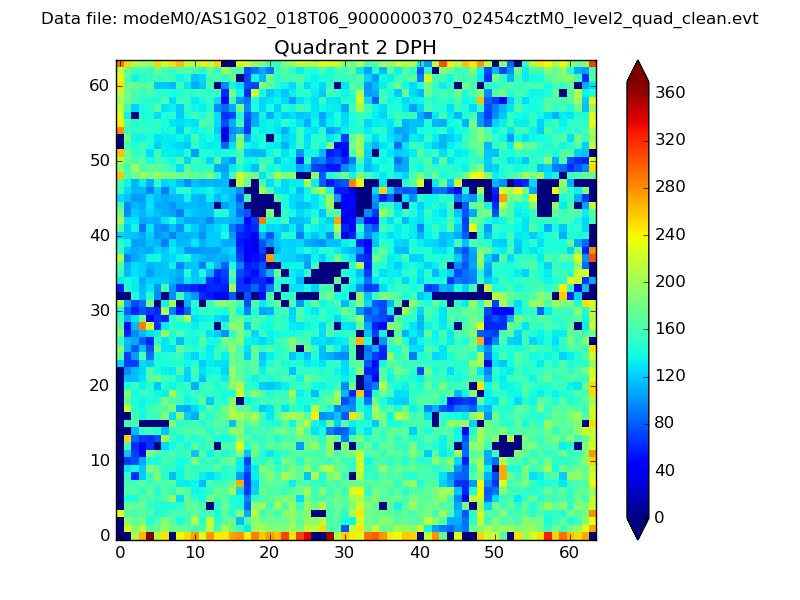
Top three noisy pixels from each quadrant. If the there are fewer than three noisy pixels in the level2.evt file, extra rows are filled as -1
| Pixel properties | Quadrant properties | ||||||
|---|---|---|---|---|---|---|---|
| Quadrant | DetID | PixID | Counts | Sigma | Mean | Median | Sigma |
| A | 8 | 15 | 111985 | 665.4 | 803 | 784 | 167.1 |
| A | 0 | 149 | 20260 | 116.54 | 803 | 784 | 167.1 |
| A | 0 | 226 | 10537 | 58.36 | 803 | 784 | 167.1 |
| B | 15 | 255 | 138704 | 860.74 | 821 | 801 | 160.2 |
| B | 4 | 200 | 12213 | 71.23 | 821 | 801 | 160.2 |
| B | 12 | 111 | 11268 | 65.33 | 821 | 801 | 160.2 |
| C | 2 | 53 | 47077 | 250.16 | 782 | 783 | 185.1 |
| C | 9 | 191 | 14348 | 73.3 | 782 | 783 | 185.1 |
| C | 13 | 61 | 7062 | 33.93 | 782 | 783 | 185.1 |
| D | 13 | 53 | 380290 | 2072.99 | 767 | 747 | 183.1 |
| D | 6 | 112 | 186862 | 1016.52 | 767 | 747 | 183.1 |
| D | 5 | 239 | 43928 | 235.85 | 767 | 747 | 183.1 |
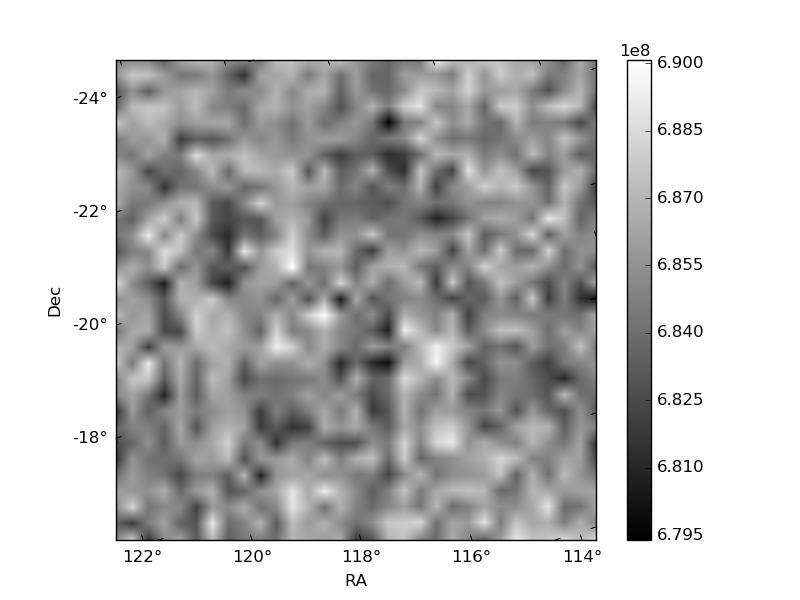
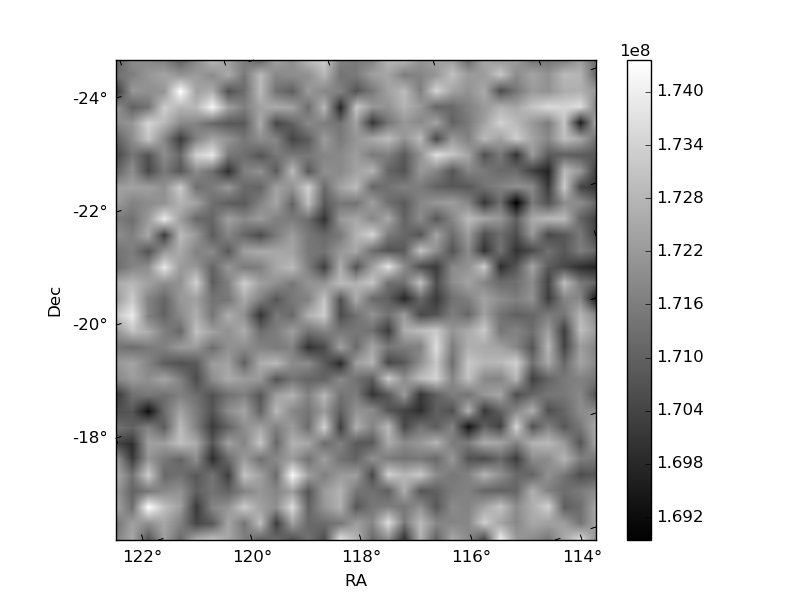
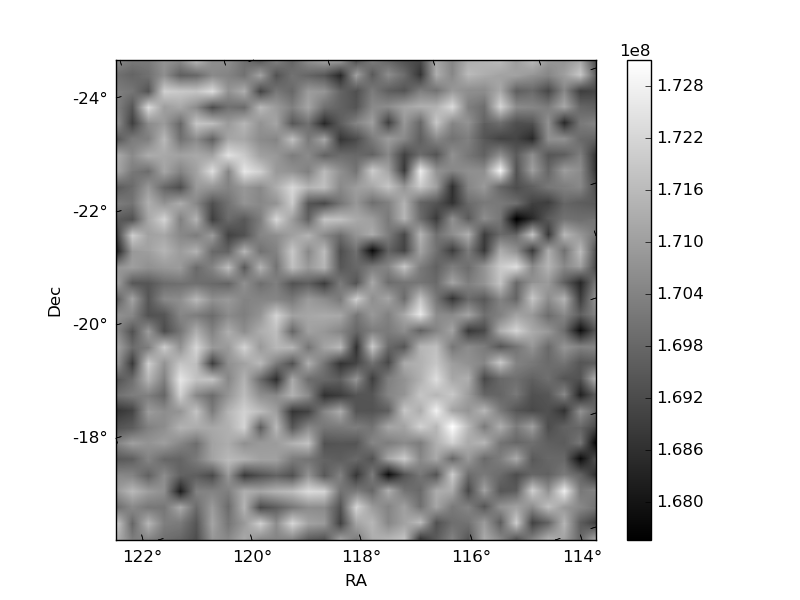
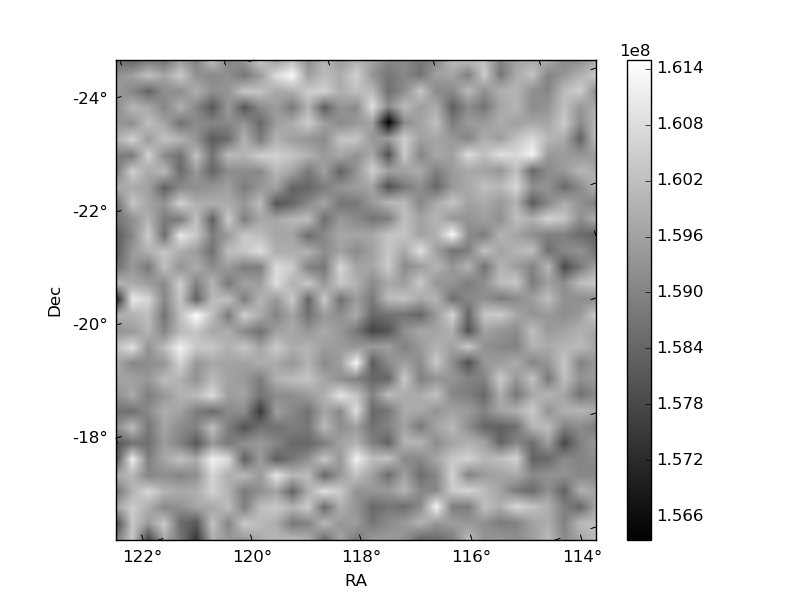
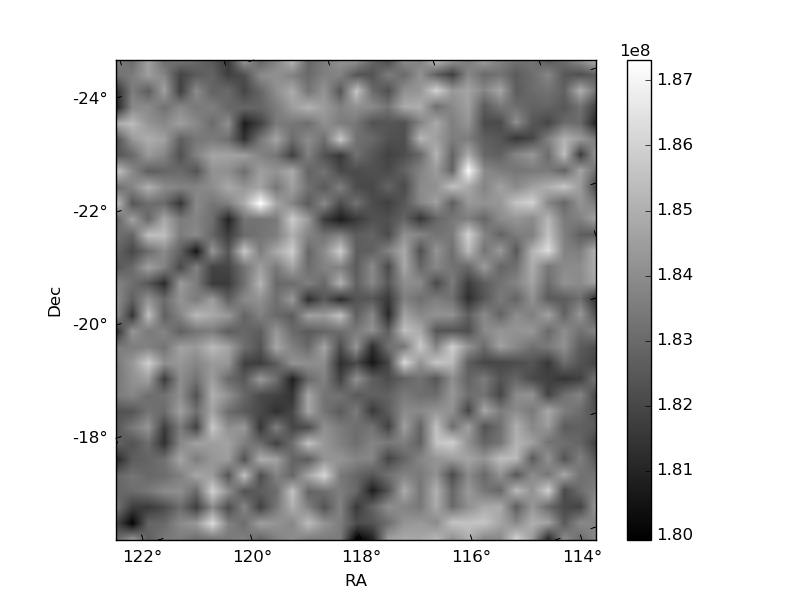
Histogram calculated using DETX and DETY for each event in the final _common_clean file
| Quadrant A | 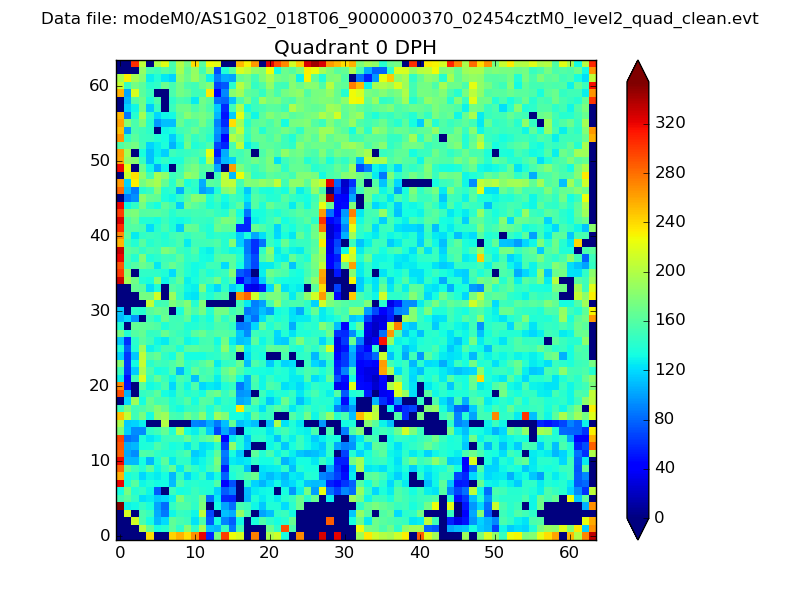 |
 |
Quadrant B |
|---|---|---|---|
| Quadrant D | 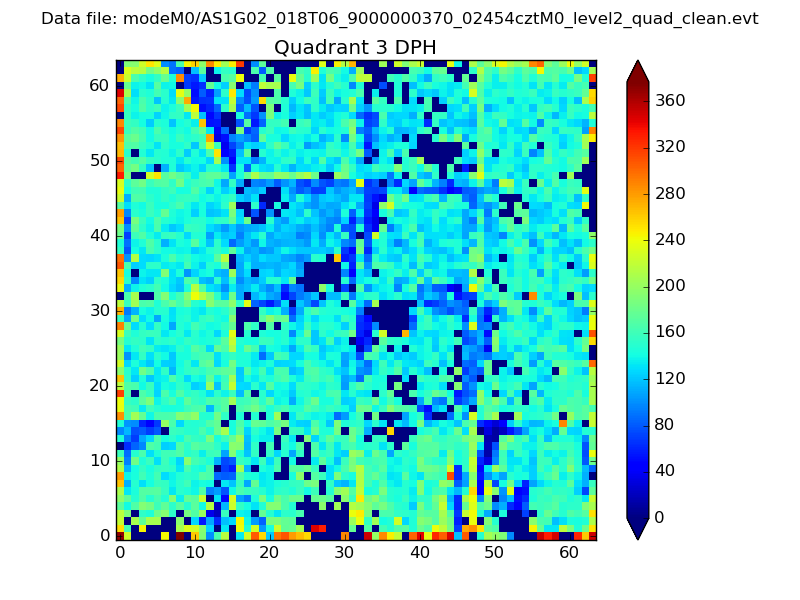 |
 |
Quadrant C |
| Plot type | Count rate plots | Images |
|---|---|---|
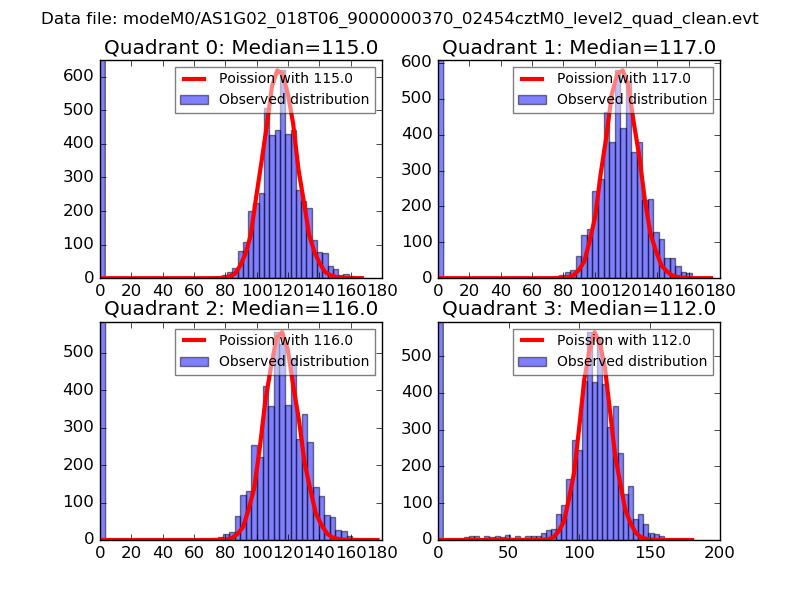
| Comparison with Poisson distribution Blue bars denote a histogram of data divided into 1 sec bins. Red curve is a Poisson curve with rate = median count rate of data. |
 |
 |
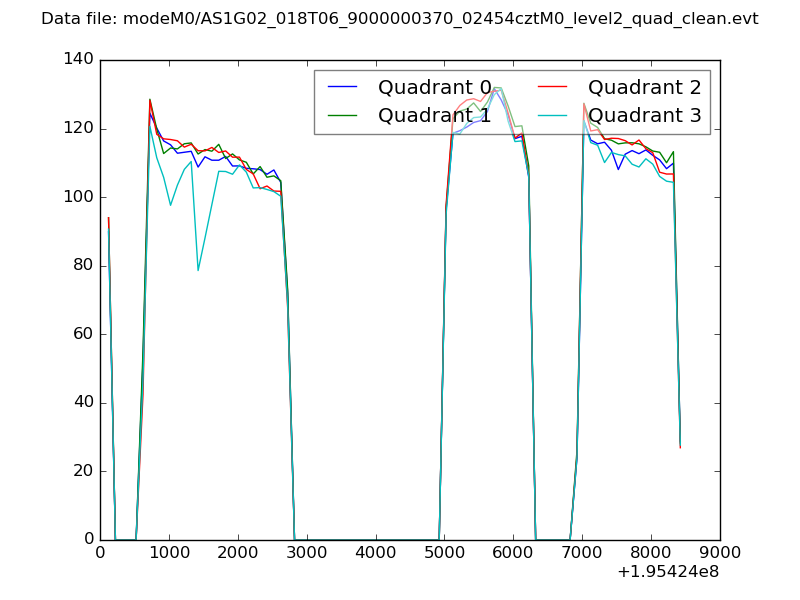
| Quadrant-wise count rates Data is divided into 100 sec bins |
 |
|
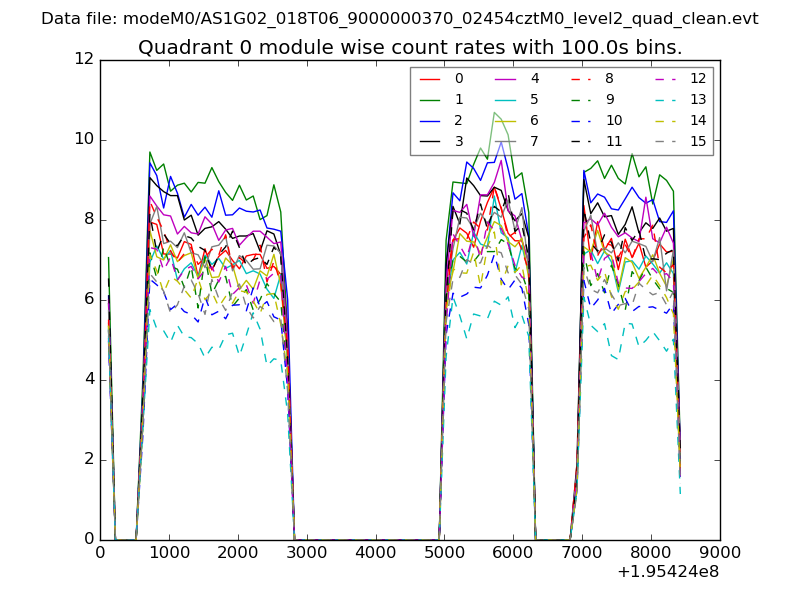
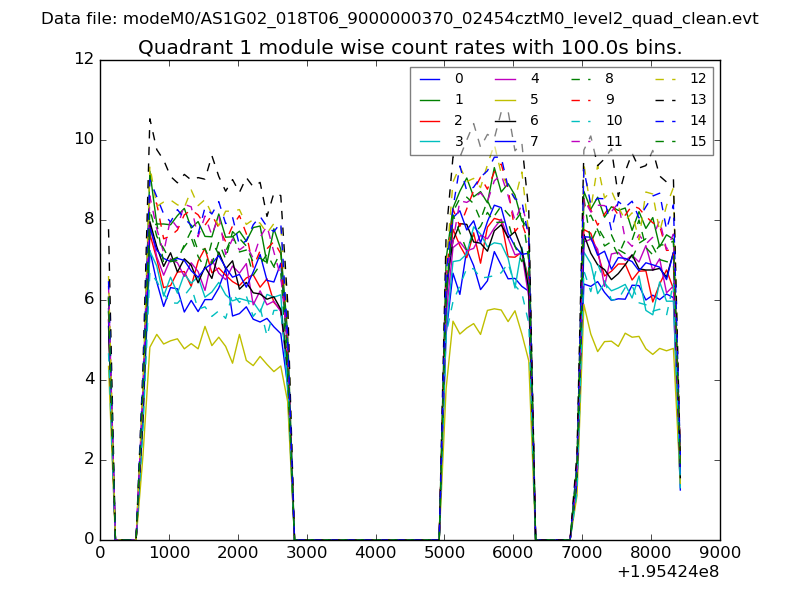
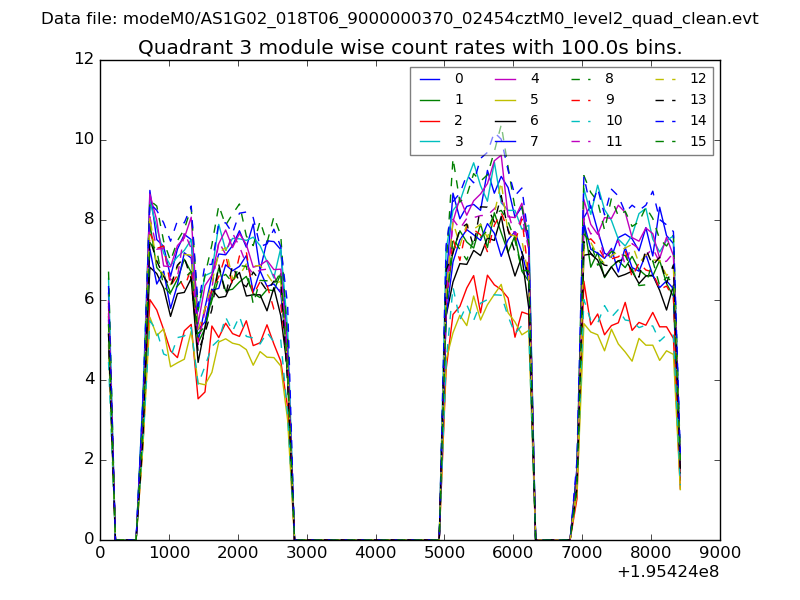
| Module-wise count rates for Quadrant A Data is divided into 100 sec bins |
 |
 |
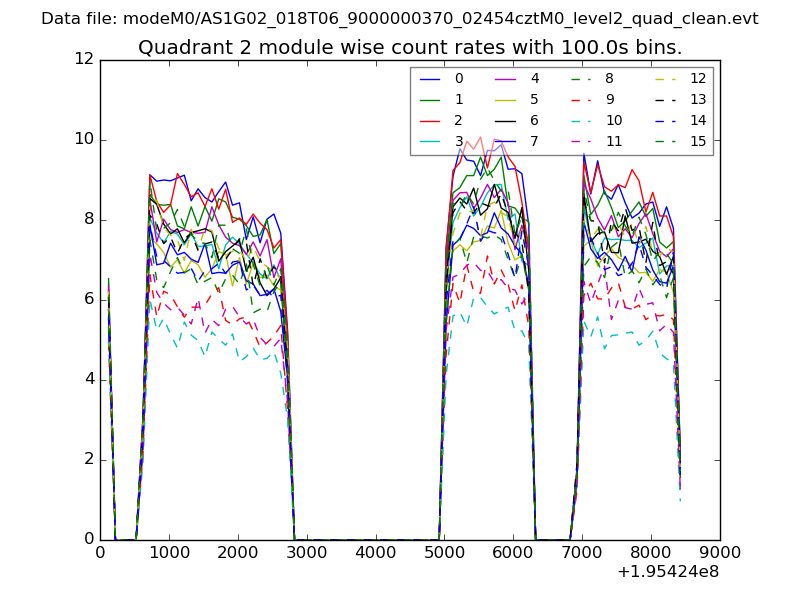
| Module-wise count rates for Quadrant B Data is divided into 100 sec bins |
 |
 |
| Module-wise count rates for Quadrant C Data is divided into 100 sec bins |
 |
 |
| Module-wise count rates for Quadrant D Data is divided into 100 sec bins |
 |
 |
| Parameter | Plot |
|---|---|
| CZT HV Monitor | 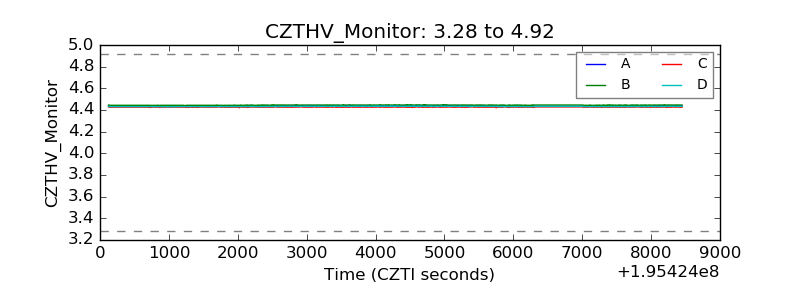 |
| D_VDD |  |
| Temperature 1 | 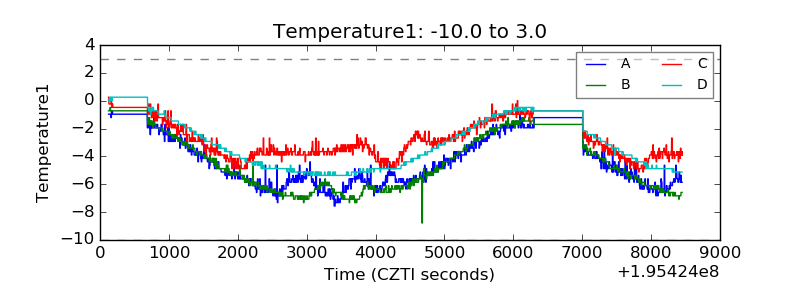 |
| Veto HV Monitor | 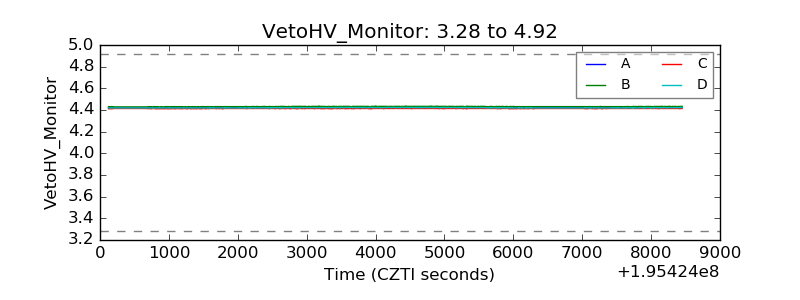 |
| Veto LLD | 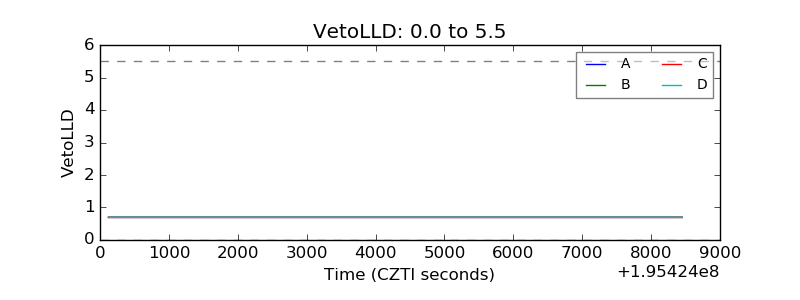 |
| Alpha Counter | 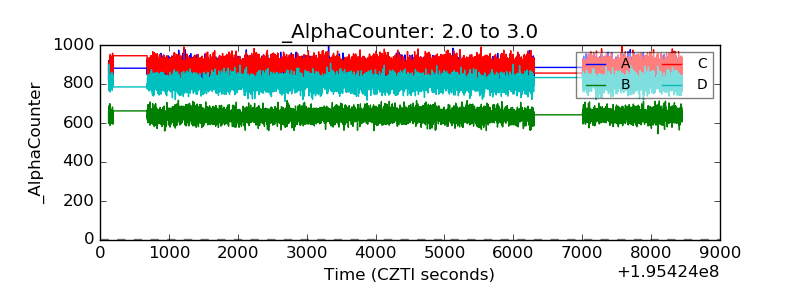 |
| _CPM_Rate | 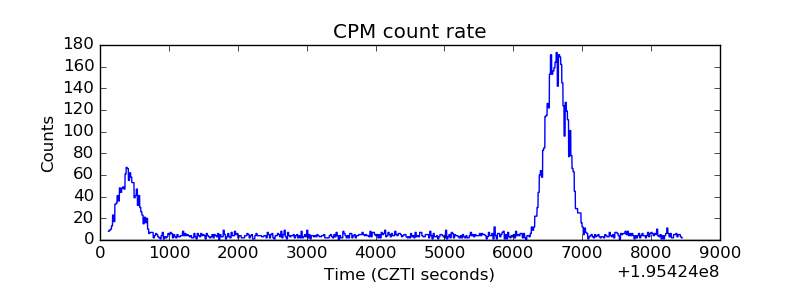 |
| CZT Counter | 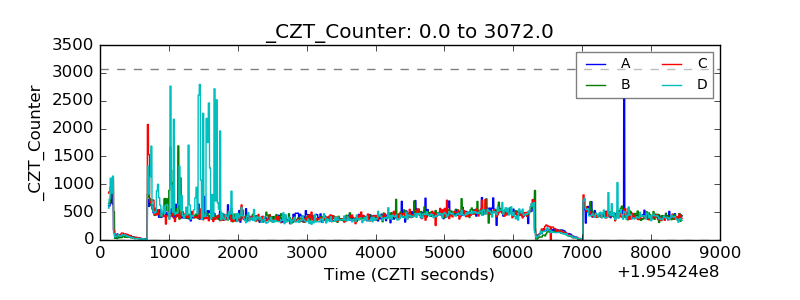 |
| +2.5 Volts monitor |  |
| +5 Volts monitor |  |
| _ROLL_ROT | 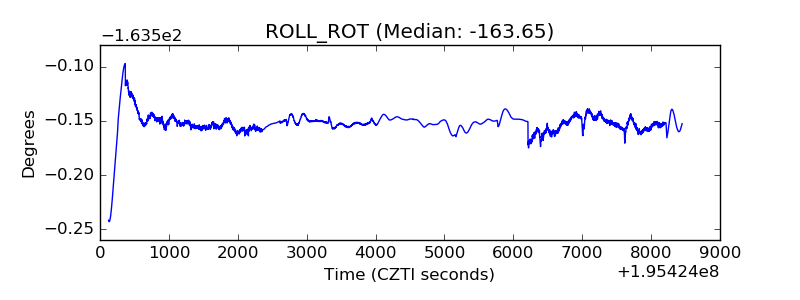 |
| _Roll_DEC | 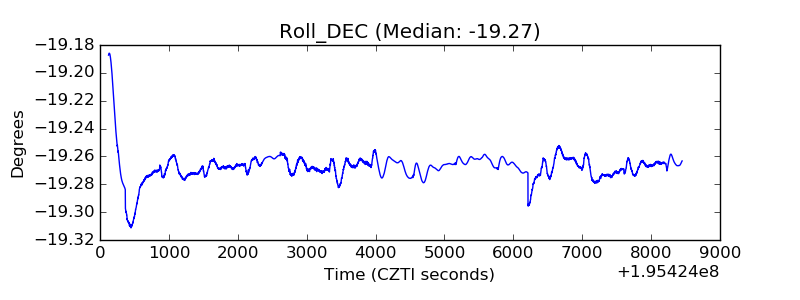 |
| _Roll_RA | 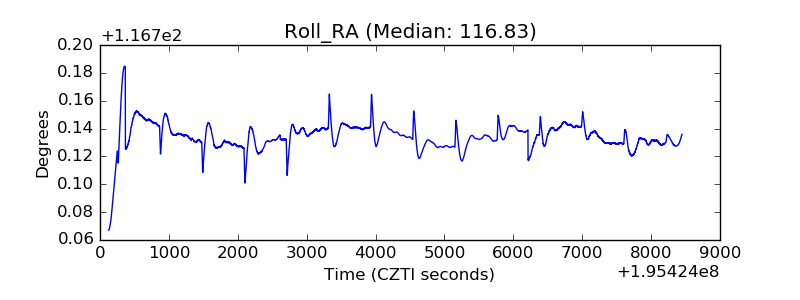 |
| Veto Counter | 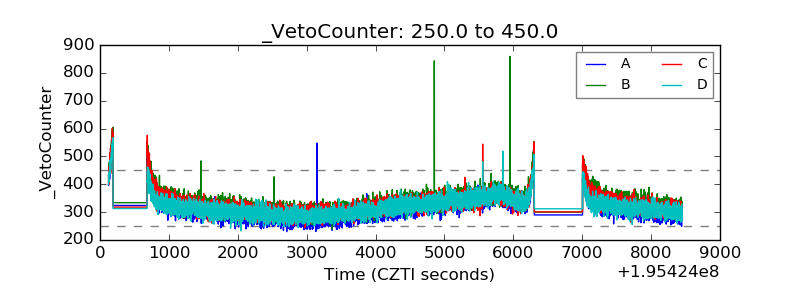 |