| Param | Original file | Final file |
|---|---|---|
| Filename | modeM0/AS1G02_018T06_9000000370_02459cztM0_level2.evt | modeM0/AS1G02_018T06_9000000370_02459cztM0_level2_quad_clean.evt |
| Size (bytes) | 421,623,360 | 60,603,840 |
| Size | 402.1 MB | 57.8 MB |
| Events in quadrant A | 3,025,198 | 342,897 |
| Events in quadrant B | 3,140,468 | 354,163 |
| Events in quadrant C | 3,070,700 | 350,978 |
| Events in quadrant D | 3,095,021 | 337,850 |
| Mode M9 | |||
|---|---|---|---|
| Quadrant | BADHDUFLAG | Total packets | Discarded packets |
| A | 0 | 14 | 0 |
| B | 0 | 14 | 0 |
| C | 0 | 14 | 0 |
| D | 0 | 15 | 0 |
| Mode SS | |||
|---|---|---|---|
| Quadrant | BADHDUFLAG | Total packets | Discarded packets |
| A | 0 | 130 | 0 |
| B | 0 | 130 | 0 |
| C | 0 | 130 | 0 |
| D | 0 | 130 | 0 |
| Mode M0 | |||
|---|---|---|---|
| Quadrant | BADHDUFLAG | Total packets | Discarded packets |
| A | 0 | 13196 | 3 |
| B | 0 | 13314 | 2 |
| C | 0 | 13264 | 2 |
| D | 0 | 13678 | 2 |
| Quadrant | Total seconds | Saturated seconds | Saturation percentage |
|---|---|---|---|
| A | 6435 | 36 | 0.559441% |
| B | 6435 | 40 | 0.621601% |
| C | 6435 | 38 | 0.590521% |
| D | 6435 | 71 | 1.103341% |
Noise dominated data is calculated using 1-second bins in cleaned event files. If a bin has >2000 counts, and if more than 50% of those come from <1% of pixels, then it is considered to be noise-dominated and hence unusable.
| Quadrant | # 1 sec bins | Bins with >0 counts | Bins with >2000 counts | High rate bins dominated by noise | Noise dominated (total time) | Noise dominated (detector-on time) | Marked lightcurve |
|---|---|---|---|---|---|---|---|
| A | 7655 | 6436 | 0 | 0 | 0.00% | 0.00% | 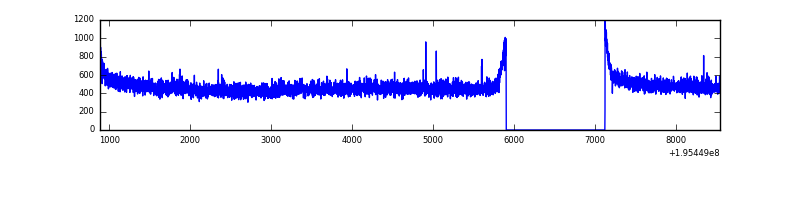 |
| B | 7655 | 6436 | 0 | 0 | 0.00% | 0.00% | 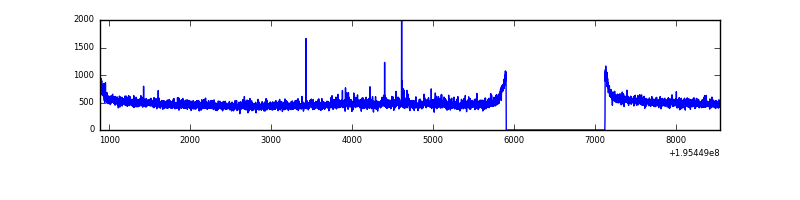 |
| C | 7655 | 6436 | 0 | 0 | 0.00% | 0.00% | 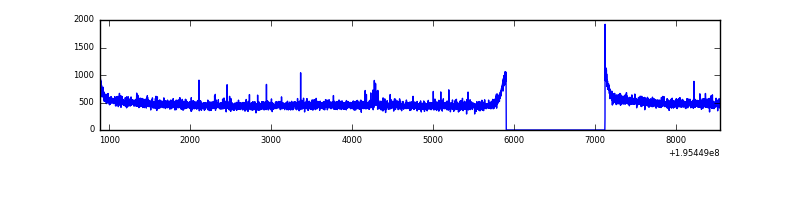 |
| D | 7655 | 6436 | 18 | 18 | 0.24% | 0.28% | 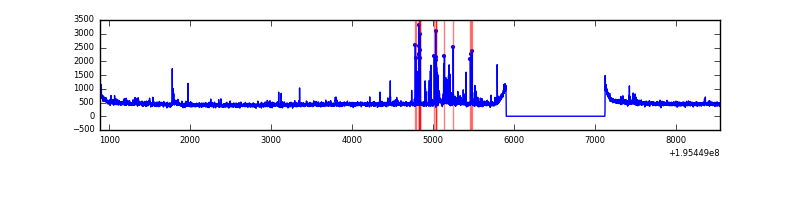 |
Top three noisy pixels from each quadrant. If the there are fewer than three noisy pixels in the level2.evt file, extra rows are filled as -1
| Pixel properties | Quadrant properties | ||||||
|---|---|---|---|---|---|---|---|
| Quadrant | DetID | PixID | Counts | Sigma | Mean | Median | Sigma |
| A | 14 | 63 | 9220 | 53.1 | 780 | 763 | 159.3 |
| A | 8 | 15 | 8822 | 50.61 | 780 | 763 | 159.3 |
| A | 12 | 194 | 8678 | 49.7 | 780 | 763 | 159.3 |
| B | 3 | 0 | 23254 | 149.72 | 800 | 782 | 150.1 |
| B | 15 | 85 | 16736 | 106.3 | 800 | 782 | 150.1 |
| B | 5 | 6 | 13930 | 87.6 | 800 | 782 | 150.1 |
| C | 8 | 112 | 27473 | 148.23 | 768 | 770 | 180.2 |
| C | 12 | 4 | 16711 | 88.49 | 768 | 770 | 180.2 |
| C | 8 | 128 | 12457 | 64.87 | 768 | 770 | 180.2 |
| D | 6 | 112 | 87381 | 488.92 | 752 | 736 | 177.2 |
| D | 7 | 67 | 70071 | 391.24 | 752 | 736 | 177.2 |
| D | 9 | 64 | 19118 | 103.73 | 752 | 736 | 177.2 |
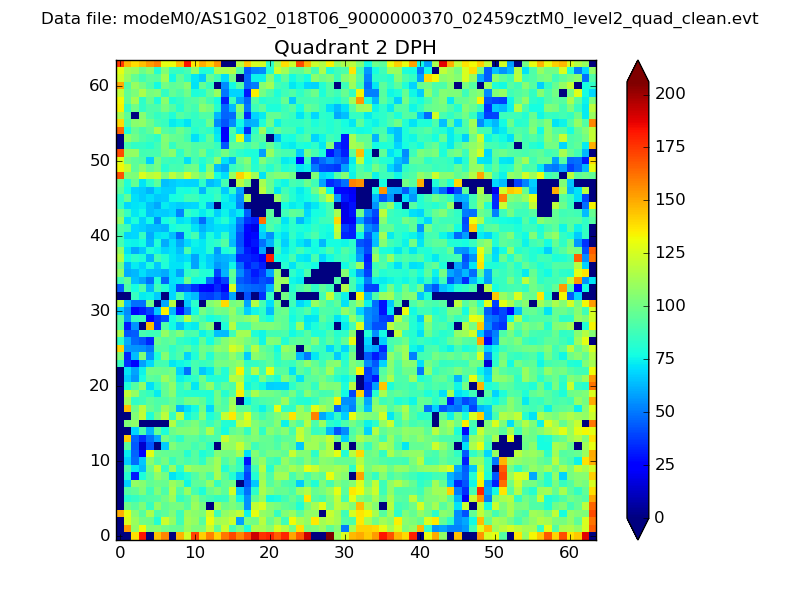
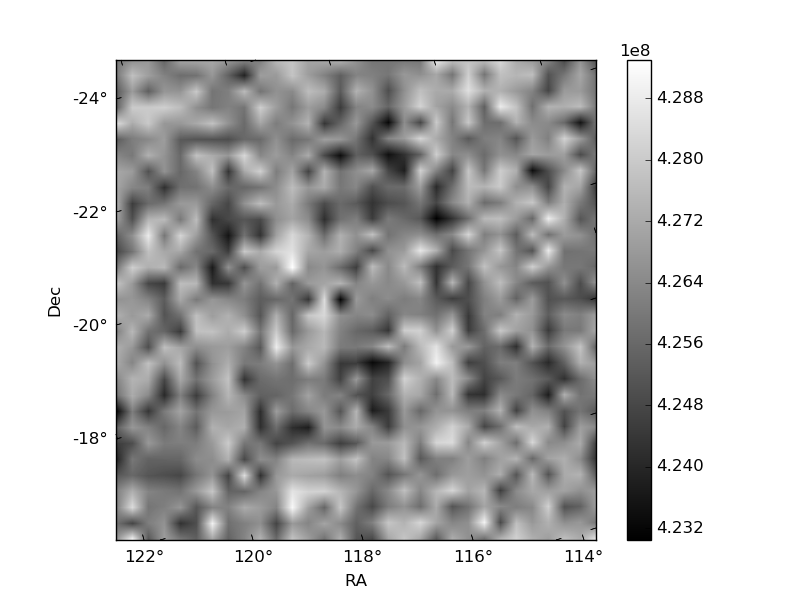
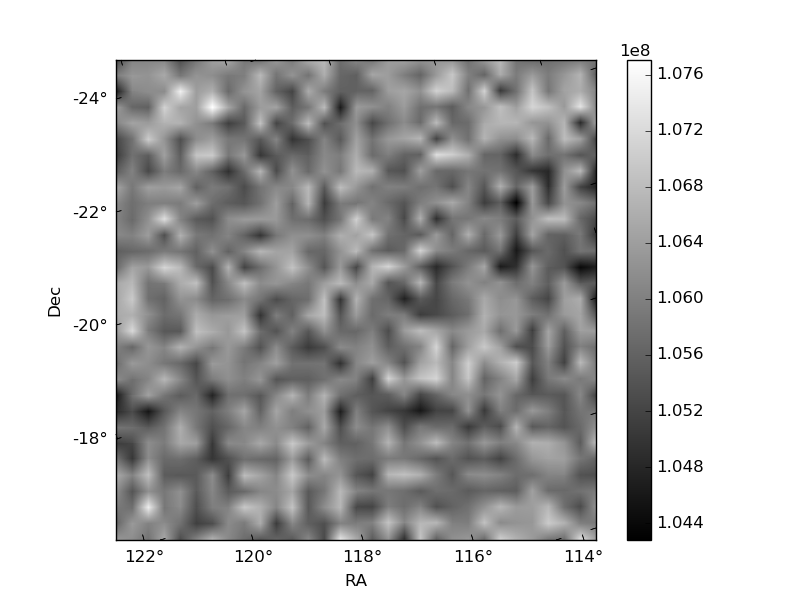
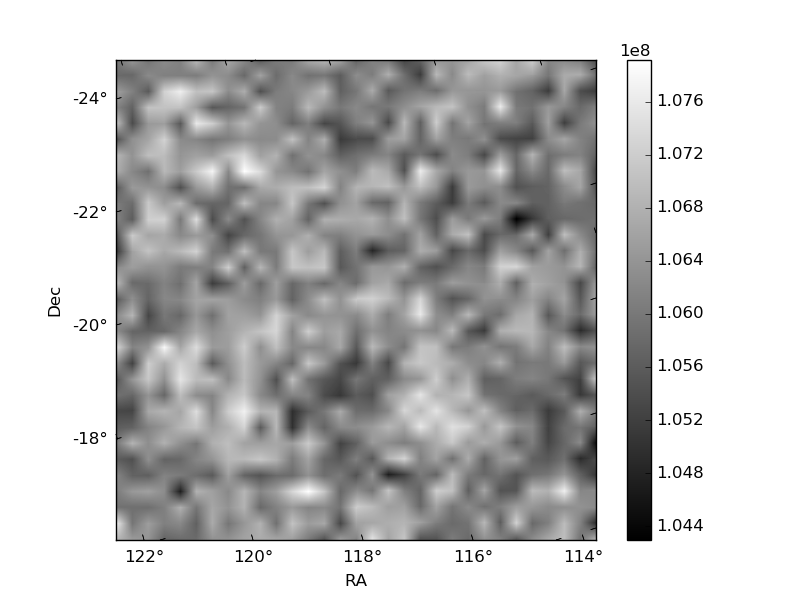
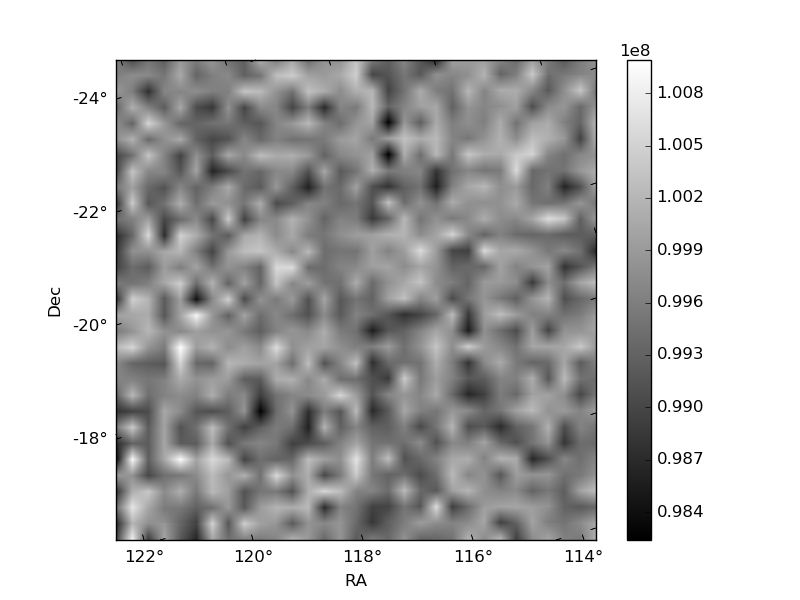
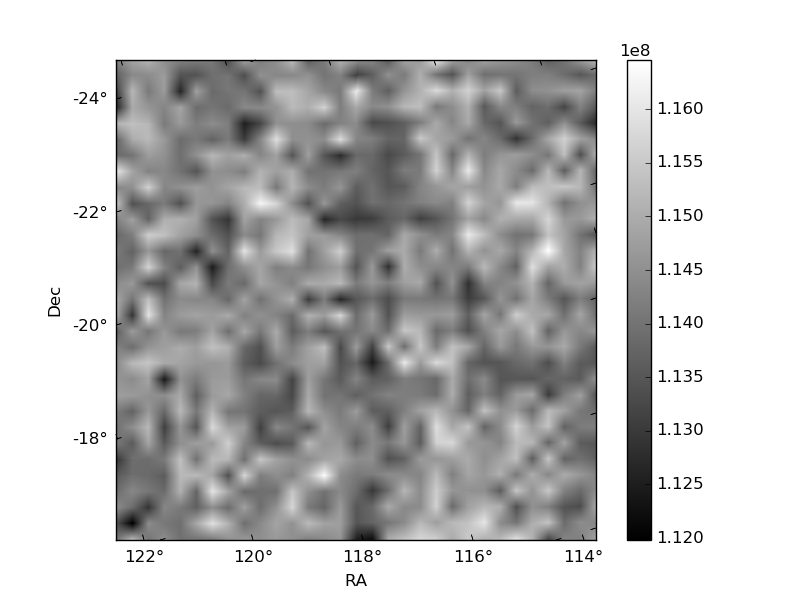
Histogram calculated using DETX and DETY for each event in the final _common_clean file
| Quadrant A | 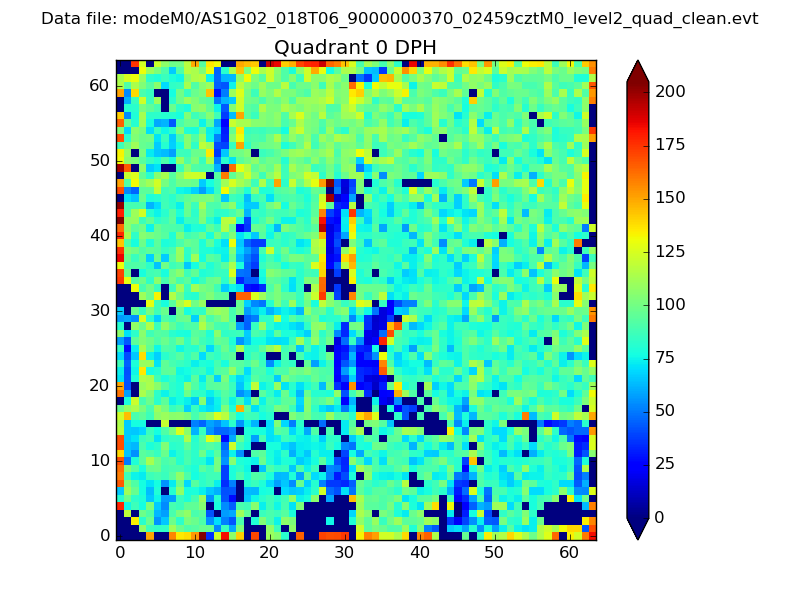 |
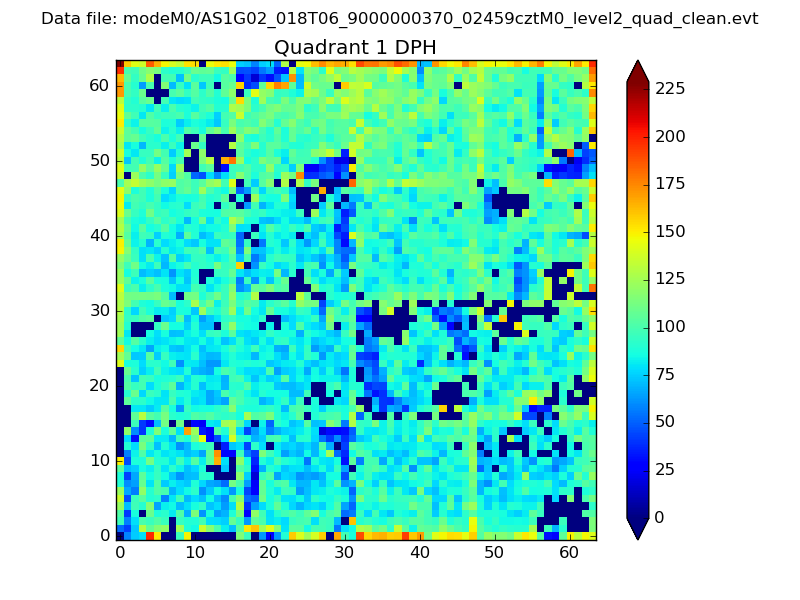 |
Quadrant B |
|---|---|---|---|
| Quadrant D | 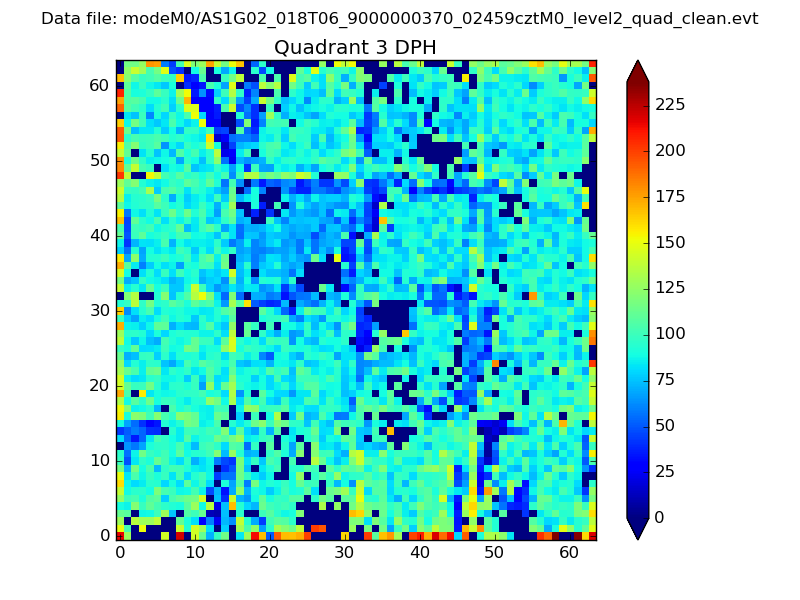 |
 |
Quadrant C |
| Plot type | Count rate plots | Images |
|---|---|---|
| Comparison with Poisson distribution Blue bars denote a histogram of data divided into 1 sec bins. Red curve is a Poisson curve with rate = median count rate of data. |
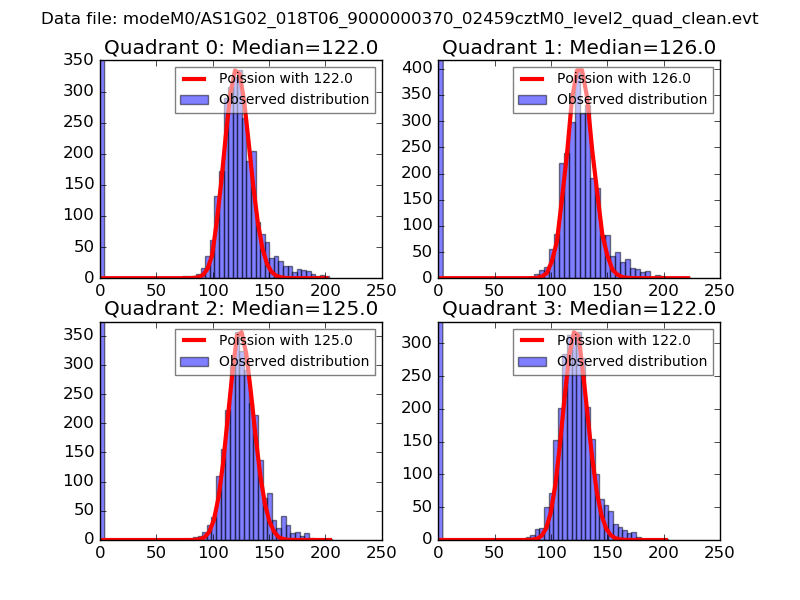 |
 |
| Quadrant-wise count rates Data is divided into 100 sec bins |
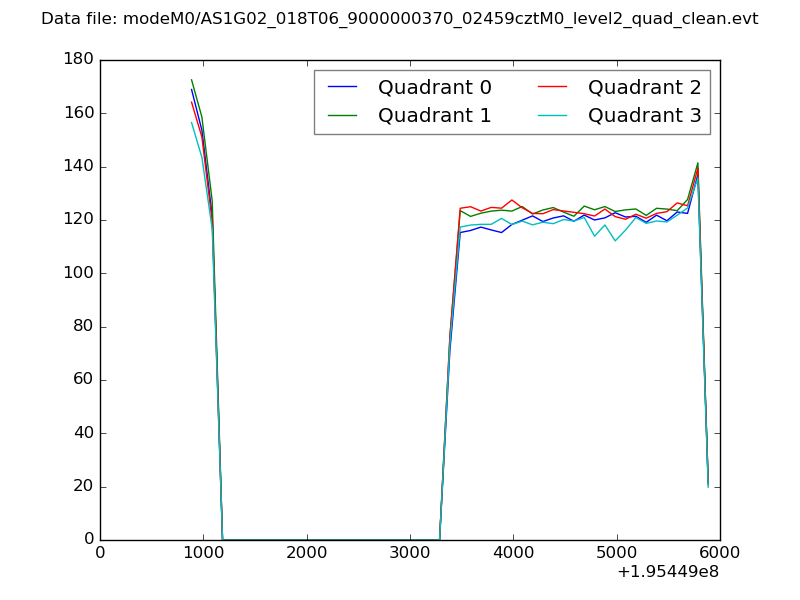 |
|
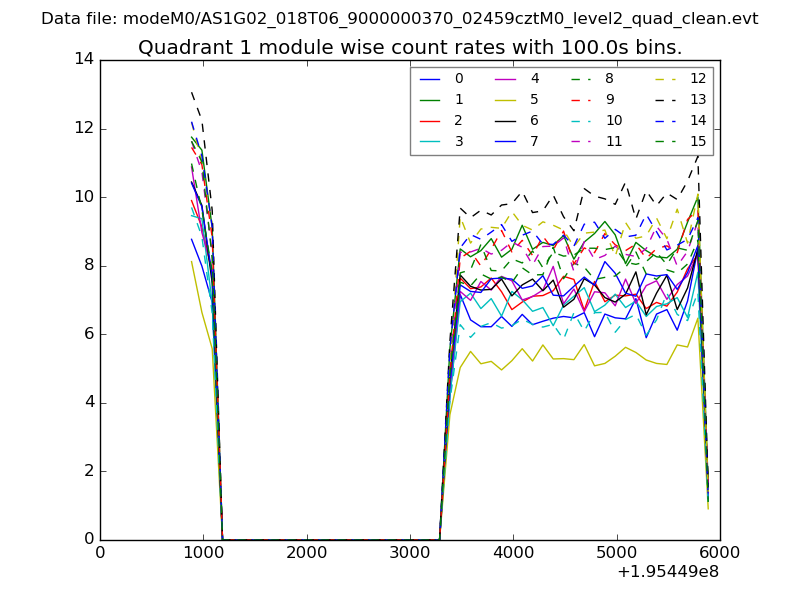
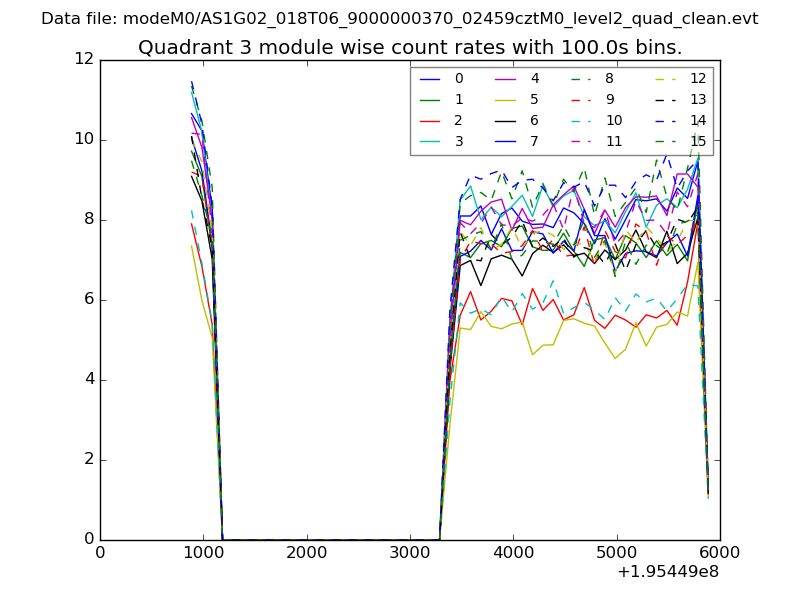
| Module-wise count rates for Quadrant A Data is divided into 100 sec bins |
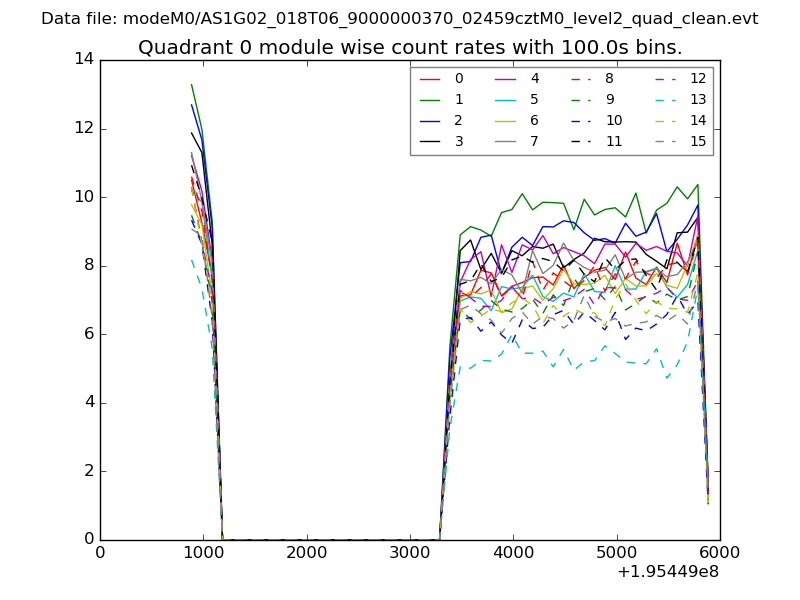 |
 |
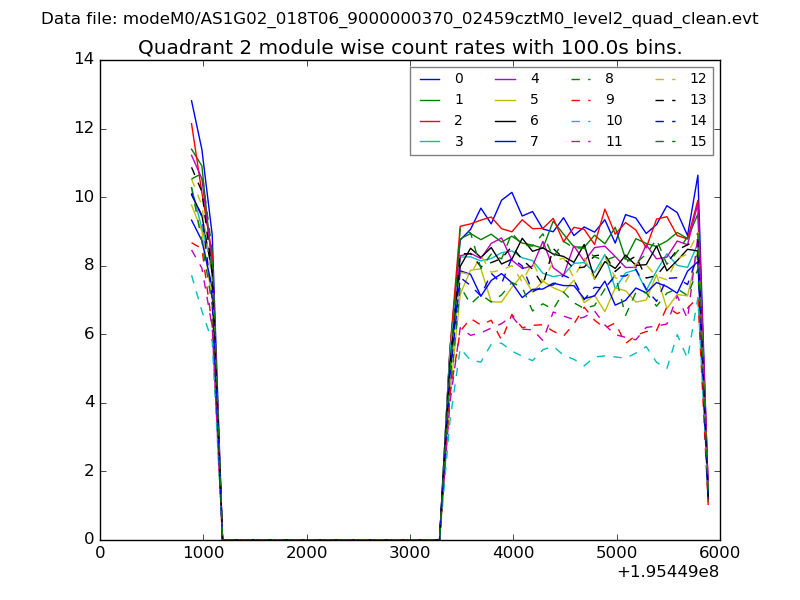
| Module-wise count rates for Quadrant B Data is divided into 100 sec bins |
 |
 |
| Module-wise count rates for Quadrant C Data is divided into 100 sec bins |
 |
 |
| Module-wise count rates for Quadrant D Data is divided into 100 sec bins |
 |
 |
| Parameter | Plot |
|---|---|
| CZT HV Monitor | 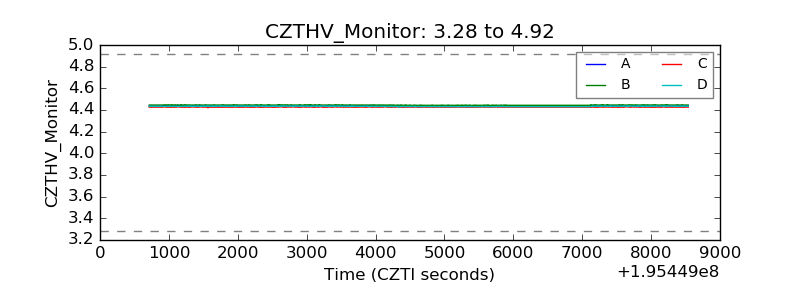 |
| D_VDD | 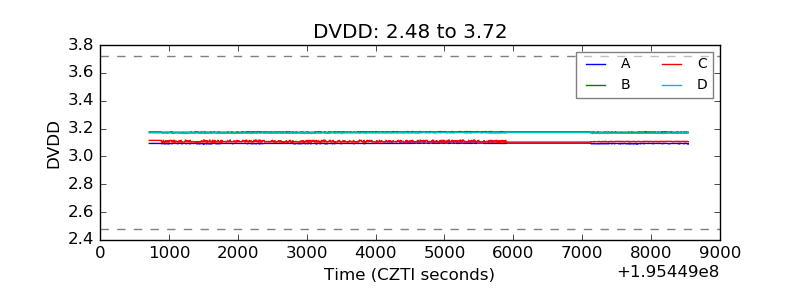 |
| Temperature 1 | 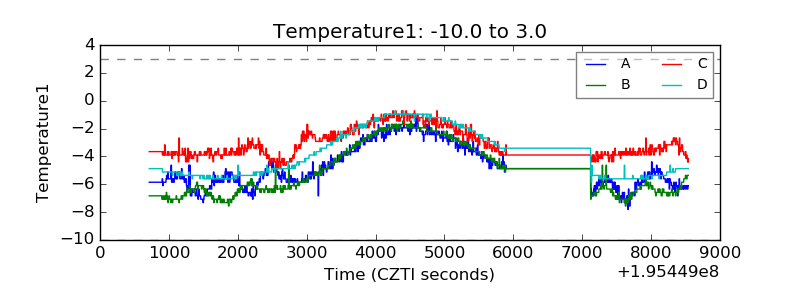 |
| Veto HV Monitor | 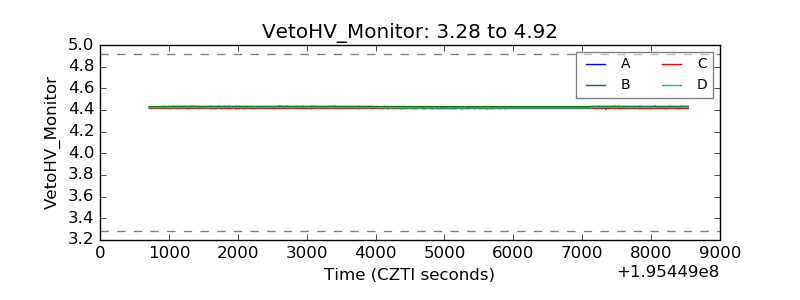 |
| Veto LLD | 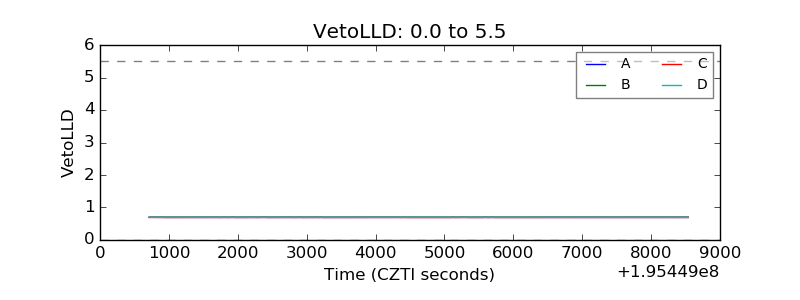 |
| Alpha Counter | 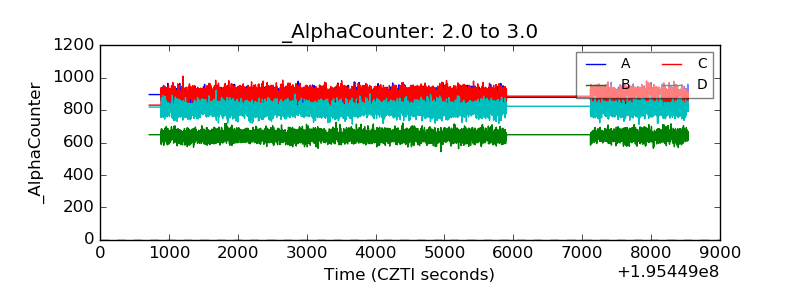 |
| _CPM_Rate | 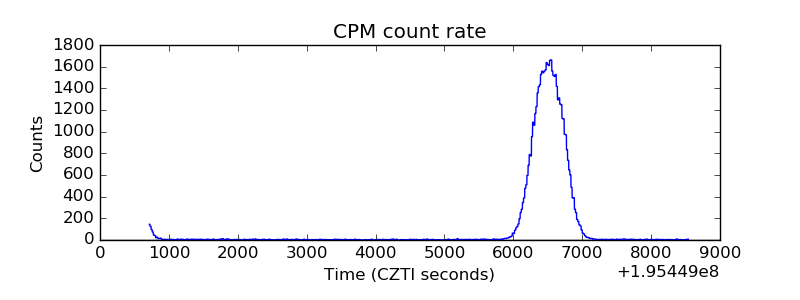 |
| CZT Counter | 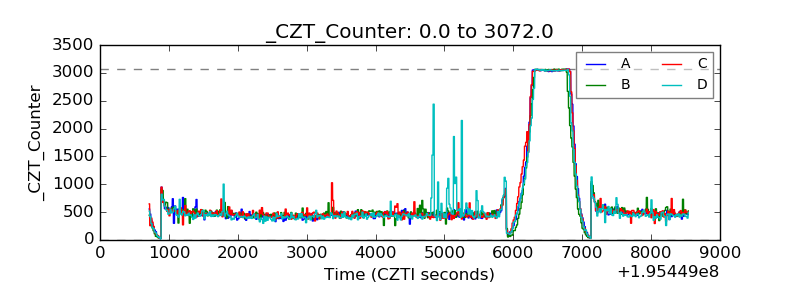 |
| +2.5 Volts monitor | 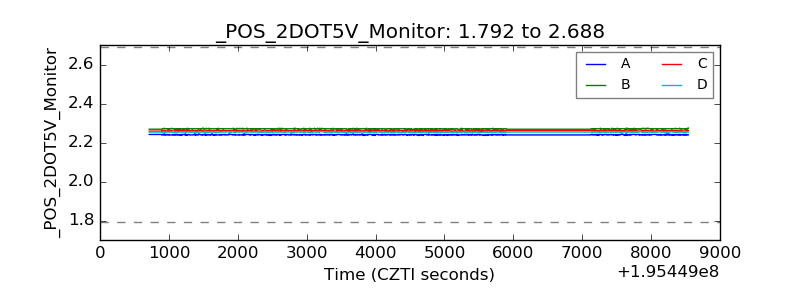 |
| +5 Volts monitor | 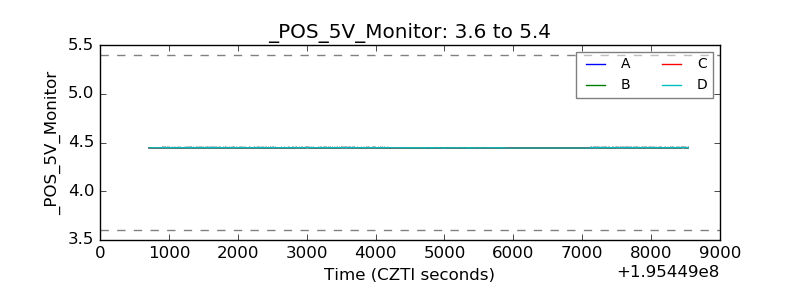 |
| _ROLL_ROT | 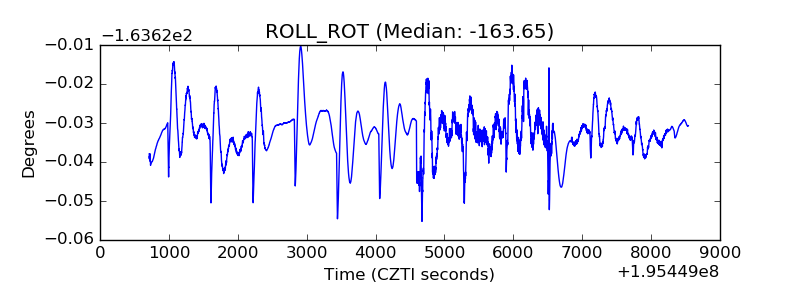 |
| _Roll_DEC | 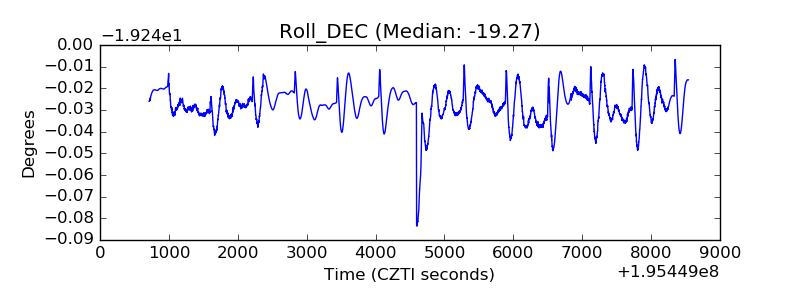 |
| _Roll_RA | 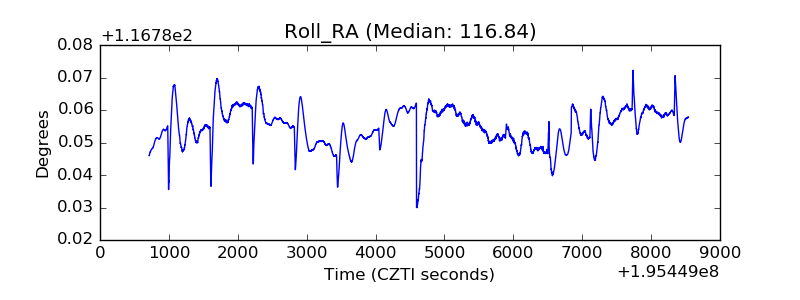 |
| Veto Counter | 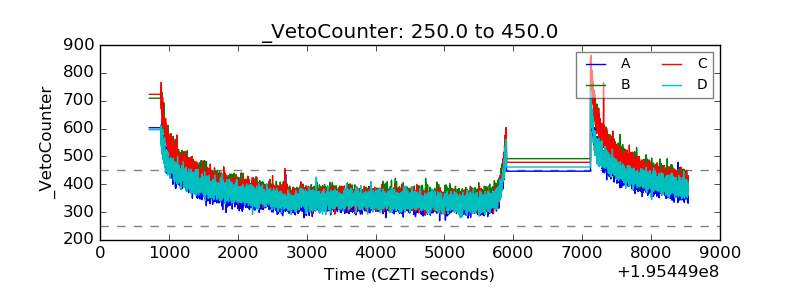 |