| Param | Original file | Final file |
|---|---|---|
| Filename | modeM0/AS1G02_018T06_9000000370_02460cztM0_level2.evt | modeM0/AS1G02_018T06_9000000370_02460cztM0_level2_quad_clean.evt |
| Size (bytes) | 425,718,720 | 61,790,400 |
| Size | 406.0 MB | 58.9 MB |
| Events in quadrant A | 3,035,696 | 352,964 |
| Events in quadrant B | 3,151,085 | 367,468 |
| Events in quadrant C | 3,062,614 | 364,514 |
| Events in quadrant D | 3,218,371 | 349,478 |
| Mode M9 | |||
|---|---|---|---|
| Quadrant | BADHDUFLAG | Total packets | Discarded packets |
| A | 0 | 20 | 0 |
| B | 0 | 20 | 0 |
| C | 0 | 20 | 0 |
| D | 0 | 21 | 0 |
| Mode SS | |||
|---|---|---|---|
| Quadrant | BADHDUFLAG | Total packets | Discarded packets |
| A | 0 | 128 | 0 |
| B | 0 | 128 | 0 |
| C | 0 | 128 | 0 |
| D | 0 | 128 | 0 |
| Mode M0 | |||
|---|---|---|---|
| Quadrant | BADHDUFLAG | Total packets | Discarded packets |
| A | 0 | 12962 | 3 |
| B | 0 | 13144 | 2 |
| C | 0 | 13079 | 2 |
| D | 0 | 13744 | 2 |
| Quadrant | Total seconds | Saturated seconds | Saturation percentage |
|---|---|---|---|
| A | 6246 | 84 | 1.344861% |
| B | 6246 | 93 | 1.488953% |
| C | 6246 | 100 | 1.601025% |
| D | 6246 | 100 | 1.601025% |
Noise dominated data is calculated using 1-second bins in cleaned event files. If a bin has >2000 counts, and if more than 50% of those come from <1% of pixels, then it is considered to be noise-dominated and hence unusable.
| Quadrant | # 1 sec bins | Bins with >0 counts | Bins with >2000 counts | High rate bins dominated by noise | Noise dominated (total time) | Noise dominated (detector-on time) | Marked lightcurve |
|---|---|---|---|---|---|---|---|
| A | 7501 | 6247 | 0 | 0 | 0.00% | 0.00% | 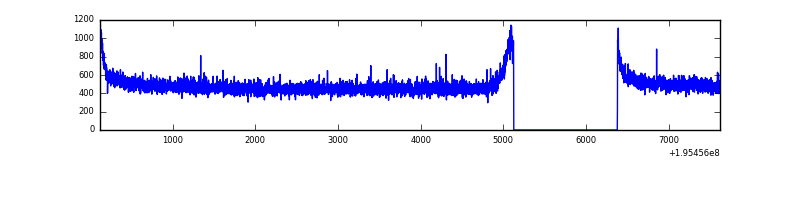 |
| B | 7501 | 6247 | 0 | 0 | 0.00% | 0.00% | 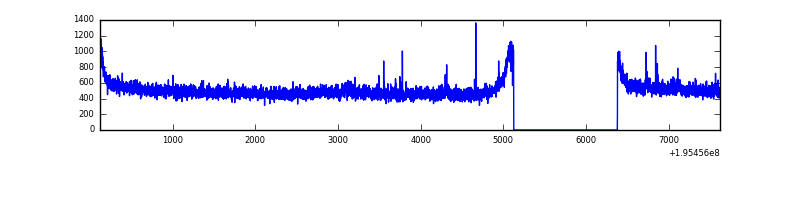 |
| C | 7501 | 6247 | 2 | 2 | 0.03% | 0.03% | 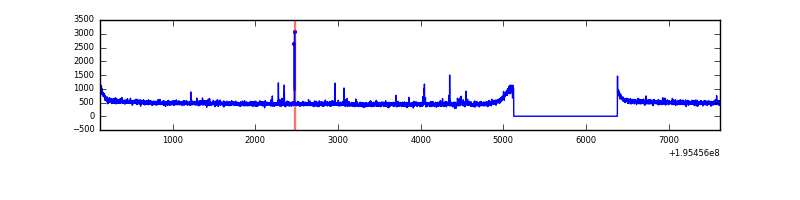 |
| D | 7501 | 6247 | 18 | 18 | 0.24% | 0.29% | 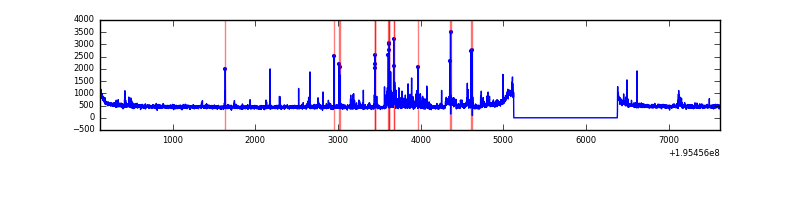 |
Top three noisy pixels from each quadrant. If the there are fewer than three noisy pixels in the level2.evt file, extra rows are filled as -1
| Pixel properties | Quadrant properties | ||||||
|---|---|---|---|---|---|---|---|
| Quadrant | DetID | PixID | Counts | Sigma | Mean | Median | Sigma |
| A | 14 | 63 | 9778 | 56.55 | 784 | 767 | 159.4 |
| A | 12 | 194 | 8746 | 50.07 | 784 | 767 | 159.4 |
| A | 0 | 226 | 8248 | 46.95 | 784 | 767 | 159.4 |
| B | 3 | 0 | 32456 | 206.23 | 803 | 783 | 153.6 |
| B | 0 | 191 | 14343 | 88.29 | 803 | 783 | 153.6 |
| B | 12 | 111 | 10845 | 65.52 | 803 | 783 | 153.6 |
| C | 14 | 223 | 34299 | 187.13 | 770 | 775 | 179.2 |
| C | 12 | 4 | 8540 | 43.34 | 770 | 775 | 179.2 |
| C | 13 | 61 | 7154 | 35.61 | 770 | 775 | 179.2 |
| D | 7 | 67 | 192140 | 1067.29 | 756 | 737 | 179.3 |
| D | 13 | 235 | 58730 | 323.38 | 756 | 737 | 179.3 |
| D | 6 | 112 | 38483 | 210.48 | 756 | 737 | 179.3 |
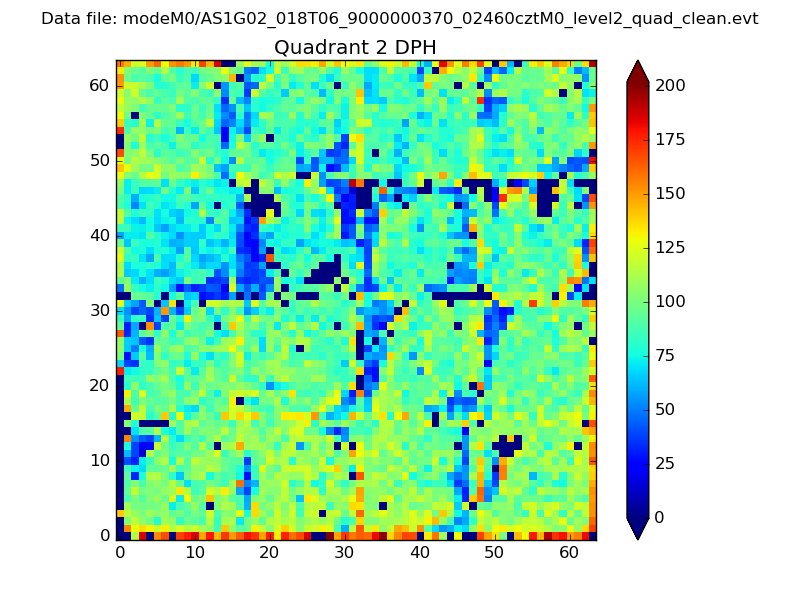
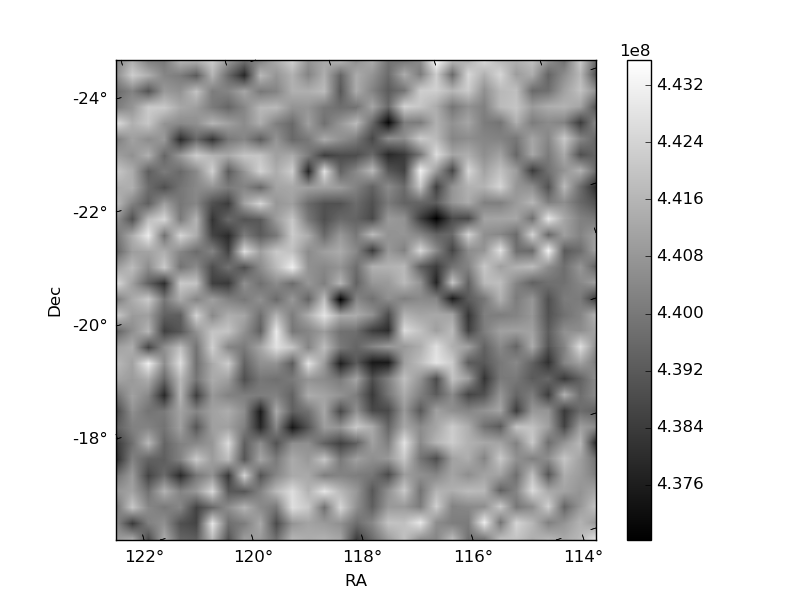
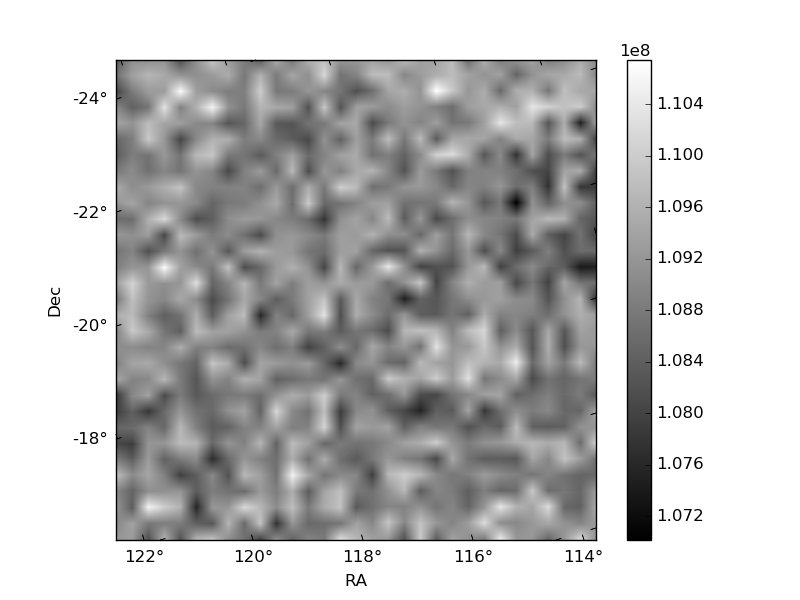
Histogram calculated using DETX and DETY for each event in the final _common_clean file
| Quadrant A | 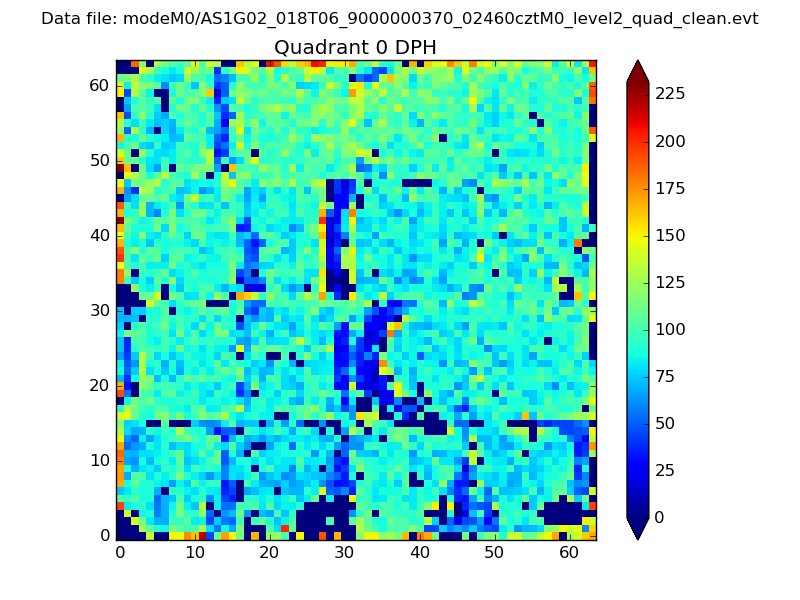 |
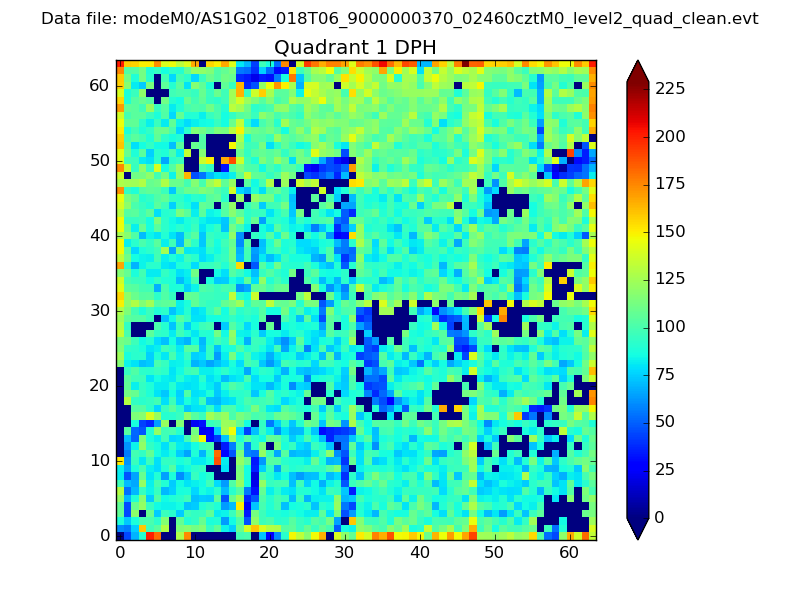 |
Quadrant B |
|---|---|---|---|
| Quadrant D | 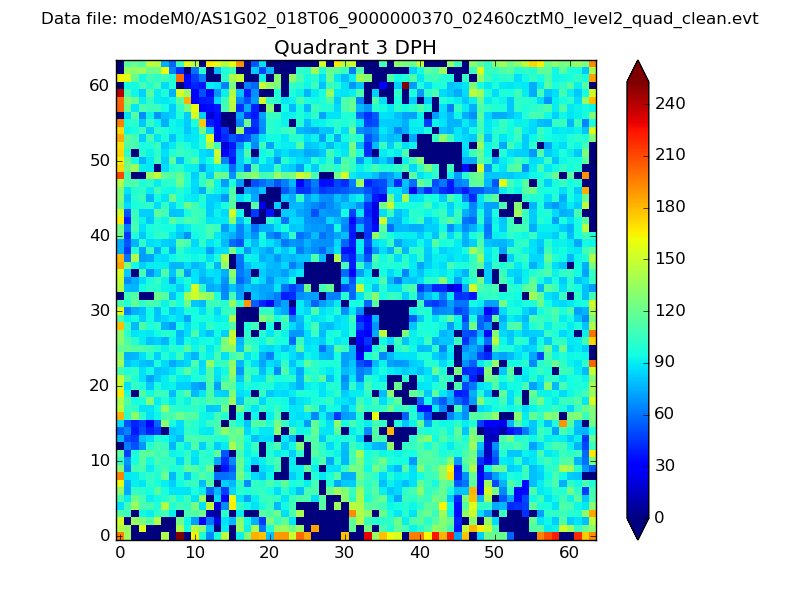 |
 |
Quadrant C |
| Plot type | Count rate plots | Images |
|---|---|---|
| Comparison with Poisson distribution Blue bars denote a histogram of data divided into 1 sec bins. Red curve is a Poisson curve with rate = median count rate of data. |
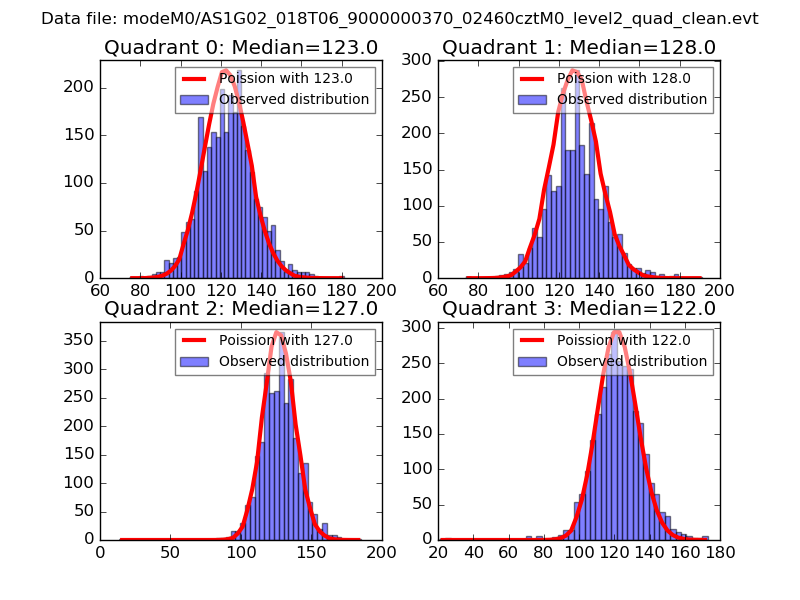 |
 |
| Quadrant-wise count rates Data is divided into 100 sec bins |
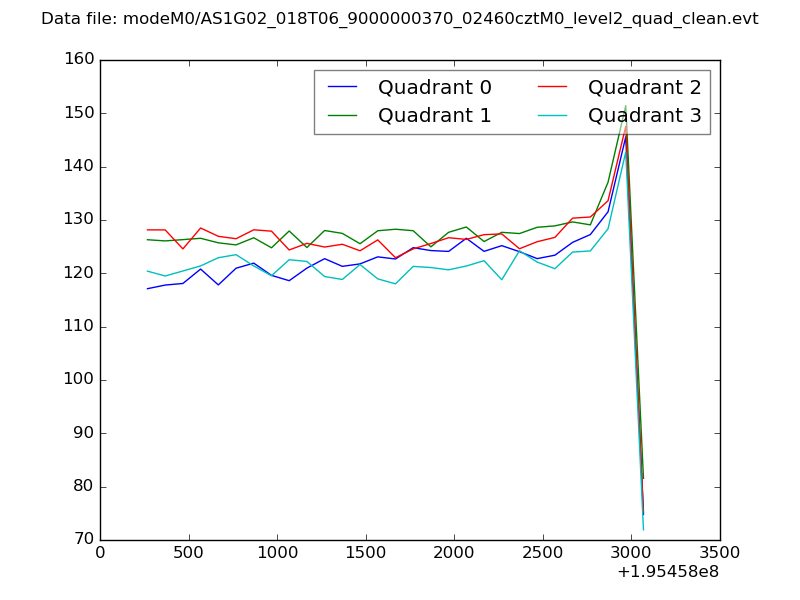 |
|
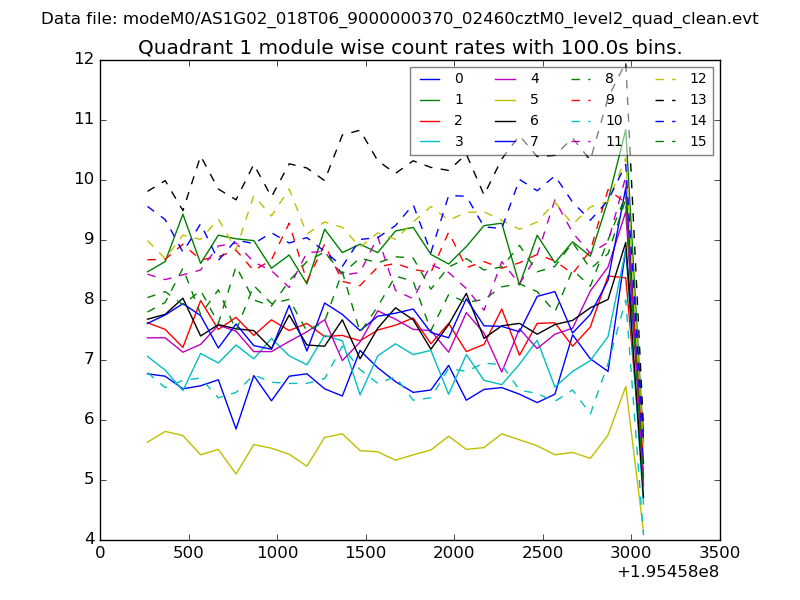
| Module-wise count rates for Quadrant A Data is divided into 100 sec bins |
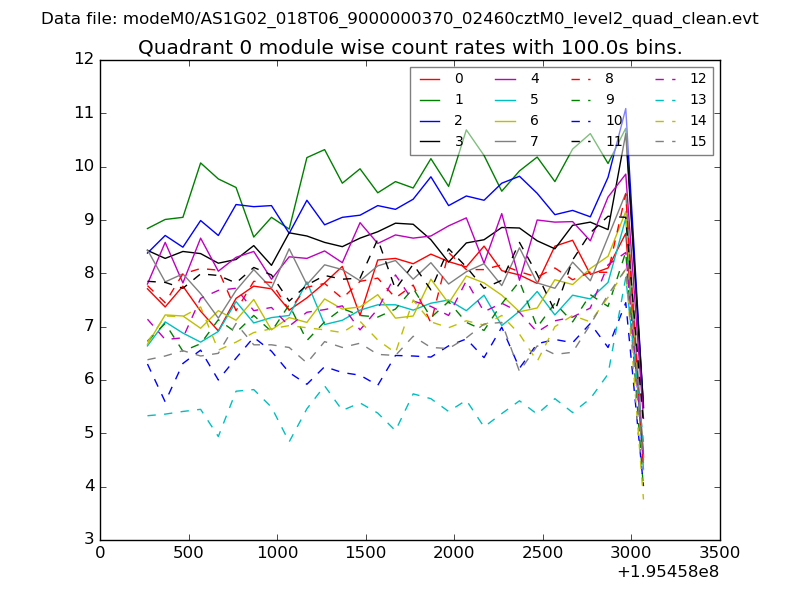 |
 |
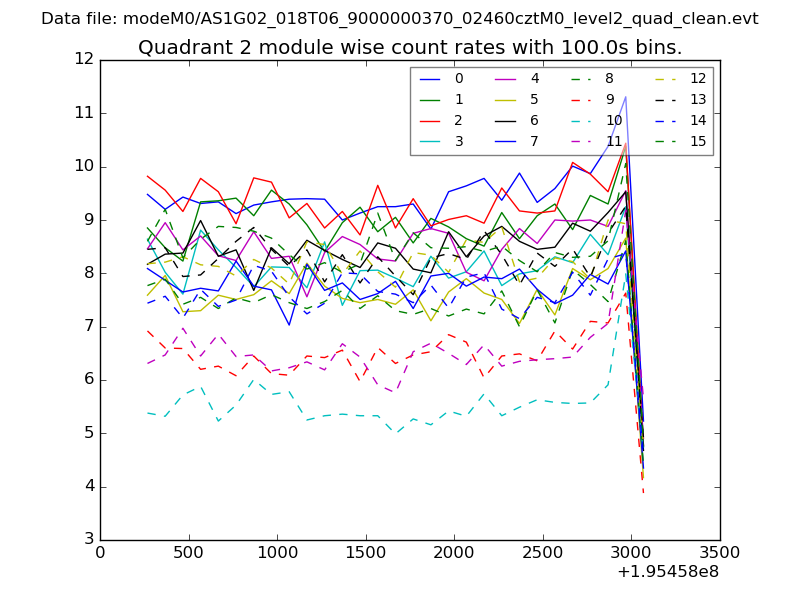
| Module-wise count rates for Quadrant B Data is divided into 100 sec bins |
 |
 |
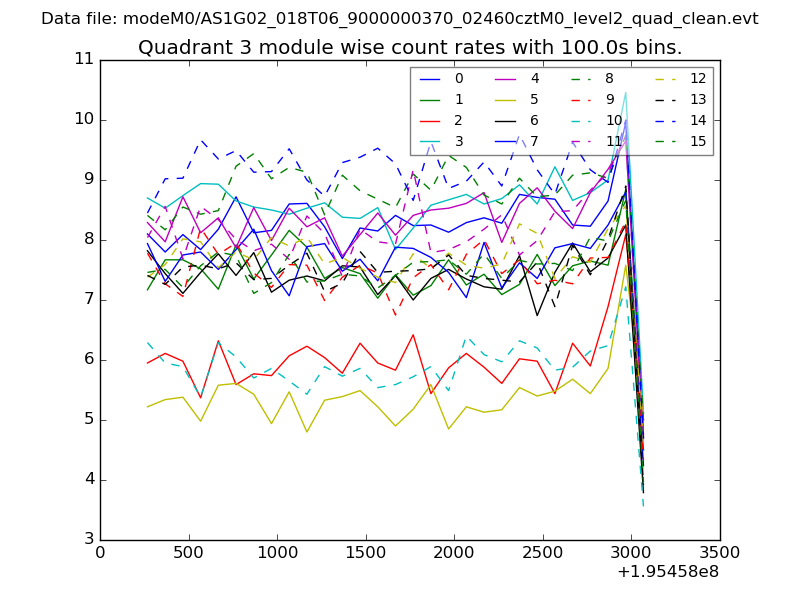
| Module-wise count rates for Quadrant C Data is divided into 100 sec bins |
 |
 |
| Module-wise count rates for Quadrant D Data is divided into 100 sec bins |
 |
 |
| Parameter | Plot |
|---|---|
| CZT HV Monitor | 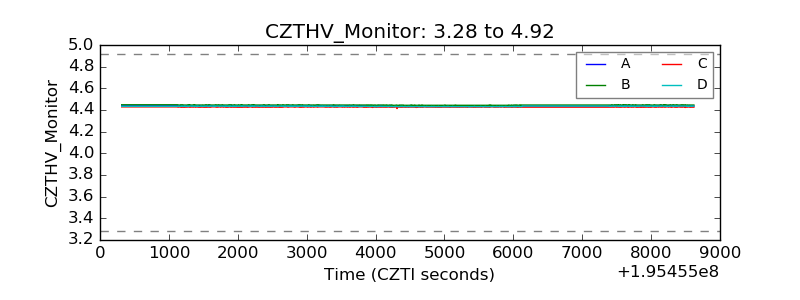 |
| D_VDD | 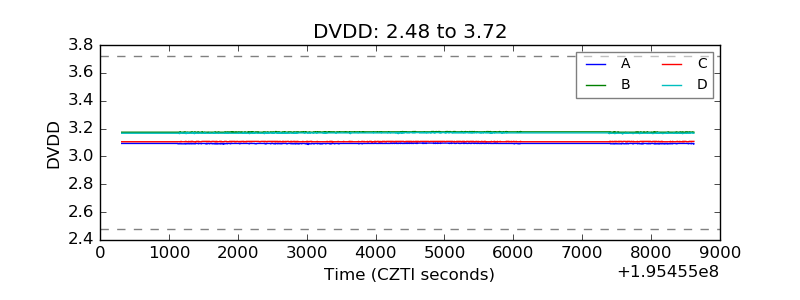 |
| Temperature 1 | 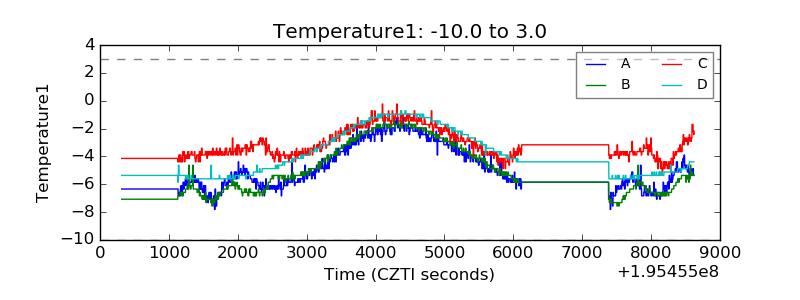 |
| Veto HV Monitor | 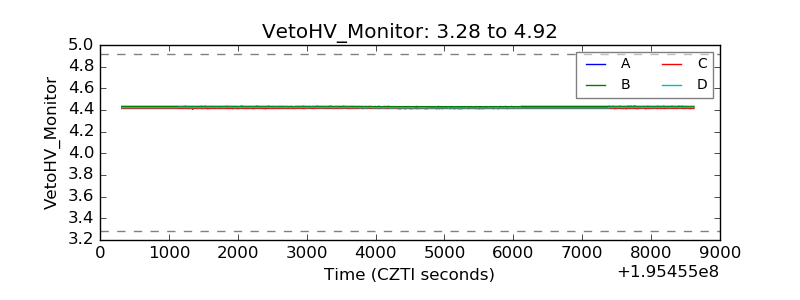 |
| Veto LLD | 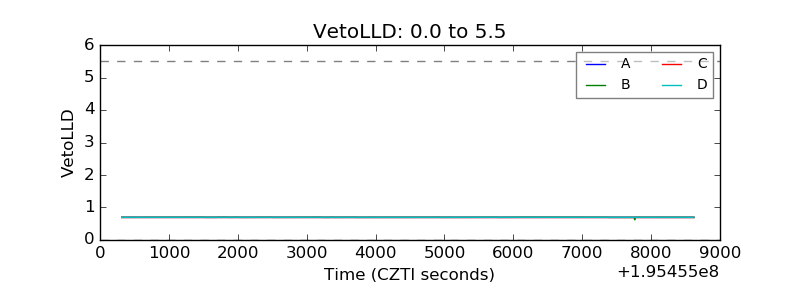 |
| Alpha Counter | 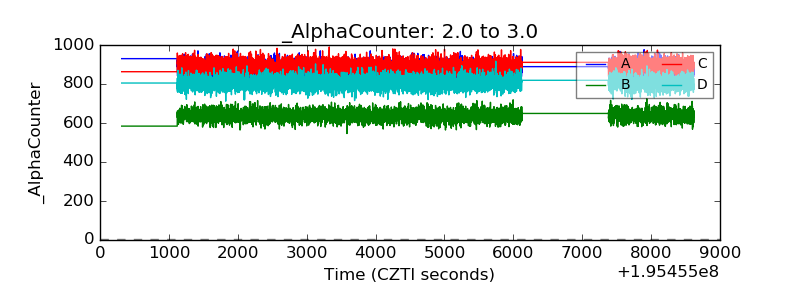 |
| _CPM_Rate | 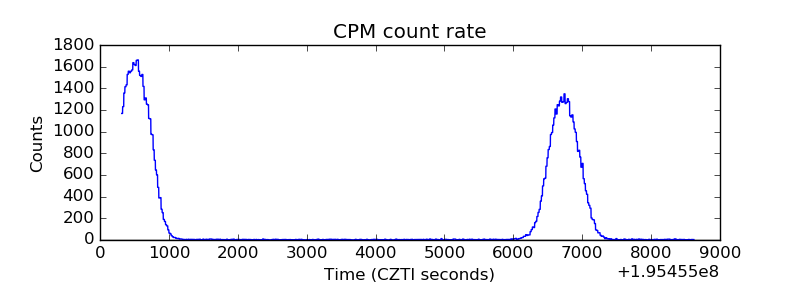 |
| CZT Counter | 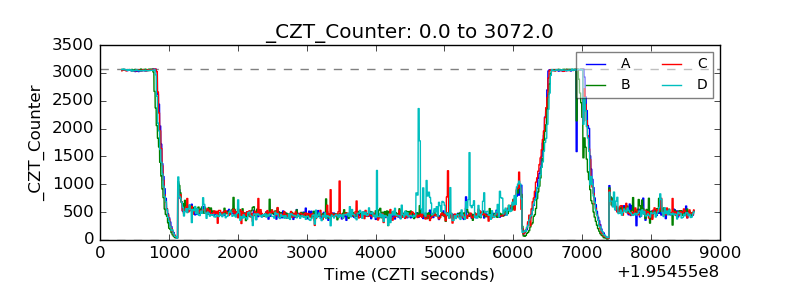 |
| +2.5 Volts monitor |  |
| +5 Volts monitor |  |
| _ROLL_ROT | 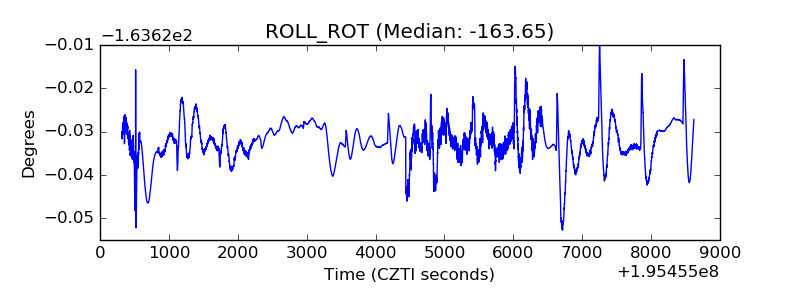 |
| _Roll_DEC | 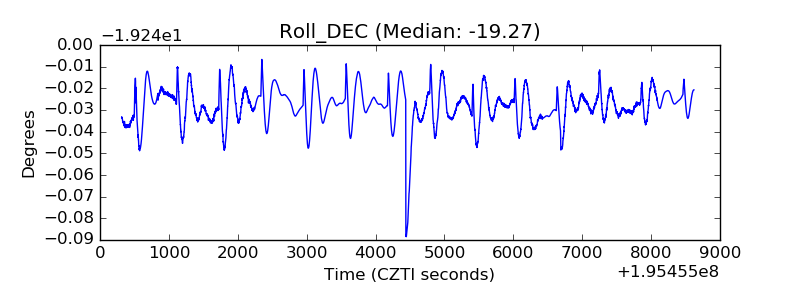 |
| _Roll_RA | 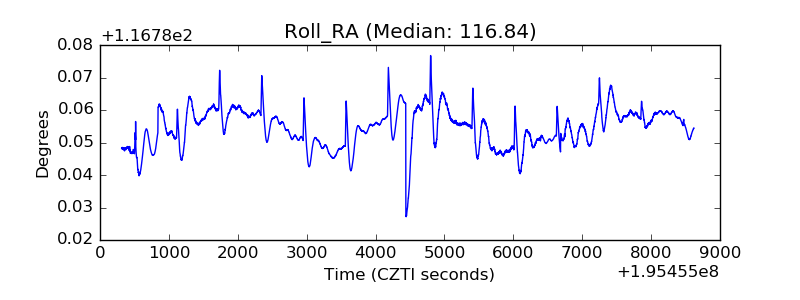 |
| Veto Counter | 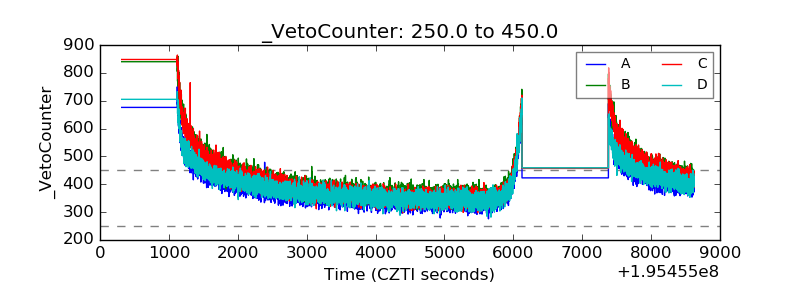 |