| Param | Original file | Final file |
|---|---|---|
| Filename | modeM0/AS1G02_018T06_9000000370_02461cztM0_level2.evt | modeM0/AS1G02_018T06_9000000370_02461cztM0_level2_quad_clean.evt |
| Size (bytes) | 424,411,200 | 68,284,800 |
| Size | 404.8 MB | 65.1 MB |
| Events in quadrant A | 3,045,316 | 402,516 |
| Events in quadrant B | 3,174,041 | 414,333 |
| Events in quadrant C | 3,019,167 | 413,336 |
| Events in quadrant D | 3,186,625 | 397,957 |
| Mode M9 | |||
|---|---|---|---|
| Quadrant | BADHDUFLAG | Total packets | Discarded packets |
| A | 0 | 16 | 0 |
| B | 0 | 16 | 0 |
| C | 0 | 16 | 0 |
| D | 0 | 17 | 0 |
| Mode SS | |||
|---|---|---|---|
| Quadrant | BADHDUFLAG | Total packets | Discarded packets |
| A | 0 | 130 | 0 |
| B | 0 | 130 | 0 |
| C | 0 | 130 | 0 |
| D | 0 | 130 | 0 |
| Mode M0 | |||
|---|---|---|---|
| Quadrant | BADHDUFLAG | Total packets | Discarded packets |
| A | 0 | 13026 | 3 |
| B | 0 | 13312 | 2 |
| C | 0 | 13032 | 2 |
| D | 0 | 13702 | 2 |
| Quadrant | Total seconds | Saturated seconds | Saturation percentage |
|---|---|---|---|
| A | 6287 | 72 | 1.145220% |
| B | 6287 | 92 | 1.463337% |
| C | 6287 | 64 | 1.017974% |
| D | 6287 | 67 | 1.065691% |
Noise dominated data is calculated using 1-second bins in cleaned event files. If a bin has >2000 counts, and if more than 50% of those come from <1% of pixels, then it is considered to be noise-dominated and hence unusable.
| Quadrant | # 1 sec bins | Bins with >0 counts | Bins with >2000 counts | High rate bins dominated by noise | Noise dominated (total time) | Noise dominated (detector-on time) | Marked lightcurve |
|---|---|---|---|---|---|---|---|
| A | 7552 | 6288 | 0 | 0 | 0.00% | 0.00% | 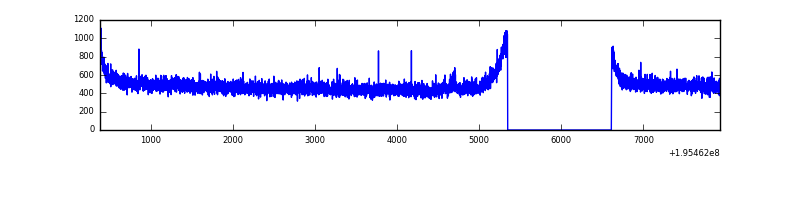 |
| B | 7552 | 6288 | 14 | 14 | 0.19% | 0.22% | 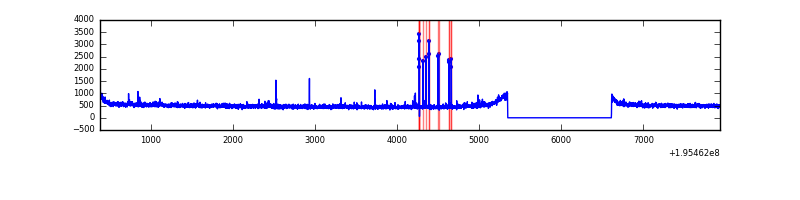 |
| C | 7552 | 6288 | 0 | 0 | 0.00% | 0.00% | 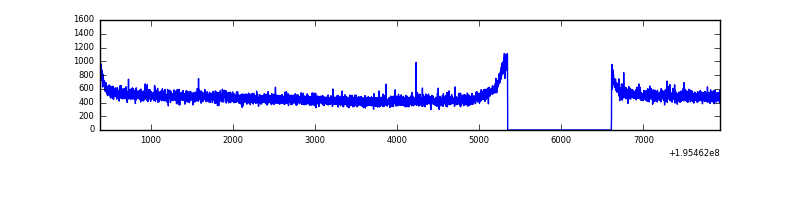 |
| D | 7552 | 6288 | 9 | 9 | 0.12% | 0.14% | 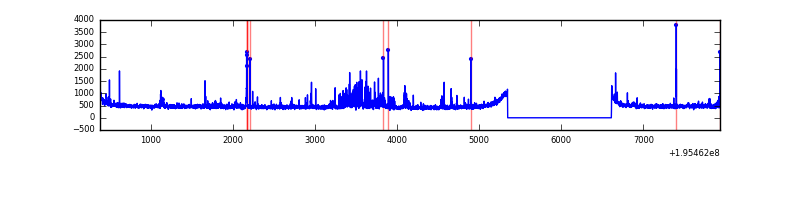 |
Top three noisy pixels from each quadrant. If the there are fewer than three noisy pixels in the level2.evt file, extra rows are filled as -1
| Pixel properties | Quadrant properties | ||||||
|---|---|---|---|---|---|---|---|
| Quadrant | DetID | PixID | Counts | Sigma | Mean | Median | Sigma |
| A | 0 | 226 | 9147 | 52.6 | 784 | 769 | 159.3 |
| A | 12 | 194 | 8820 | 50.55 | 784 | 769 | 159.3 |
| A | 0 | 149 | 8099 | 46.02 | 784 | 769 | 159.3 |
| B | 5 | 172 | 50603 | 329.18 | 798 | 778 | 151.4 |
| B | 0 | 191 | 16100 | 101.22 | 798 | 778 | 151.4 |
| B | 4 | 200 | 15779 | 99.1 | 798 | 778 | 151.4 |
| C | 13 | 61 | 7141 | 35.77 | 768 | 773 | 178.0 |
| C | 12 | 4 | 6494 | 32.13 | 768 | 773 | 178.0 |
| C | 9 | 191 | 5275 | 25.29 | 768 | 773 | 178.0 |
| D | 7 | 67 | 180601 | 1001.75 | 759 | 741 | 179.5 |
| D | 9 | 64 | 37814 | 206.48 | 759 | 741 | 179.5 |
| D | 2 | 184 | 17233 | 91.85 | 759 | 741 | 179.5 |
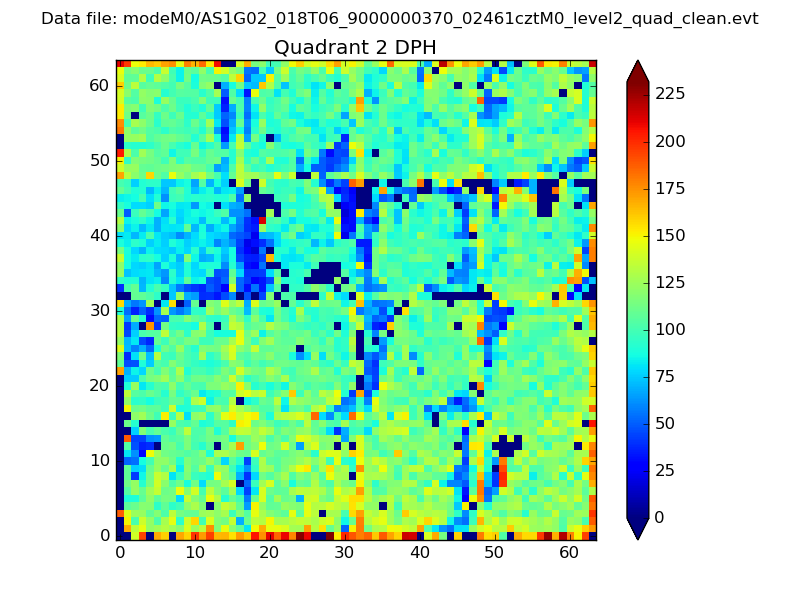
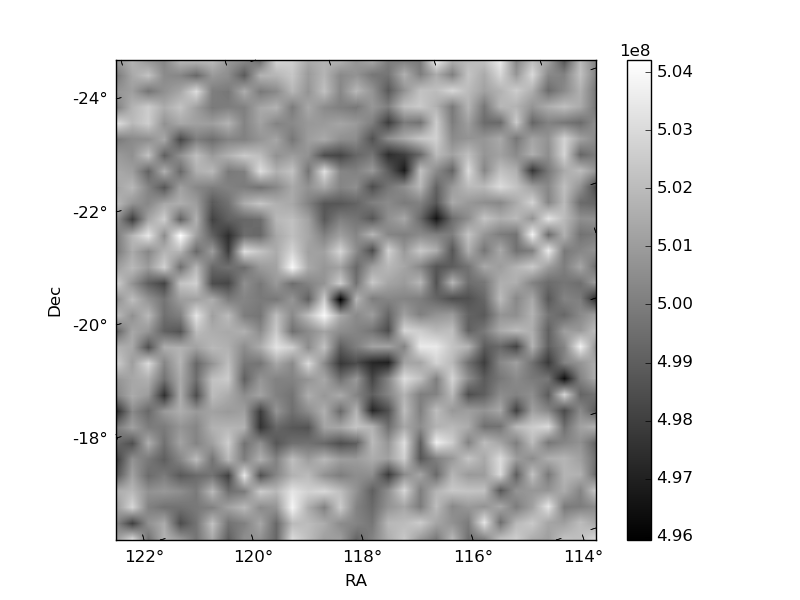
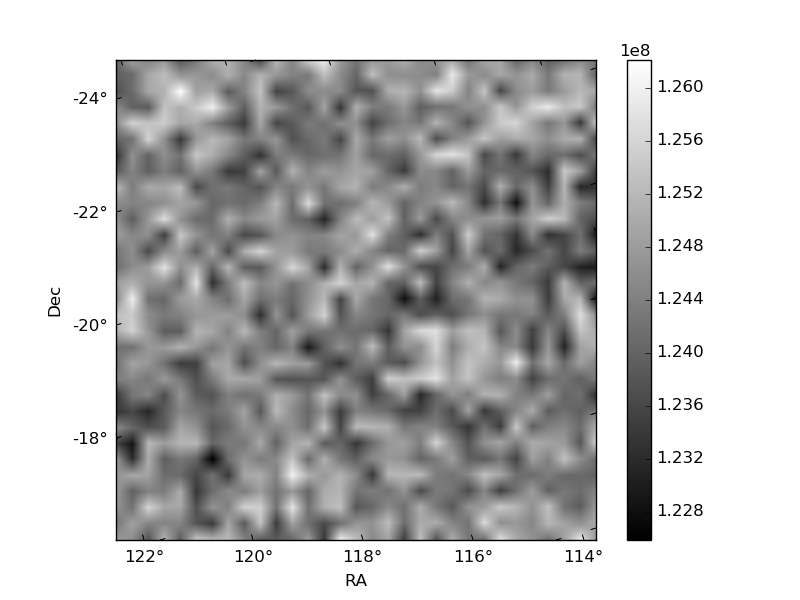
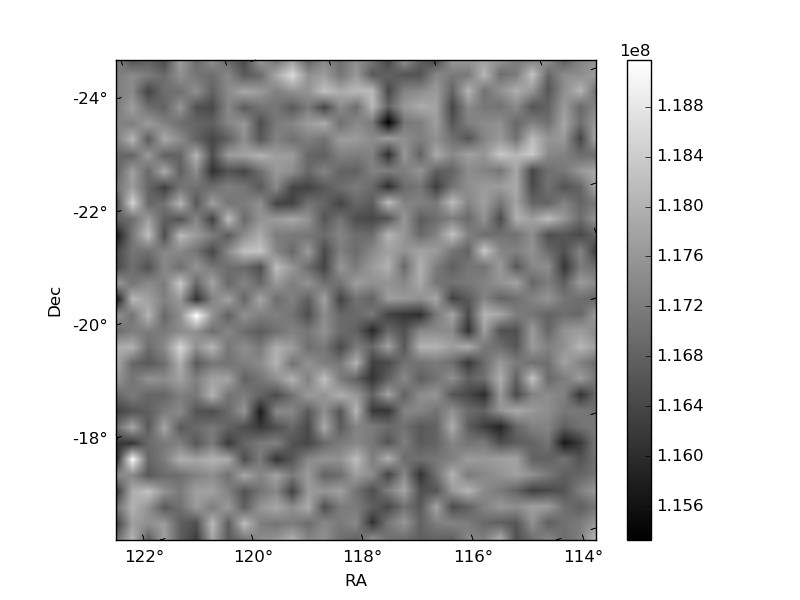
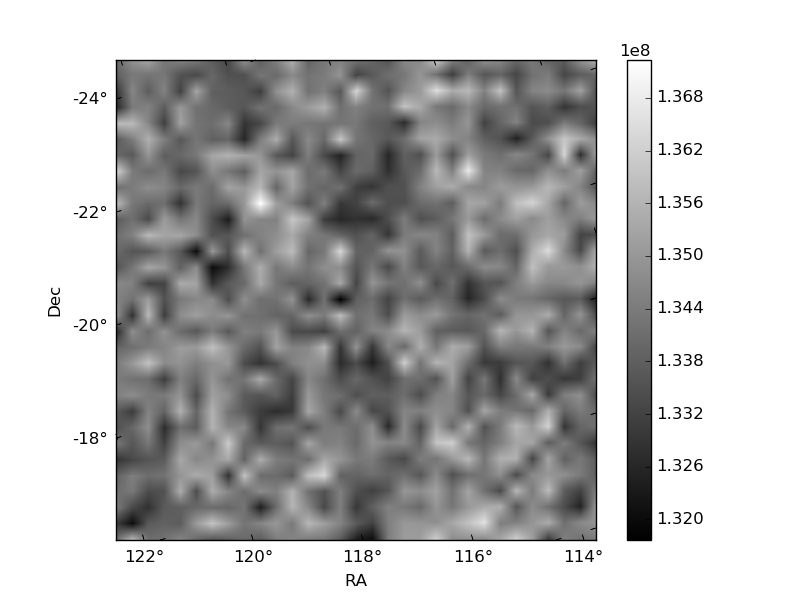
Histogram calculated using DETX and DETY for each event in the final _common_clean file
| Quadrant A | 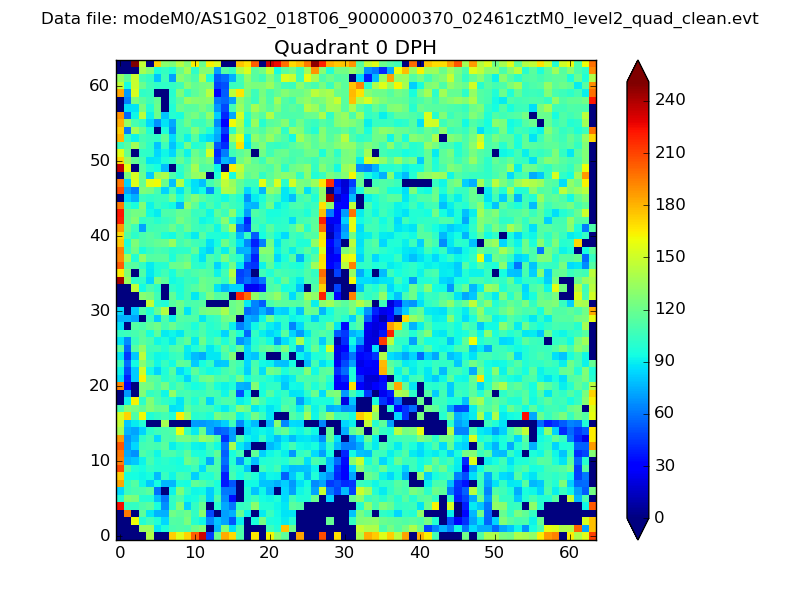 |
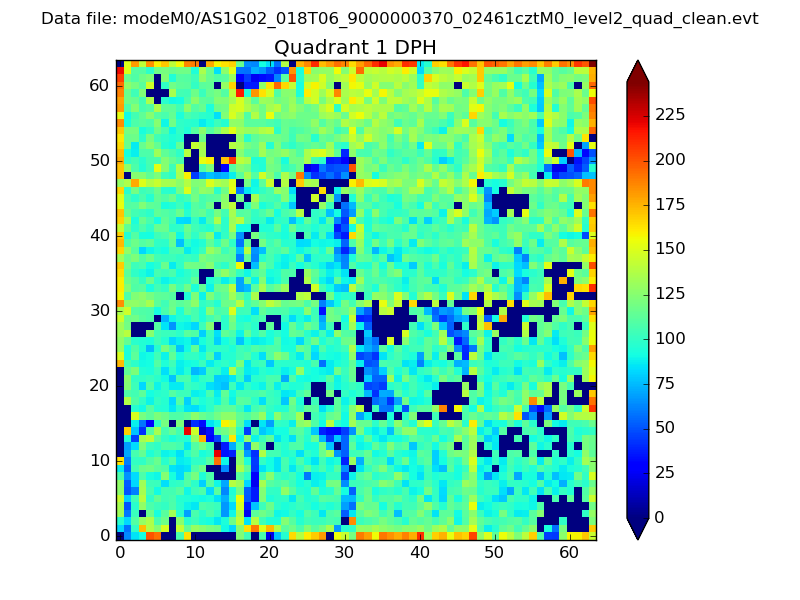 |
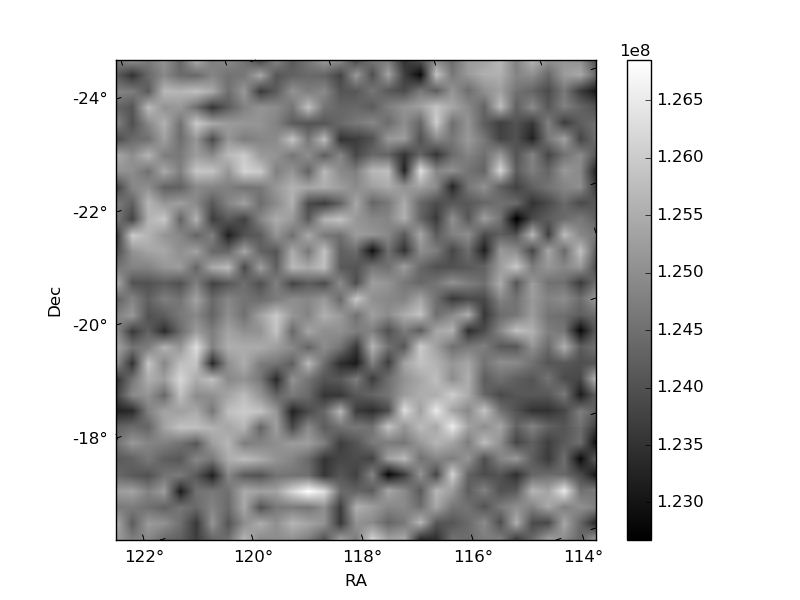
Quadrant B |
|---|---|---|---|
| Quadrant D | 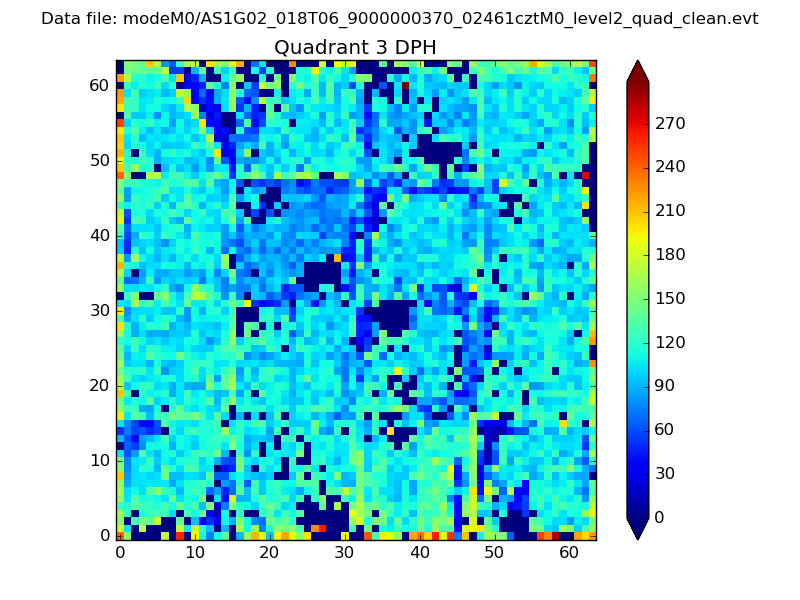 |
 |
Quadrant C |
| Plot type | Count rate plots | Images |
|---|---|---|
| Comparison with Poisson distribution Blue bars denote a histogram of data divided into 1 sec bins. Red curve is a Poisson curve with rate = median count rate of data. |
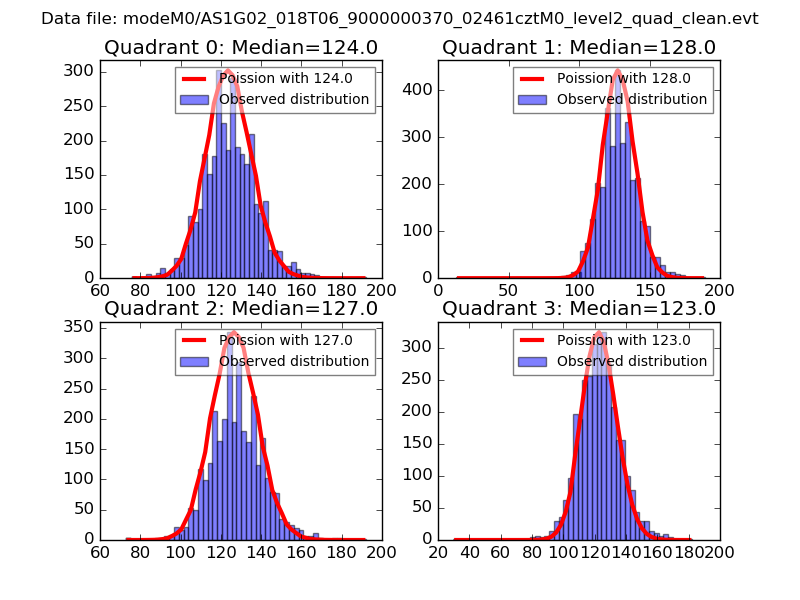 |
 |
| Quadrant-wise count rates Data is divided into 100 sec bins |
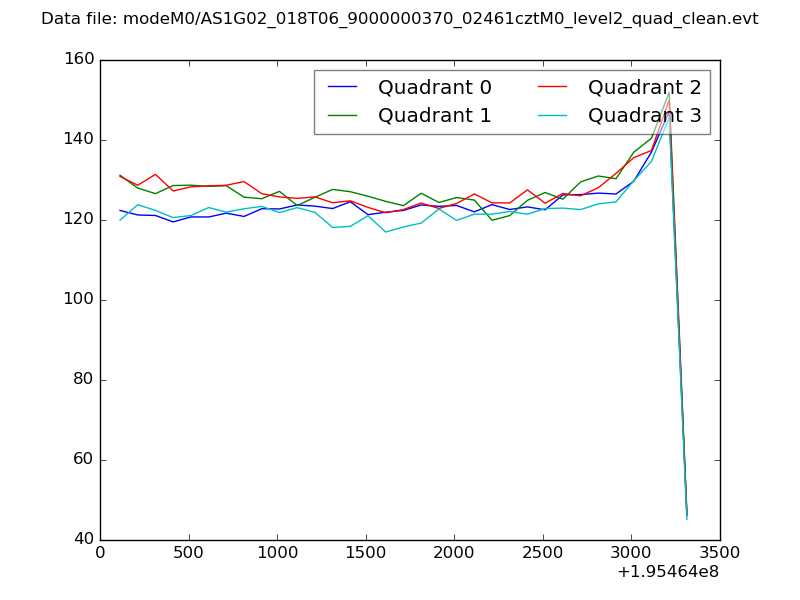 |
|
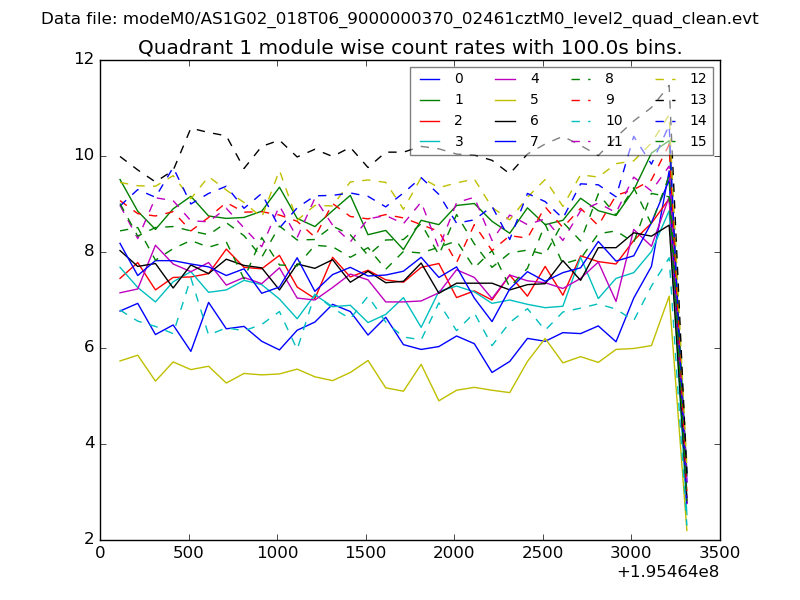
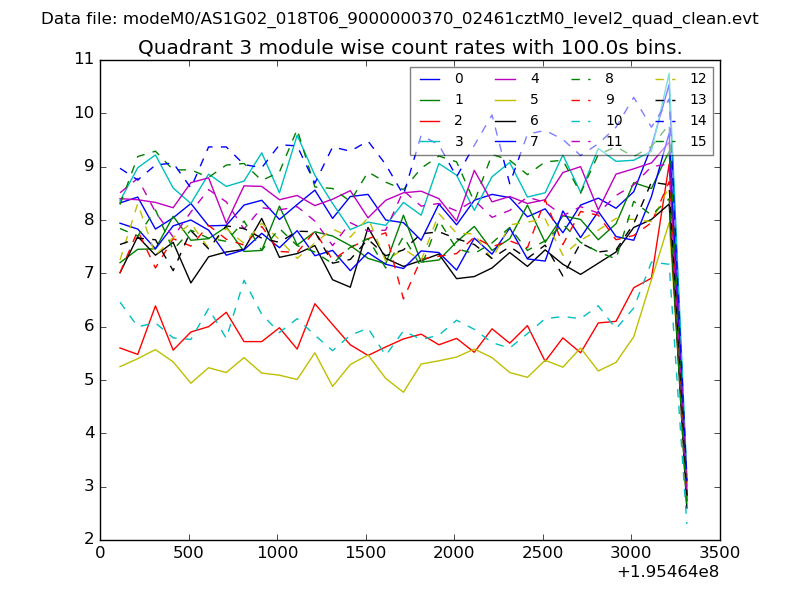
| Module-wise count rates for Quadrant A Data is divided into 100 sec bins |
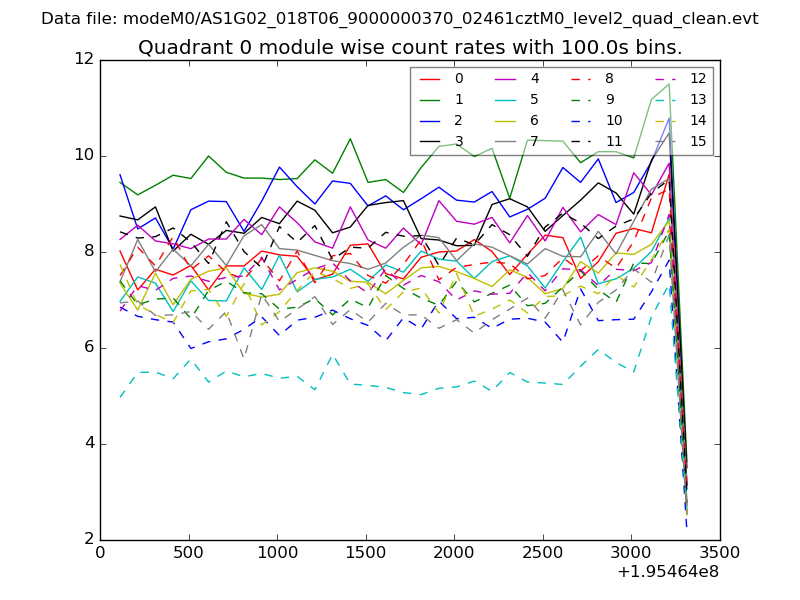 |
 |
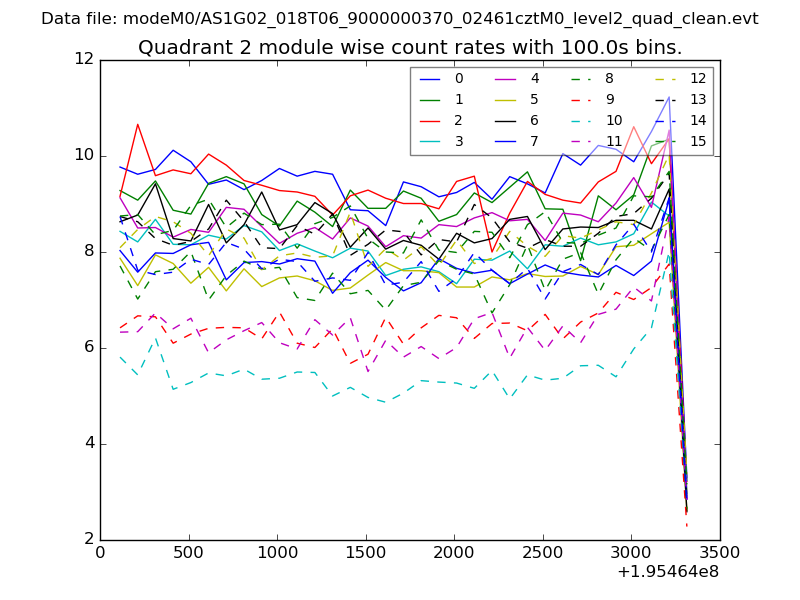
| Module-wise count rates for Quadrant B Data is divided into 100 sec bins |
 |
 |
| Module-wise count rates for Quadrant C Data is divided into 100 sec bins |
 |
 |
| Module-wise count rates for Quadrant D Data is divided into 100 sec bins |
 |
 |
| Parameter | Plot |
|---|---|
| CZT HV Monitor | 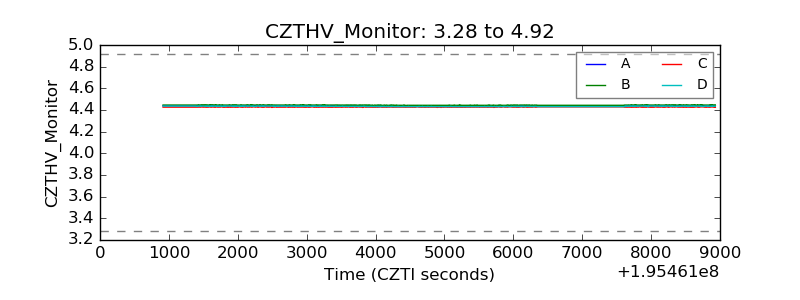 |
| D_VDD | 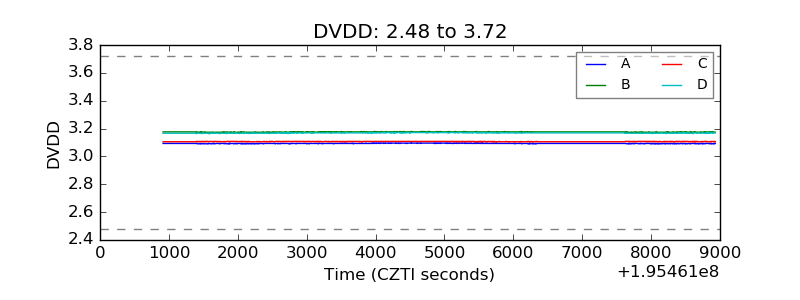 |
| Temperature 1 | 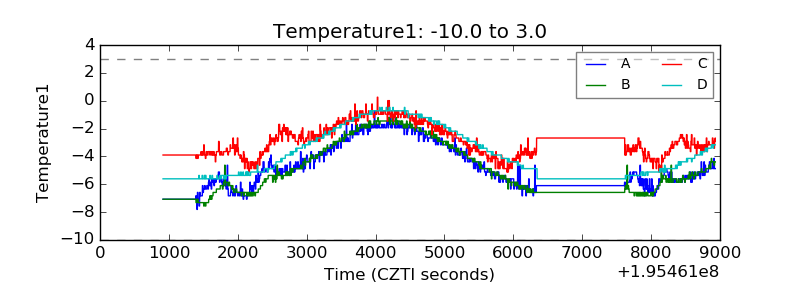 |
| Veto HV Monitor | 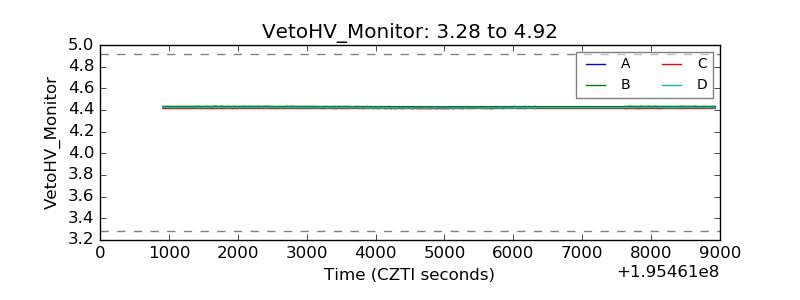 |
| Veto LLD | 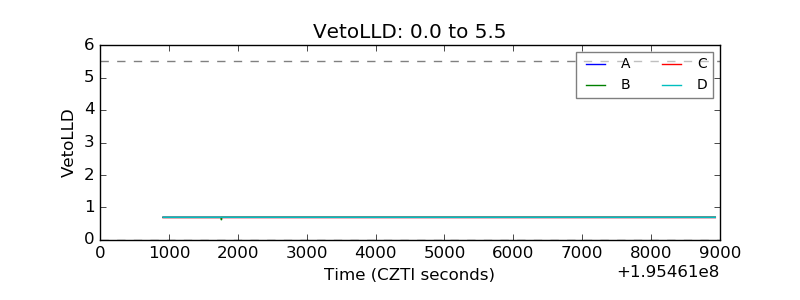 |
| Alpha Counter | 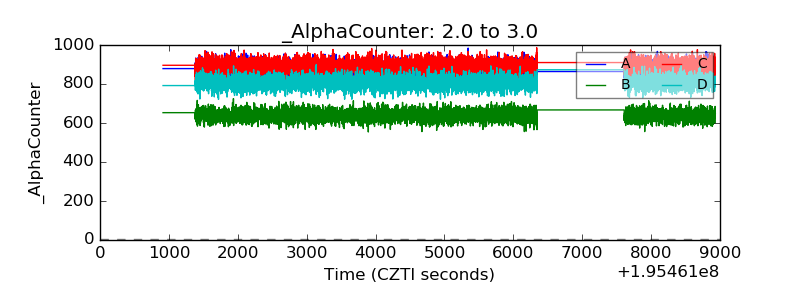 |
| _CPM_Rate | 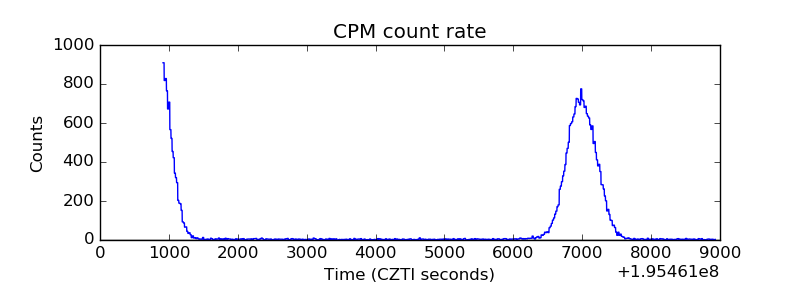 |
| CZT Counter | 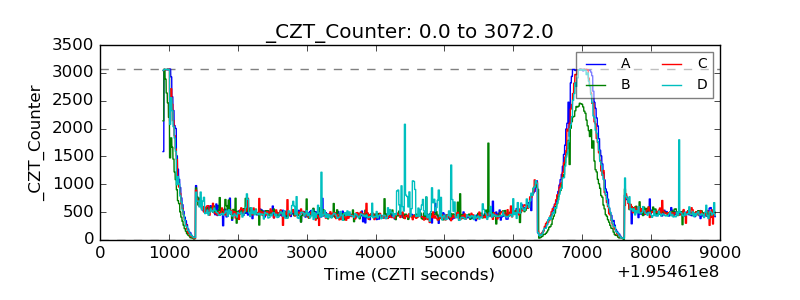 |
| +2.5 Volts monitor | 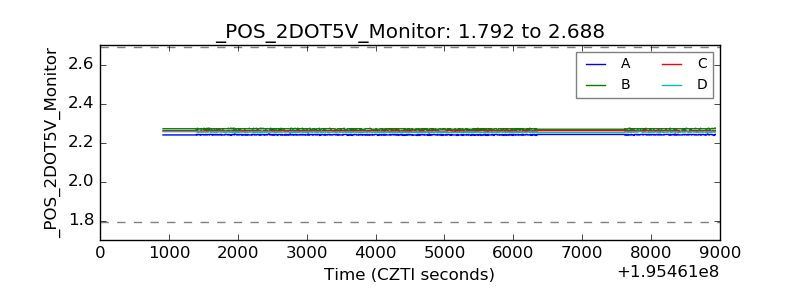 |
| +5 Volts monitor | 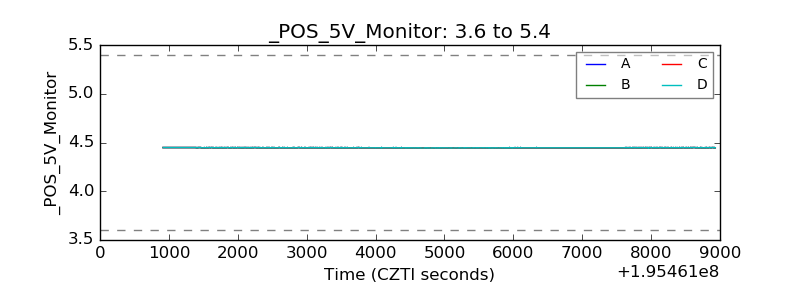 |
| _ROLL_ROT | 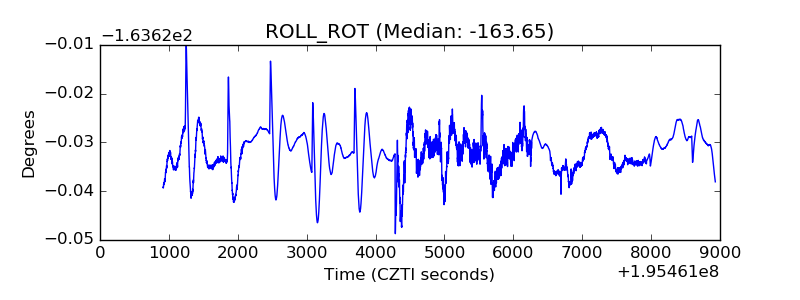 |
| _Roll_DEC | 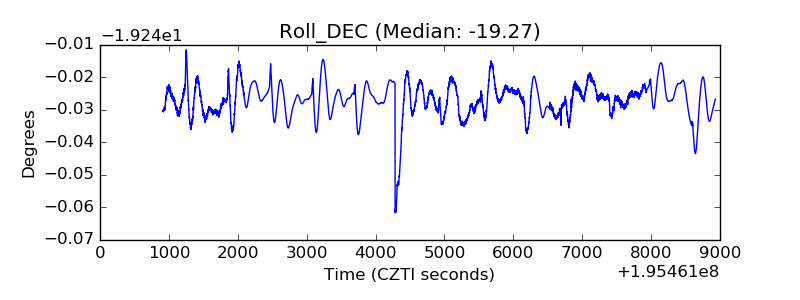 |
| _Roll_RA | 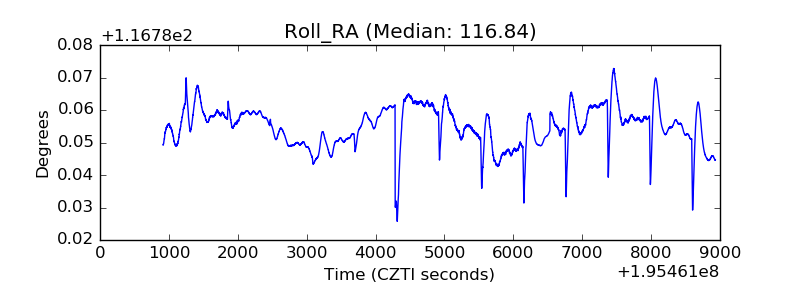 |
| Veto Counter | 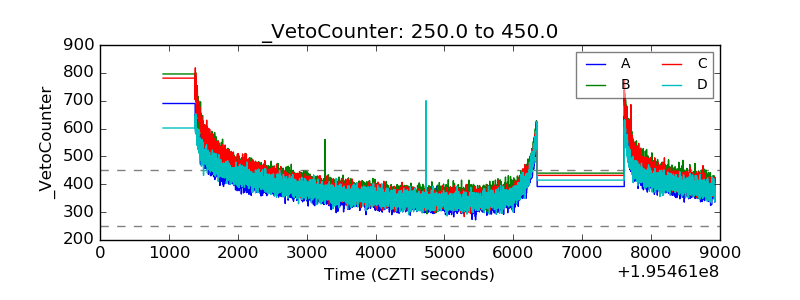 |