| Param | Original file | Final file |
|---|---|---|
| Filename | modeM0/AS1G02_018T06_9000000370_02463cztM0_level2.evt | modeM0/AS1G02_018T06_9000000370_02463cztM0_level2_quad_clean.evt |
| Size (bytes) | 174,222,720 | 19,929,600 |
| Size | 166.2 MB | 19.0 MB |
| Events in quadrant A | 1,196,711 | 105,193 |
| Events in quadrant B | 1,231,439 | 110,793 |
| Events in quadrant C | 1,461,596 | 109,474 |
| Events in quadrant D | 1,222,822 | 106,236 |
| Mode M9 | |||
|---|---|---|---|
| Quadrant | BADHDUFLAG | Total packets | Discarded packets |
| A | 0 | 8 | 0 |
| B | 0 | 8 | 0 |
| C | 0 | 8 | 0 |
| D | 0 | 8 | 0 |
| Mode SS | |||
|---|---|---|---|
| Quadrant | BADHDUFLAG | Total packets | Discarded packets |
| A | 0 | 50 | 0 |
| B | 0 | 50 | 0 |
| C | 0 | 50 | 0 |
| D | 0 | 50 | 0 |
| Mode M0 | |||
|---|---|---|---|
| Quadrant | BADHDUFLAG | Total packets | Discarded packets |
| A | 0 | 5062 | 2 |
| B | 0 | 5125 | 1 |
| C | 0 | 5837 | 1 |
| D | 0 | 5216 | 1 |
| Quadrant | Total seconds | Saturated seconds | Saturation percentage |
|---|---|---|---|
| A | 2373 | 118 | 4.972609% |
| B | 2373 | 111 | 4.677623% |
| C | 2373 | 118 | 4.972609% |
| D | 2373 | 87 | 3.666245% |
Noise dominated data is calculated using 1-second bins in cleaned event files. If a bin has >2000 counts, and if more than 50% of those come from <1% of pixels, then it is considered to be noise-dominated and hence unusable.
| Quadrant | # 1 sec bins | Bins with >0 counts | Bins with >2000 counts | High rate bins dominated by noise | Noise dominated (total time) | Noise dominated (detector-on time) | Marked lightcurve |
|---|---|---|---|---|---|---|---|
| A | 3164 | 2375 | 0 | 0 | 0.00% | 0.00% | 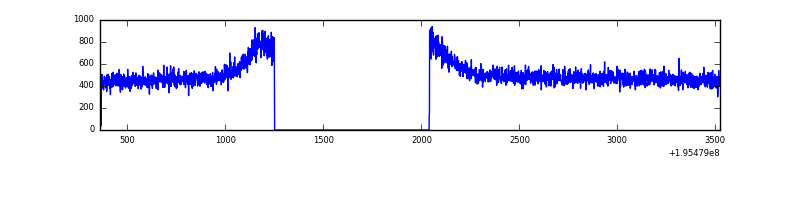 |
| B | 3164 | 2375 | 0 | 0 | 0.00% | 0.00% | 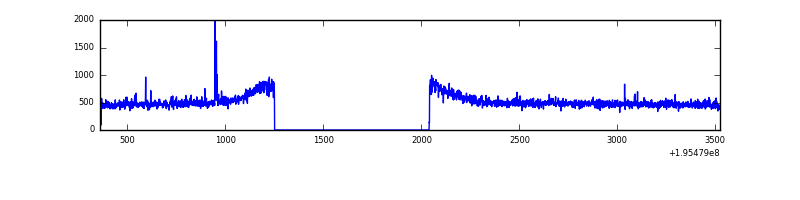 |
| C | 3164 | 2375 | 17 | 17 | 0.54% | 0.72% | 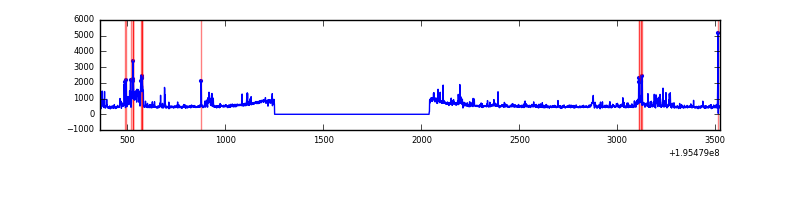 |
| D | 3164 | 2375 | 2 | 2 | 0.06% | 0.08% | 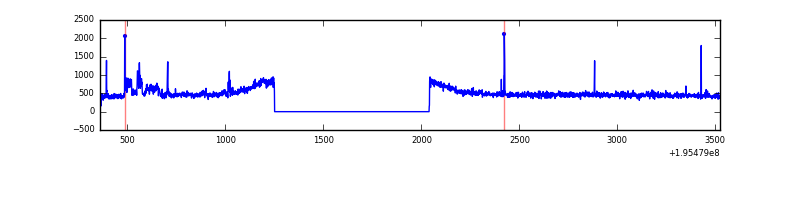 |
Top three noisy pixels from each quadrant. If the there are fewer than three noisy pixels in the level2.evt file, extra rows are filled as -1
| Pixel properties | Quadrant properties | ||||||
|---|---|---|---|---|---|---|---|
| Quadrant | DetID | PixID | Counts | Sigma | Mean | Median | Sigma |
| A | 12 | 194 | 3536 | 48.58 | 310 | 301 | 66.6 |
| A | 0 | 226 | 3241 | 44.15 | 310 | 301 | 66.6 |
| A | 14 | 63 | 1399 | 16.49 | 310 | 301 | 66.6 |
| B | 4 | 173 | 13031 | 201.3 | 314 | 305 | 63.2 |
| B | 12 | 111 | 4754 | 70.37 | 314 | 305 | 63.2 |
| B | 11 | 111 | 3914 | 57.09 | 314 | 305 | 63.2 |
| C | 7 | 220 | 135318 | 1878.14 | 302 | 302 | 71.9 |
| C | 14 | 223 | 124986 | 1734.41 | 302 | 302 | 71.9 |
| C | 8 | 112 | 7626 | 101.88 | 302 | 302 | 71.9 |
| D | 12 | 79 | 44975 | 607.59 | 302 | 293 | 73.5 |
| D | 7 | 67 | 6685 | 86.92 | 302 | 293 | 73.5 |
| D | 2 | 184 | 6668 | 86.69 | 302 | 293 | 73.5 |
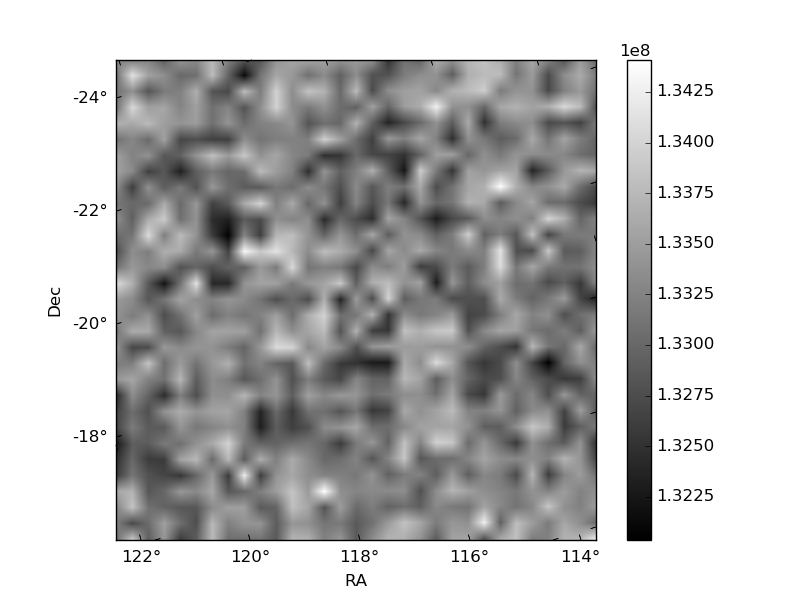
Histogram calculated using DETX and DETY for each event in the final _common_clean file
| Quadrant A | 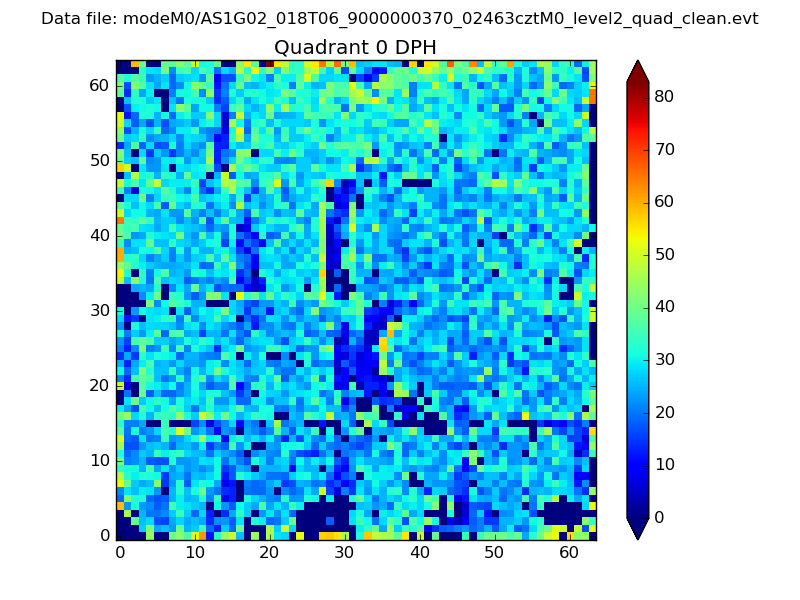 |
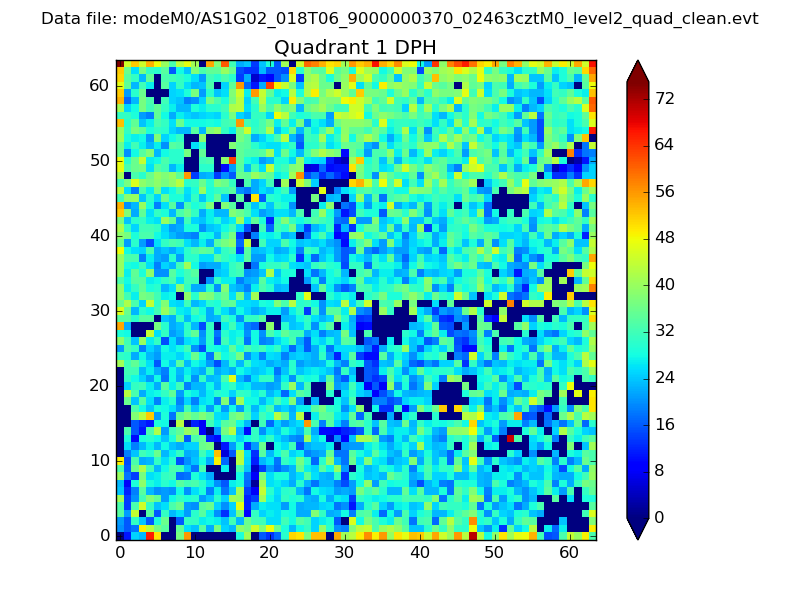 |
Quadrant B |
|---|---|---|---|
| Quadrant D | 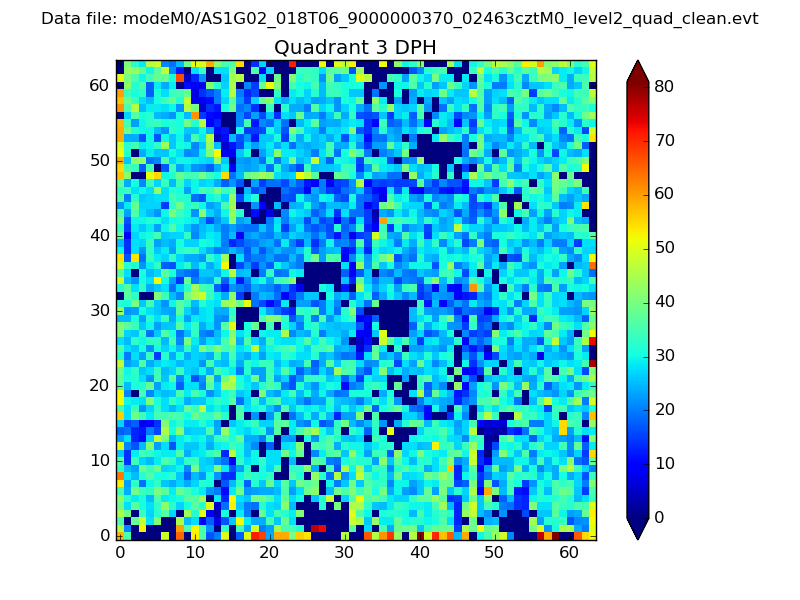 |
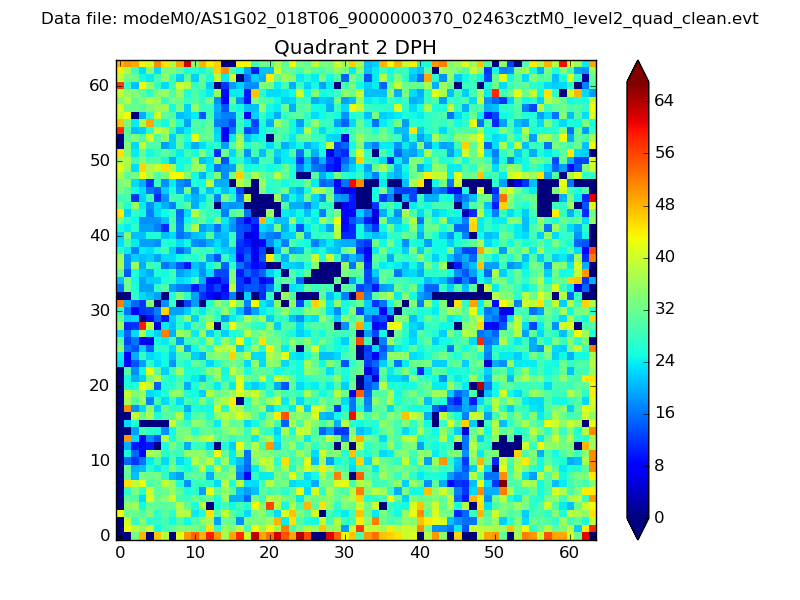 |
Quadrant C |
| Plot type | Count rate plots | Images |
|---|---|---|
| Comparison with Poisson distribution Blue bars denote a histogram of data divided into 1 sec bins. Red curve is a Poisson curve with rate = median count rate of data. |
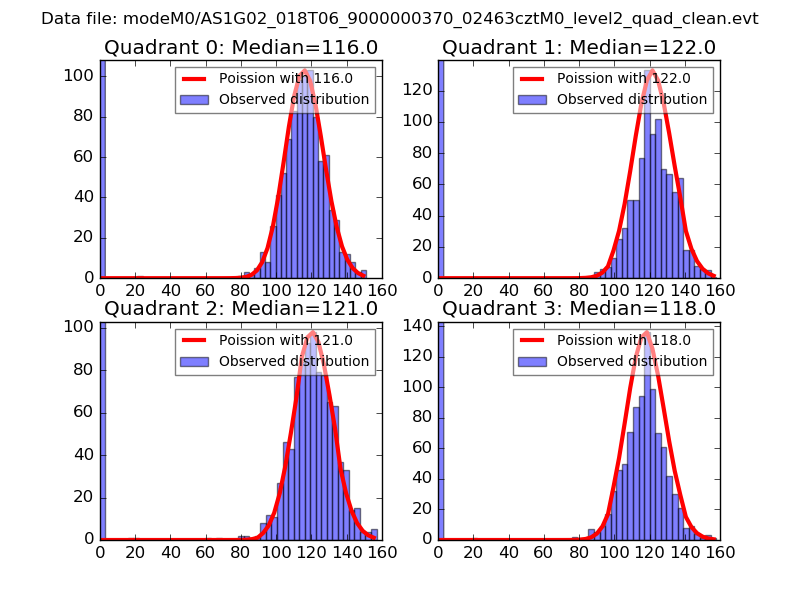 |
 |
| Quadrant-wise count rates Data is divided into 100 sec bins |
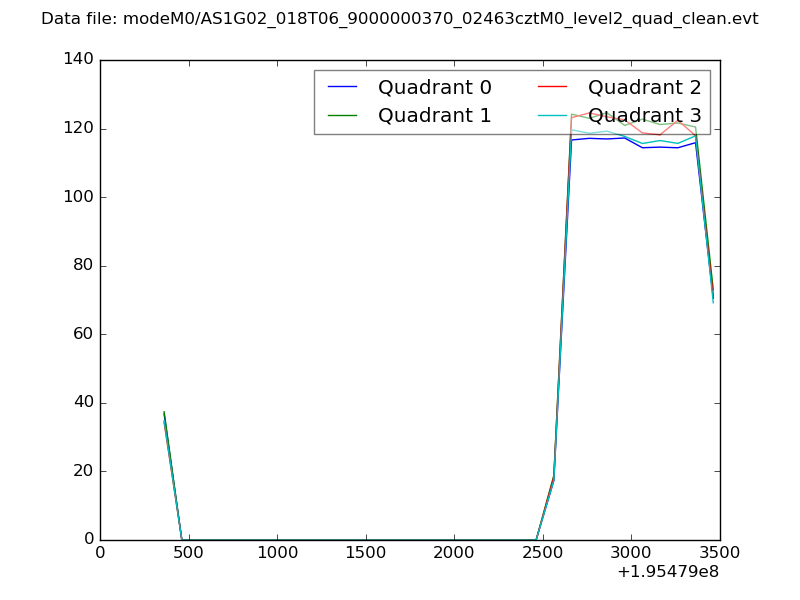 |
|
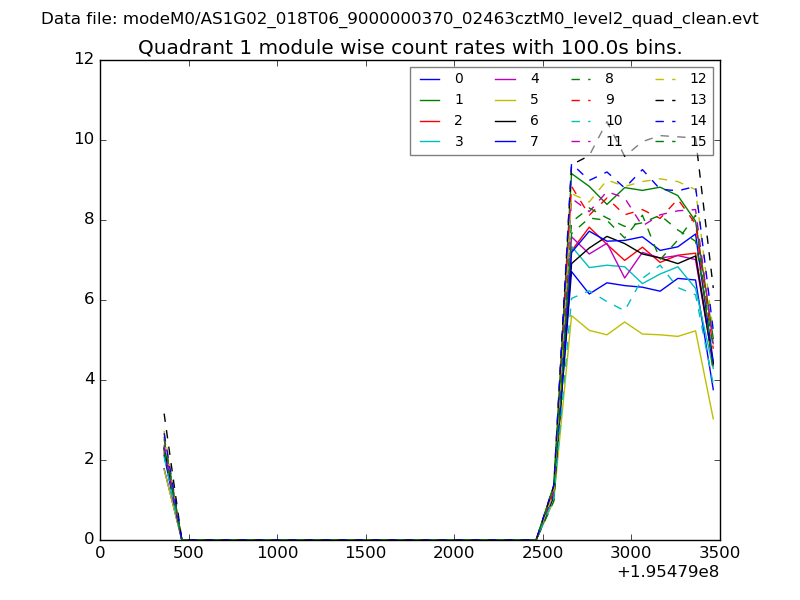
| Module-wise count rates for Quadrant A Data is divided into 100 sec bins |
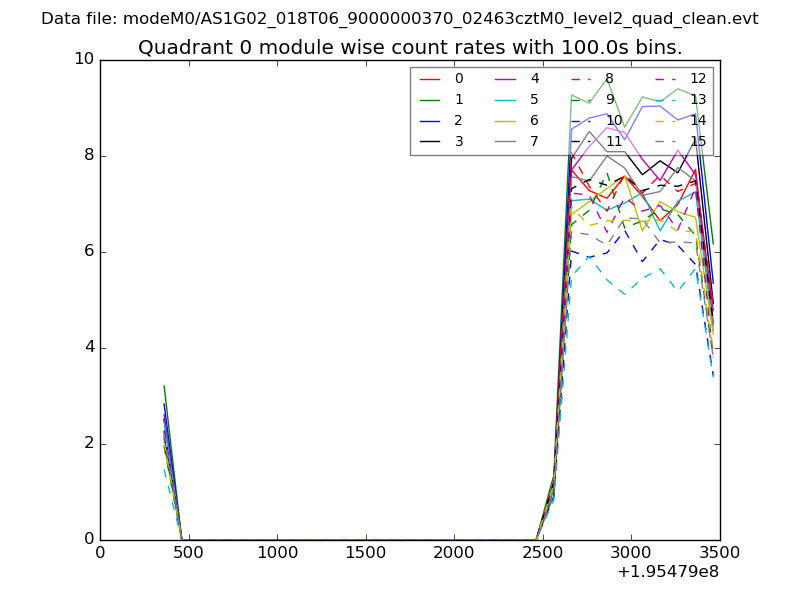 |
 |
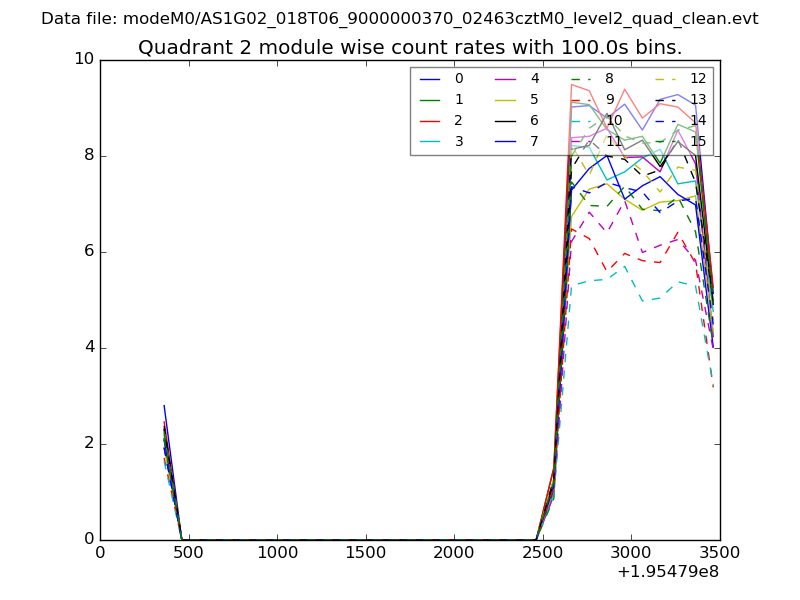
| Module-wise count rates for Quadrant B Data is divided into 100 sec bins |
 |
 |
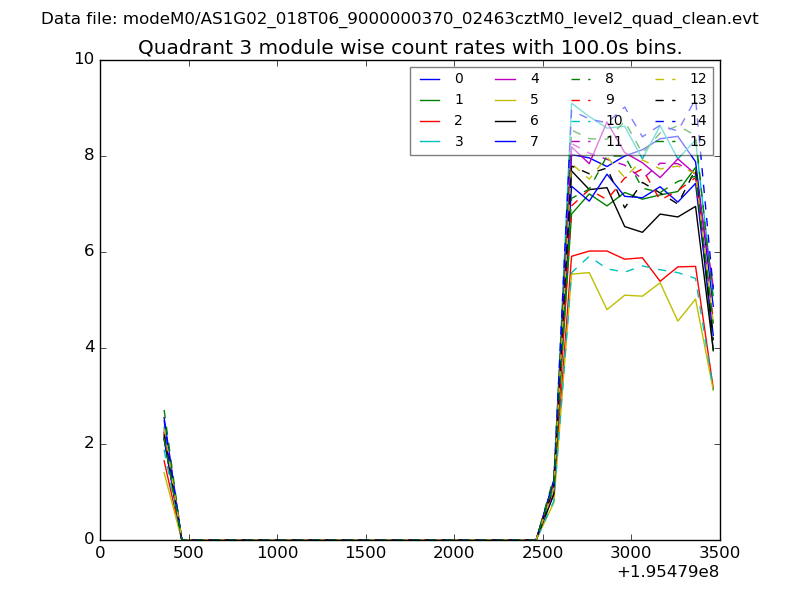
| Module-wise count rates for Quadrant C Data is divided into 100 sec bins |
 |
 |
| Module-wise count rates for Quadrant D Data is divided into 100 sec bins |
 |
 |
| Parameter | Plot |
|---|---|
| CZT HV Monitor | 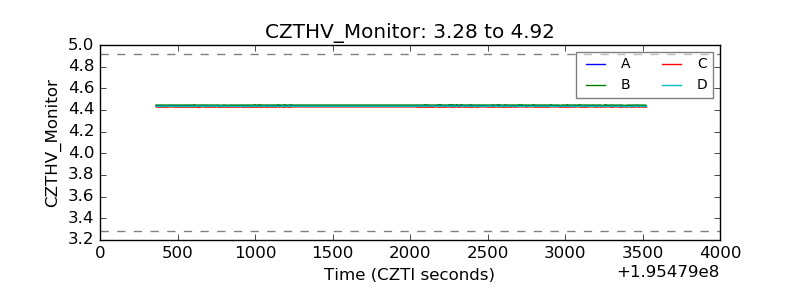 |
| D_VDD | 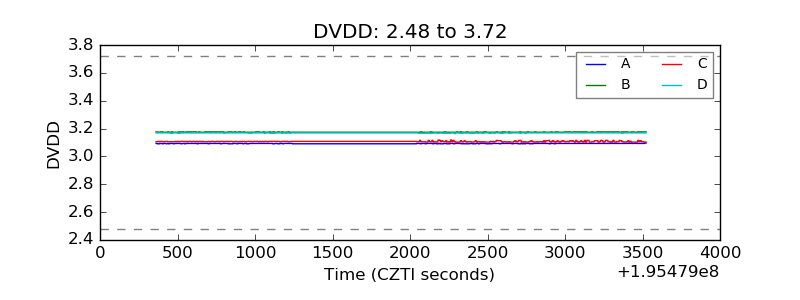 |
| Temperature 1 | 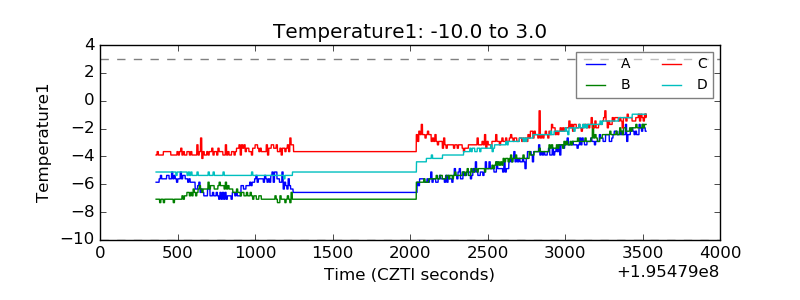 |
| Veto HV Monitor | 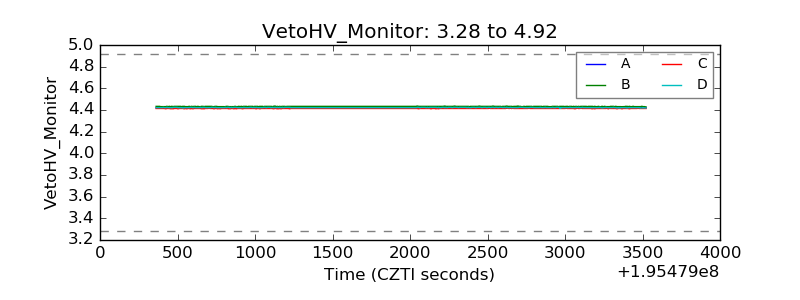 |
| Veto LLD | 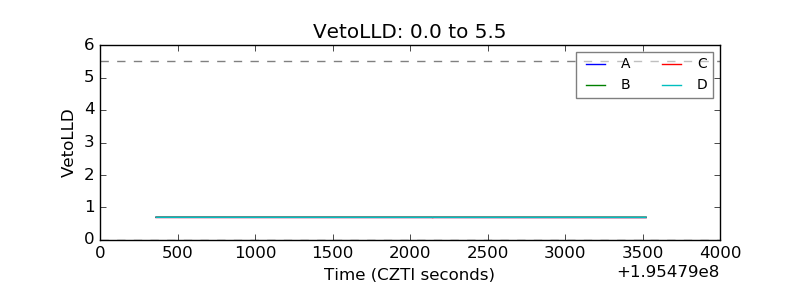 |
| Alpha Counter | 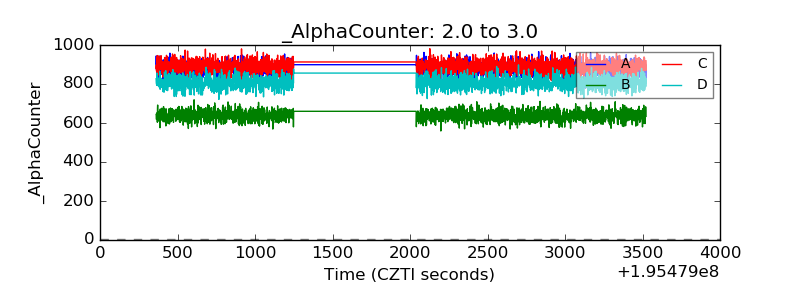 |
| _CPM_Rate | 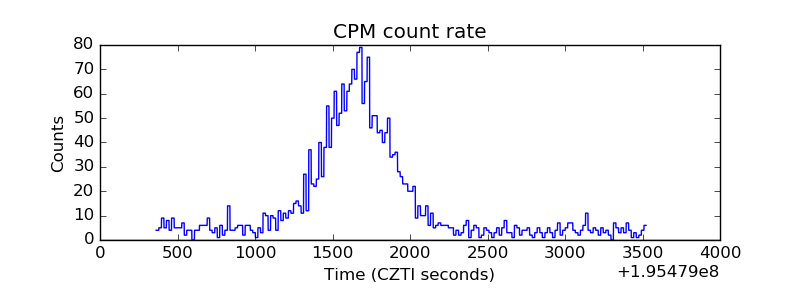 |
| CZT Counter | 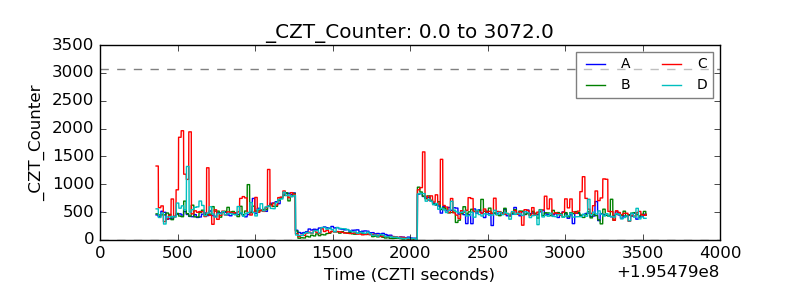 |
| +2.5 Volts monitor |  |
| +5 Volts monitor |  |
| _ROLL_ROT | 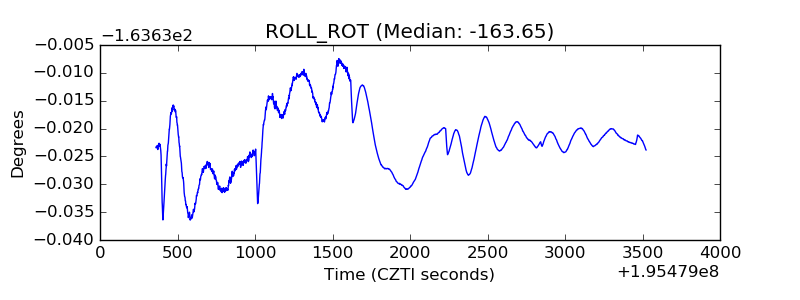 |
| _Roll_DEC | 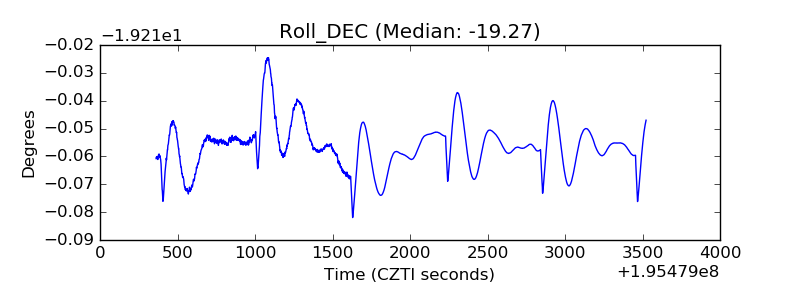 |
| _Roll_RA | 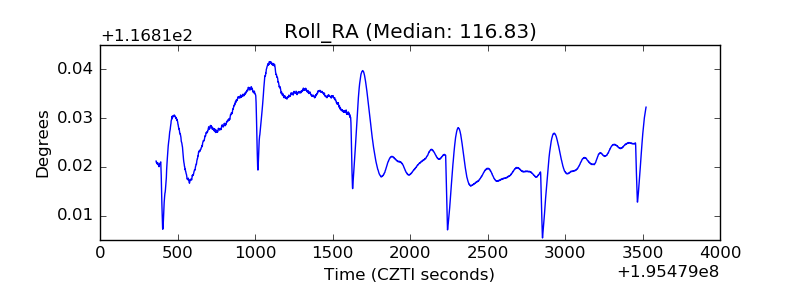 |
| Veto Counter | 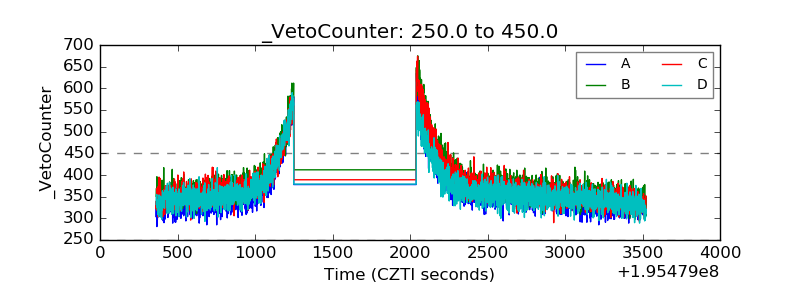 |