| Param | Original file | Final file |
|---|---|---|
| Filename | modeM0/AS1G02_018T06_9000000370_02465cztM0_level2.evt | modeM0/AS1G02_018T06_9000000370_02465cztM0_level2_quad_clean.evt |
| Size (bytes) | 468,069,120 | 94,181,760 |
| Size | 446.4 MB | 89.8 MB |
| Events in quadrant A | 3,346,389 | 578,914 |
| Events in quadrant B | 3,468,152 | 597,754 |
| Events in quadrant C | 3,363,624 | 593,398 |
| Events in quadrant D | 3,499,954 | 572,839 |
| Mode SS | |||
|---|---|---|---|
| Quadrant | BADHDUFLAG | Total packets | Discarded packets |
| A | 0 | 146 | 0 |
| B | 0 | 146 | 0 |
| C | 0 | 146 | 0 |
| D | 0 | 146 | 0 |
| Mode M0 | |||
|---|---|---|---|
| Quadrant | BADHDUFLAG | Total packets | Discarded packets |
| A | 0 | 15175 | 2 |
| B | 0 | 15343 | 1 |
| C | 0 | 15261 | 1 |
| D | 0 | 15811 | 1 |
| Quadrant | Total seconds | Saturated seconds | Saturation percentage |
|---|---|---|---|
| A | 7317 | 74 | 1.011343% |
| B | 7317 | 88 | 1.202679% |
| C | 7317 | 35 | 0.478338% |
| D | 7317 | 54 | 0.738007% |
Noise dominated data is calculated using 1-second bins in cleaned event files. If a bin has >2000 counts, and if more than 50% of those come from <1% of pixels, then it is considered to be noise-dominated and hence unusable.
| Quadrant | # 1 sec bins | Bins with >0 counts | Bins with >2000 counts | High rate bins dominated by noise | Noise dominated (total time) | Noise dominated (detector-on time) | Marked lightcurve |
|---|---|---|---|---|---|---|---|
| A | 7337 | 7318 | 0 | 0 | 0.00% | 0.00% | 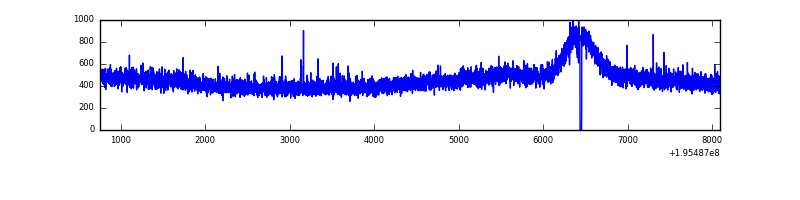 |
| B | 7337 | 7318 | 1 | 1 | 0.01% | 0.01% | 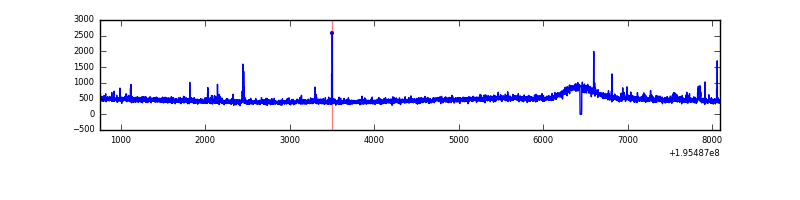 |
| C | 7337 | 7318 | 0 | 0 | 0.00% | 0.00% | 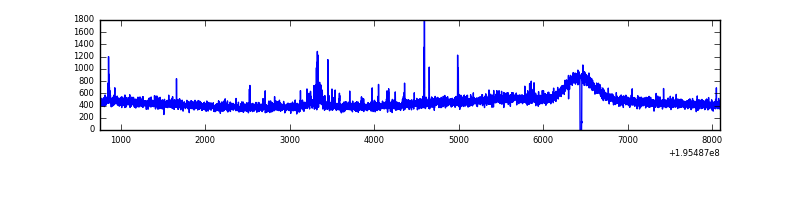 |
| D | 7337 | 7318 | 24 | 24 | 0.33% | 0.33% | 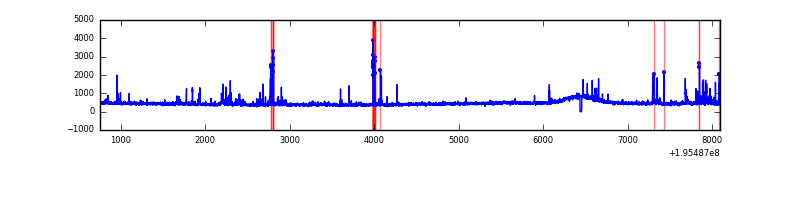 |
Top three noisy pixels from each quadrant. If the there are fewer than three noisy pixels in the level2.evt file, extra rows are filled as -1
| Pixel properties | Quadrant properties | ||||||
|---|---|---|---|---|---|---|---|
| Quadrant | DetID | PixID | Counts | Sigma | Mean | Median | Sigma |
| A | 12 | 194 | 9887 | 50.49 | 865 | 845 | 179.1 |
| A | 0 | 226 | 9219 | 46.76 | 865 | 845 | 179.1 |
| A | 14 | 63 | 7255 | 35.79 | 865 | 845 | 179.1 |
| B | 15 | 85 | 34878 | 199.4 | 877 | 853 | 170.6 |
| B | 4 | 48 | 15792 | 87.55 | 877 | 853 | 170.6 |
| B | 4 | 200 | 12683 | 69.33 | 877 | 853 | 170.6 |
| C | 14 | 223 | 51948 | 258.71 | 838 | 841 | 197.5 |
| C | 10 | 82 | 12325 | 58.13 | 838 | 841 | 197.5 |
| C | 8 | 112 | 9445 | 43.55 | 838 | 841 | 197.5 |
| D | 7 | 67 | 172101 | 863.23 | 831 | 808 | 198.4 |
| D | 2 | 14 | 74062 | 369.16 | 831 | 808 | 198.4 |
| D | 5 | 172 | 35444 | 174.55 | 831 | 808 | 198.4 |
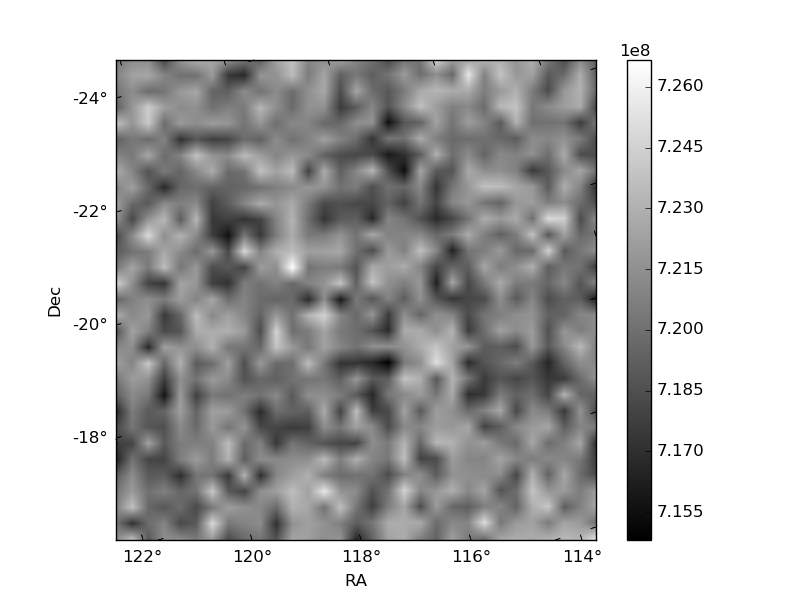
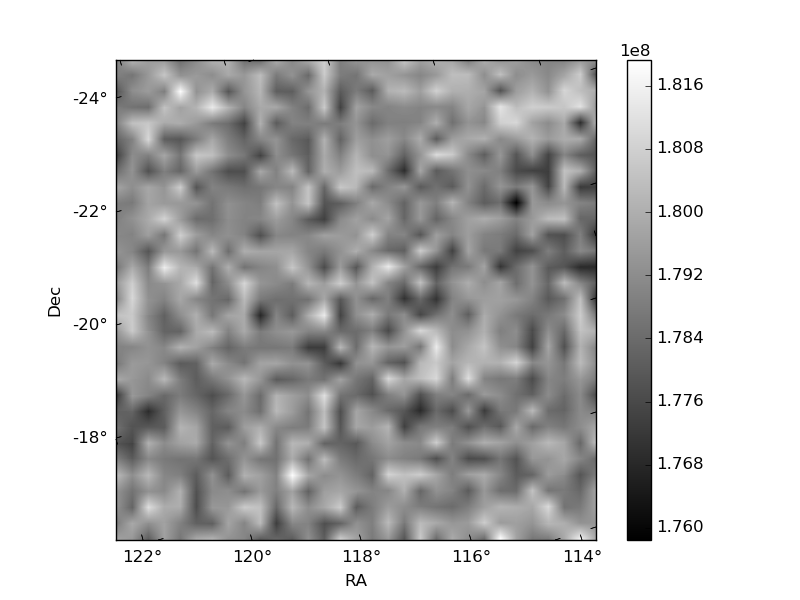
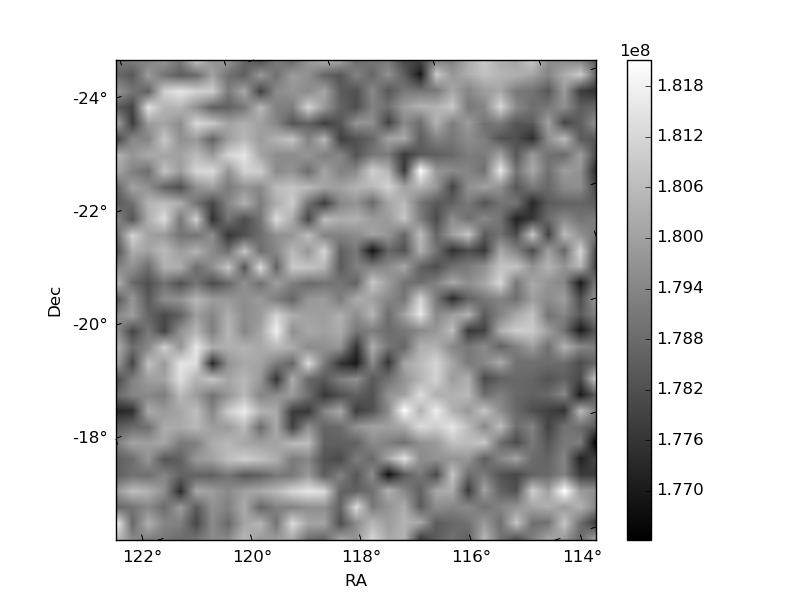
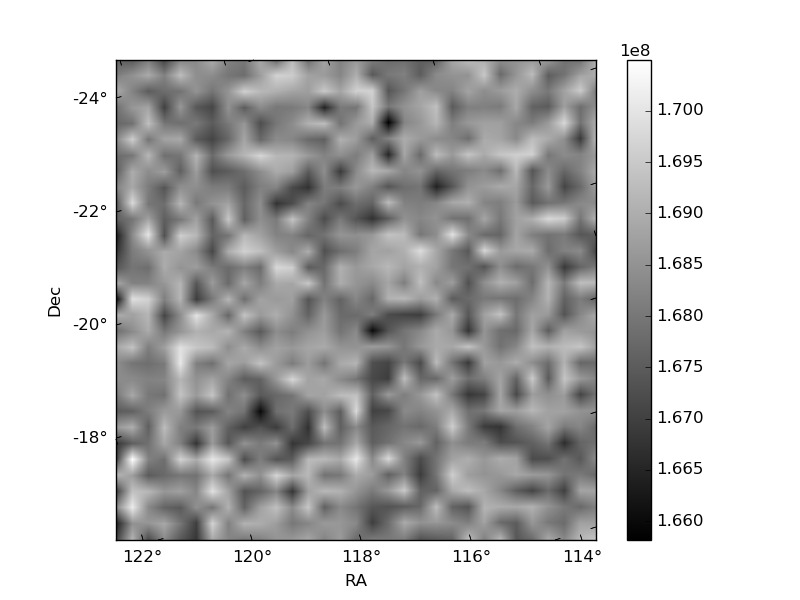
Histogram calculated using DETX and DETY for each event in the final _common_clean file
| Quadrant A | 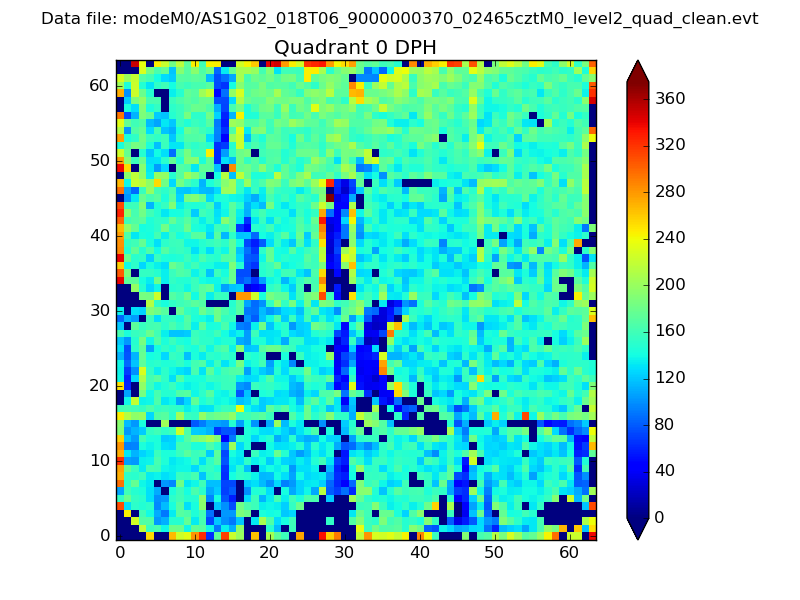 |
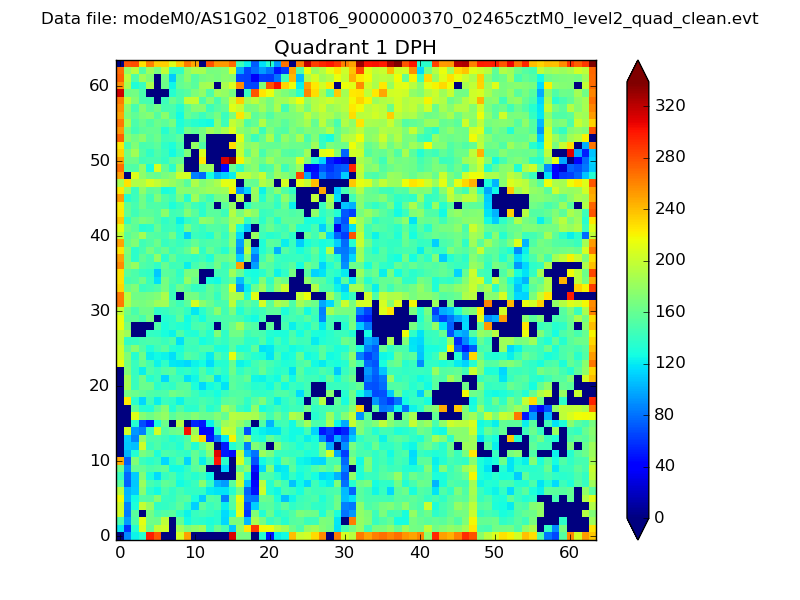 |
Quadrant B |
|---|---|---|---|
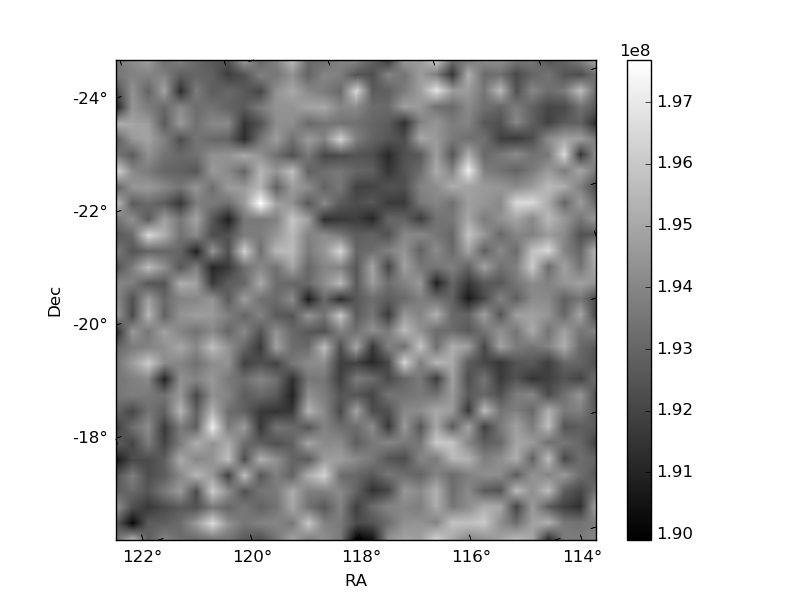
| Quadrant D | 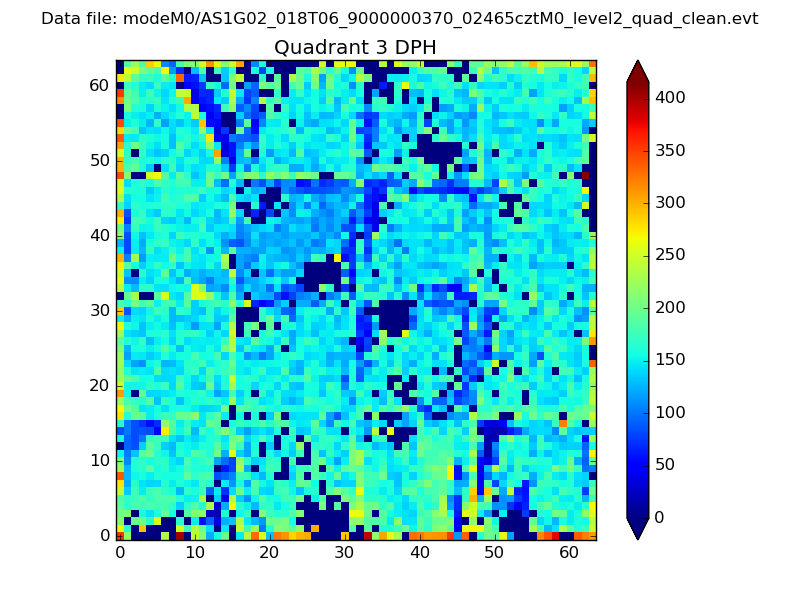 |
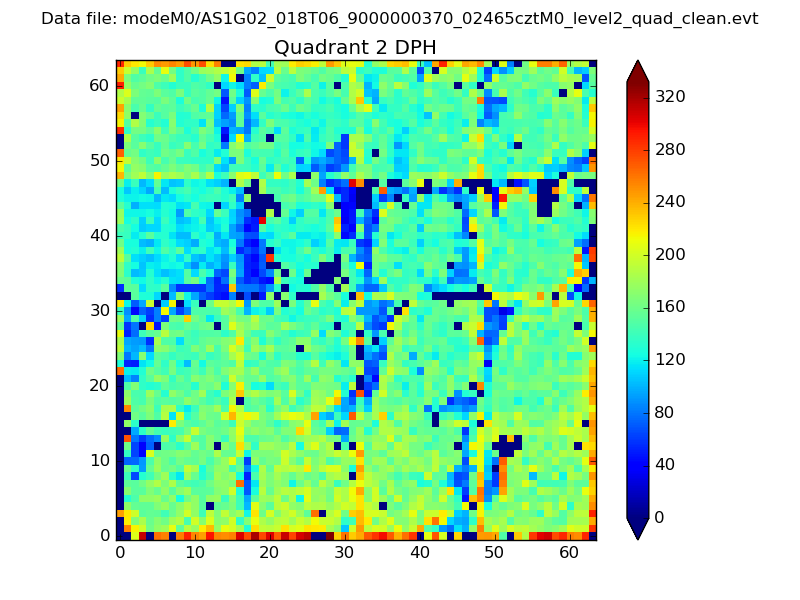 |
Quadrant C |
| Plot type | Count rate plots | Images |
|---|---|---|
| Comparison with Poisson distribution Blue bars denote a histogram of data divided into 1 sec bins. Red curve is a Poisson curve with rate = median count rate of data. |
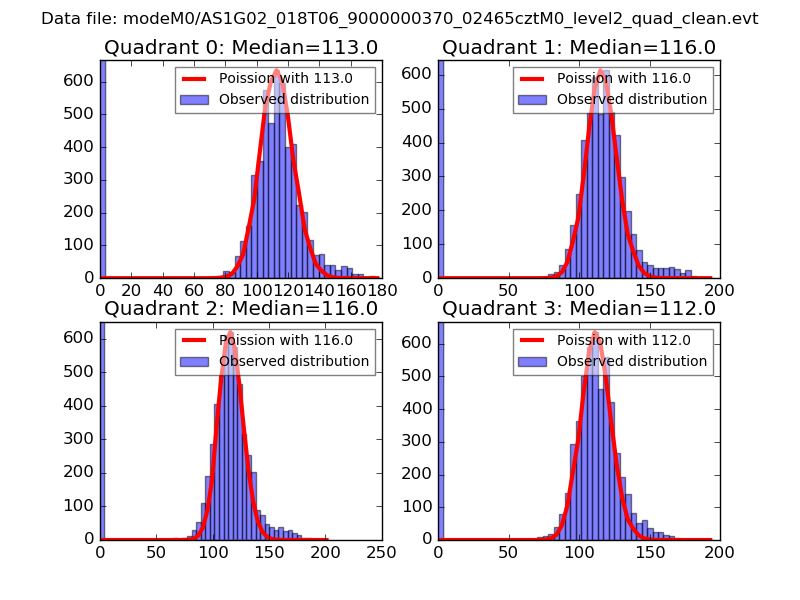 |
 |
| Quadrant-wise count rates Data is divided into 100 sec bins |
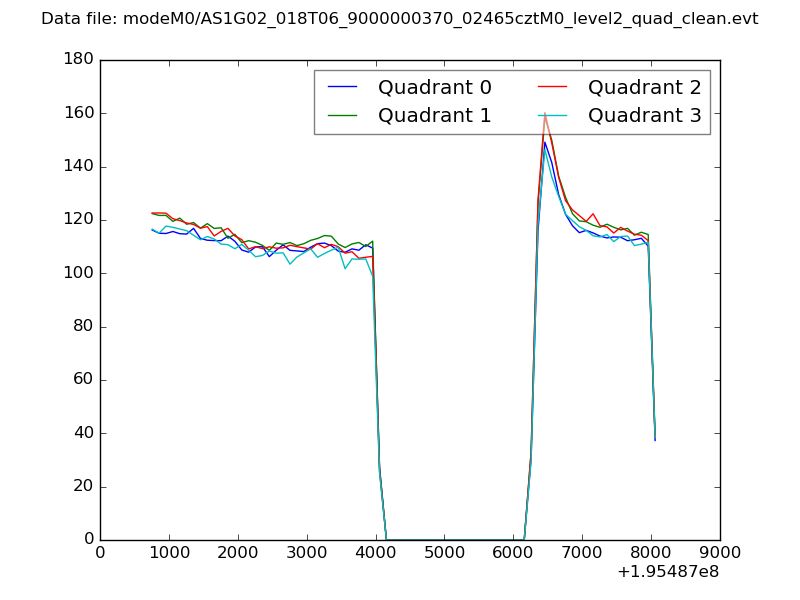 |
|
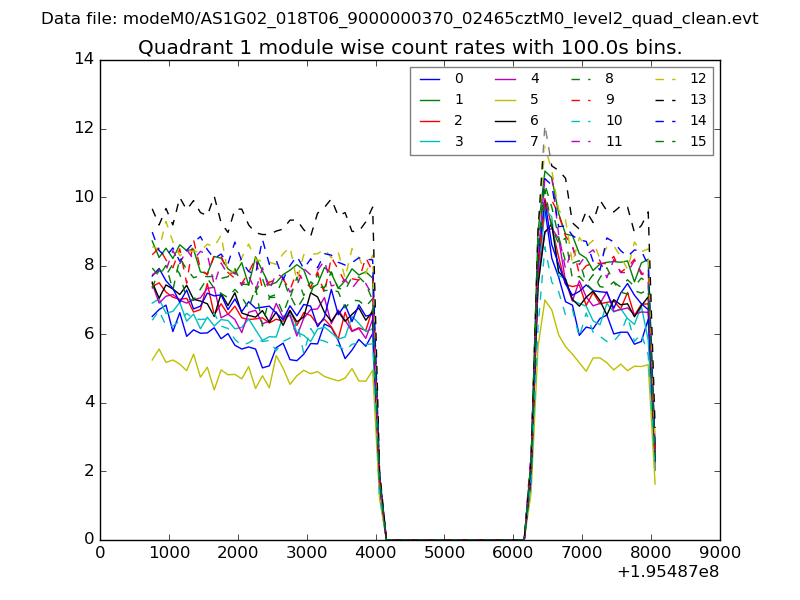
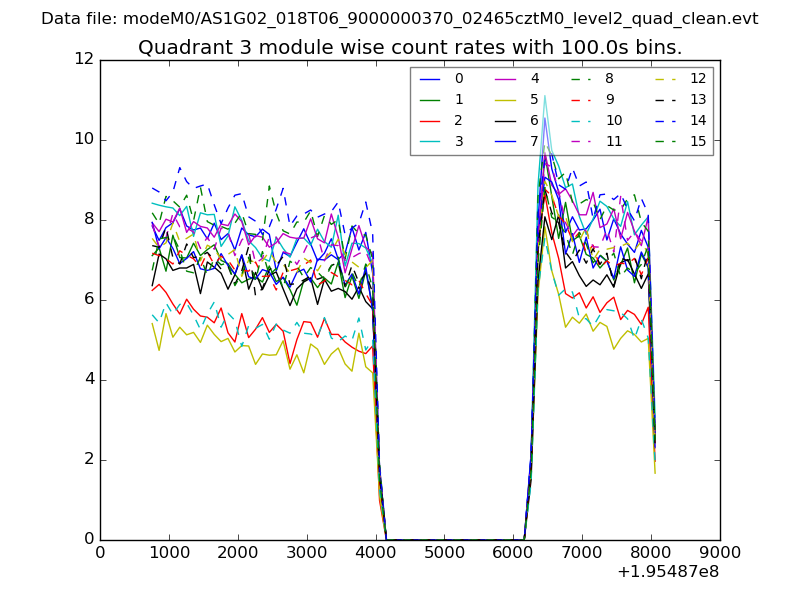
| Module-wise count rates for Quadrant A Data is divided into 100 sec bins |
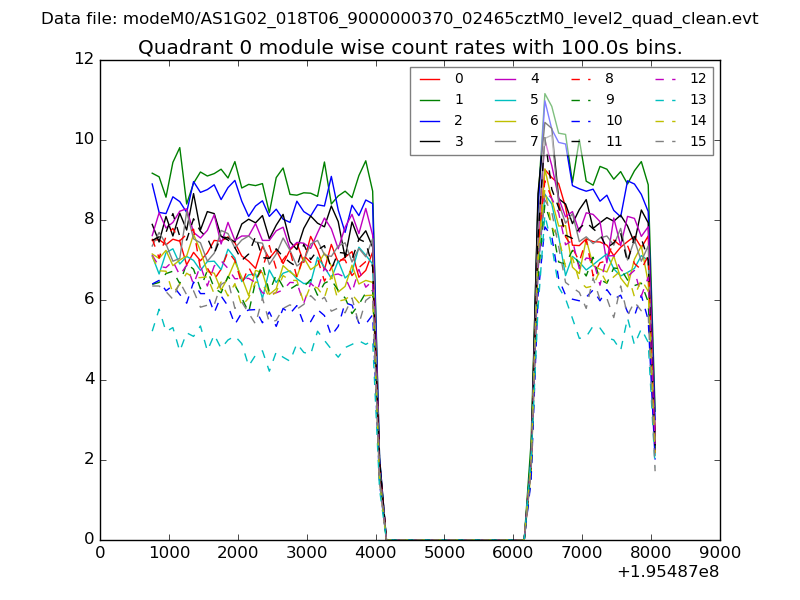 |
 |
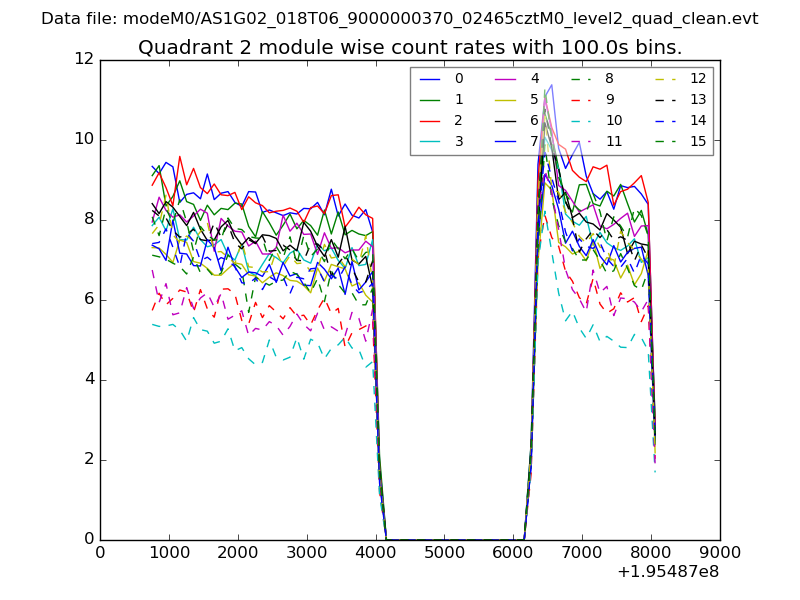
| Module-wise count rates for Quadrant B Data is divided into 100 sec bins |
 |
 |
| Module-wise count rates for Quadrant C Data is divided into 100 sec bins |
 |
 |
| Module-wise count rates for Quadrant D Data is divided into 100 sec bins |
 |
 |
| Parameter | Plot |
|---|---|
| CZT HV Monitor | 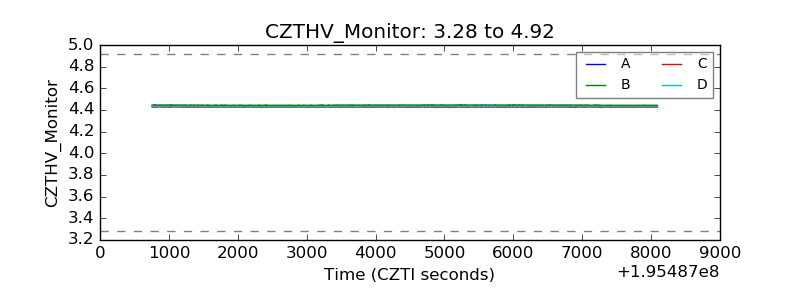 |
| D_VDD | 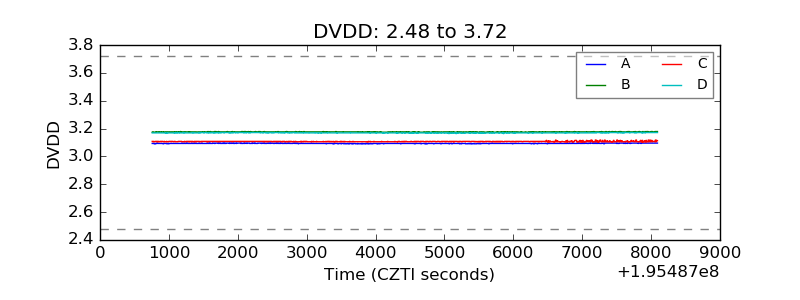 |
| Temperature 1 | 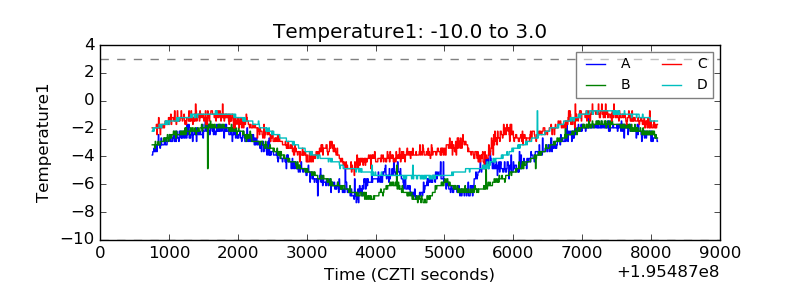 |
| Veto HV Monitor | 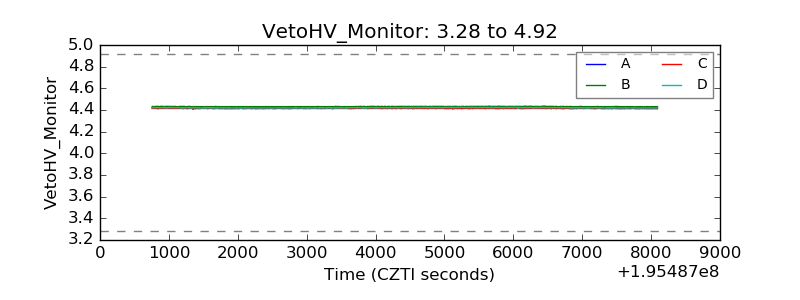 |
| Veto LLD | 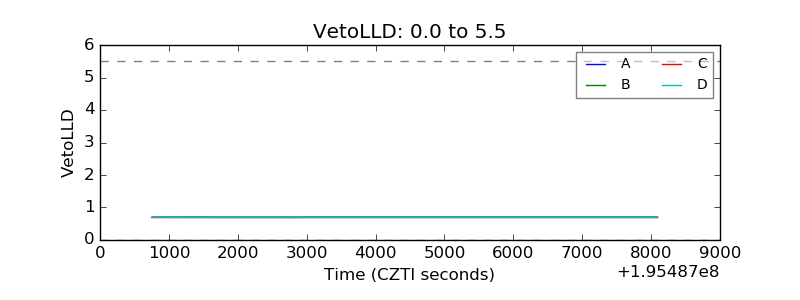 |
| Alpha Counter | 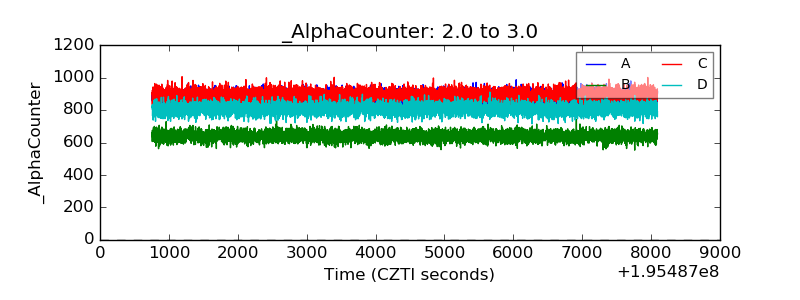 |
| _CPM_Rate | 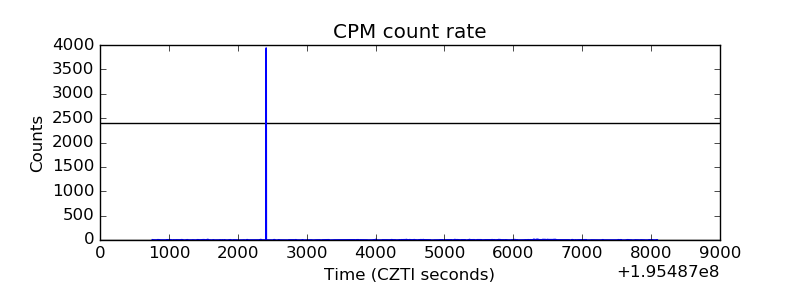 |
| CZT Counter | 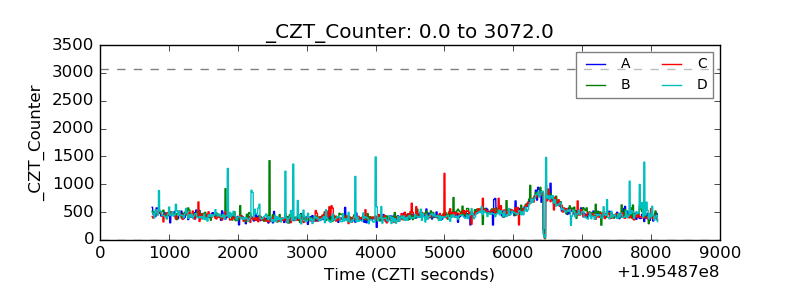 |
| +2.5 Volts monitor | 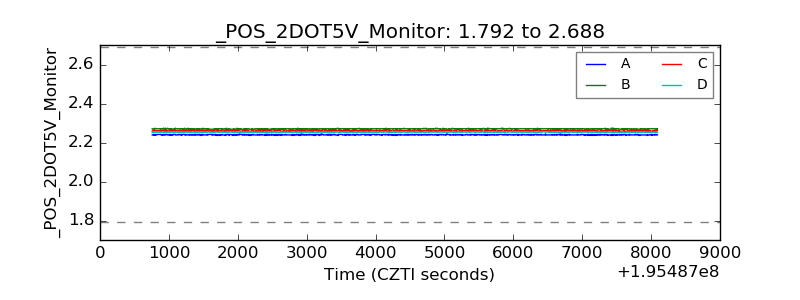 |
| +5 Volts monitor |  |
| _ROLL_ROT | 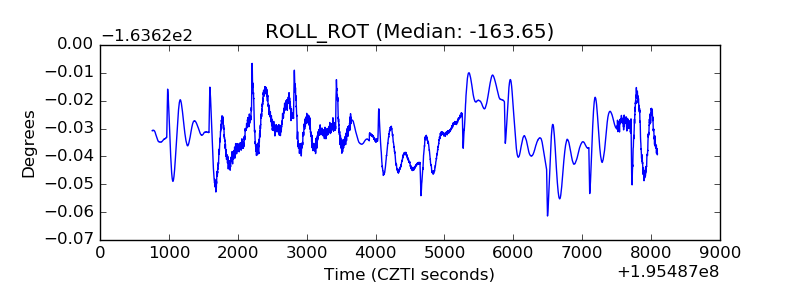 |
| _Roll_DEC | 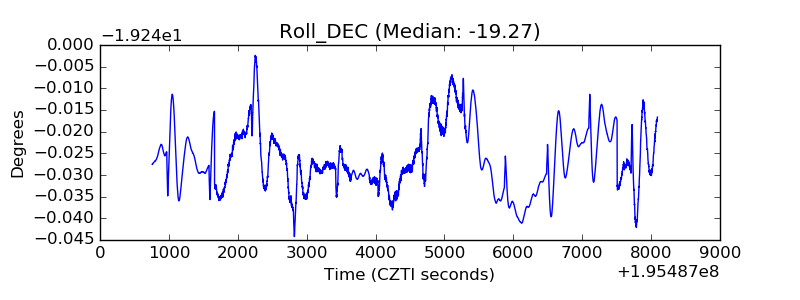 |
| _Roll_RA | 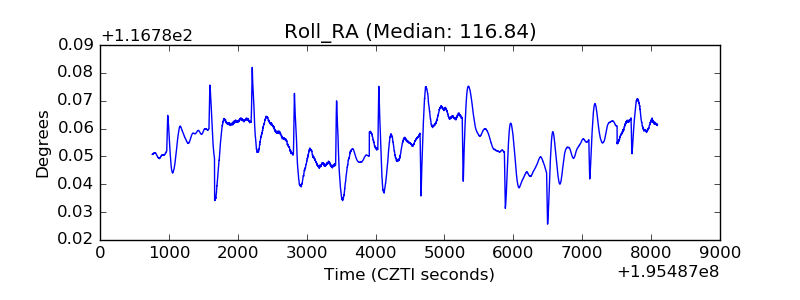 |
| Veto Counter | 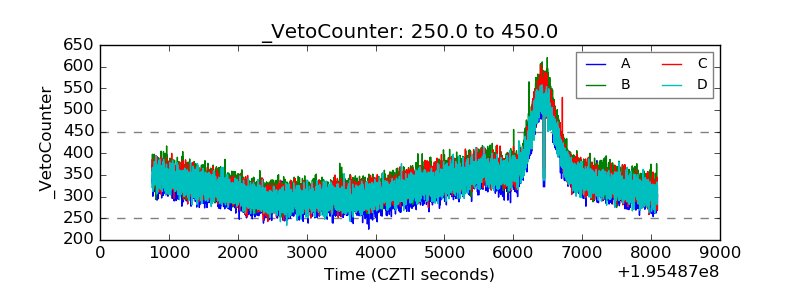 |