| Param | Original file | Final file |
|---|---|---|
| Filename | modeM0/AS1G02_018T06_9000000370_02466cztM0_level2.evt | modeM0/AS1G02_018T06_9000000370_02466cztM0_level2_quad_clean.evt |
| Size (bytes) | 532,860,480 | 104,189,760 |
| Size | 508.2 MB | 99.4 MB |
| Events in quadrant A | 4,250,981 | 647,190 |
| Events in quadrant B | 3,781,736 | 666,853 |
| Events in quadrant C | 3,623,998 | 659,498 |
| Events in quadrant D | 3,948,558 | 636,798 |
| Mode M9 | |||
|---|---|---|---|
| Quadrant | BADHDUFLAG | Total packets | Discarded packets |
| A | 0 | 1 | 0 |
| B | 0 | 1 | 0 |
| C | 0 | 1 | 0 |
| D | 0 | 1 | 0 |
| Mode SS | |||
|---|---|---|---|
| Quadrant | BADHDUFLAG | Total packets | Discarded packets |
| A | 0 | 160 | 0 |
| B | 0 | 160 | 0 |
| C | 0 | 160 | 0 |
| D | 0 | 160 | 0 |
| Mode M0 | |||
|---|---|---|---|
| Quadrant | BADHDUFLAG | Total packets | Discarded packets |
| A | 0 | 18309 | 3 |
| B | 0 | 16671 | 2 |
| C | 0 | 16408 | 2 |
| D | 0 | 17468 | 2 |
| Quadrant | Total seconds | Saturated seconds | Saturation percentage |
|---|---|---|---|
| A | 7835 | 349 | 4.454371% |
| B | 7835 | 108 | 1.378430% |
| C | 7835 | 43 | 0.548819% |
| D | 7836 | 84 | 1.071975% |
Noise dominated data is calculated using 1-second bins in cleaned event files. If a bin has >2000 counts, and if more than 50% of those come from <1% of pixels, then it is considered to be noise-dominated and hence unusable.
| Quadrant | # 1 sec bins | Bins with >0 counts | Bins with >2000 counts | High rate bins dominated by noise | Noise dominated (total time) | Noise dominated (detector-on time) | Marked lightcurve |
|---|---|---|---|---|---|---|---|
| A | 8015 | 7836 | 219 | 219 | 2.73% | 2.79% | 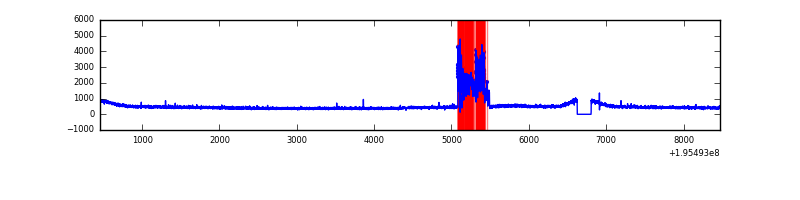 |
| B | 8015 | 7836 | 2 | 2 | 0.02% | 0.03% | 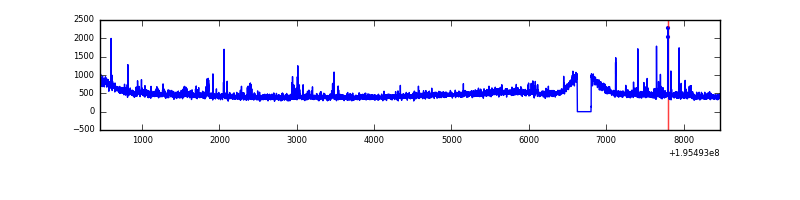 |
| C | 8015 | 7836 | 3 | 3 | 0.04% | 0.04% | 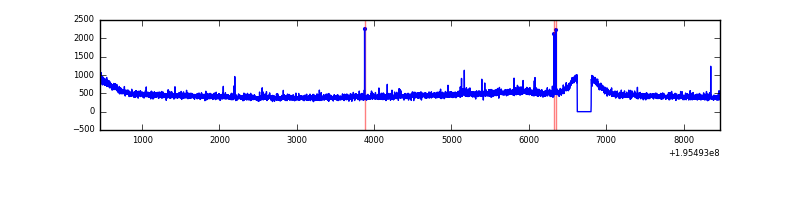 |
| D | 8016 | 7837 | 44 | 44 | 0.55% | 0.56% | 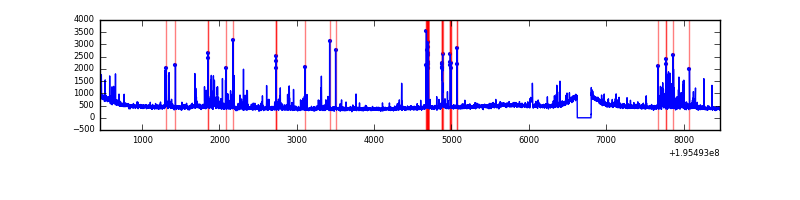 |
Top three noisy pixels from each quadrant. If the there are fewer than three noisy pixels in the level2.evt file, extra rows are filled as -1
| Pixel properties | Quadrant properties | ||||||
|---|---|---|---|---|---|---|---|
| Quadrant | DetID | PixID | Counts | Sigma | Mean | Median | Sigma |
| A | 8 | 192 | 727169 | 3851.11 | 913 | 893 | 188.6 |
| A | 12 | 194 | 10482 | 50.85 | 913 | 893 | 188.6 |
| A | 0 | 226 | 9800 | 47.23 | 913 | 893 | 188.6 |
| B | 4 | 48 | 47675 | 253.53 | 945 | 918 | 184.4 |
| B | 15 | 85 | 33899 | 178.83 | 945 | 918 | 184.4 |
| B | 5 | 6 | 16526 | 84.63 | 945 | 918 | 184.4 |
| C | 8 | 112 | 33129 | 150.94 | 904 | 904 | 213.5 |
| C | 12 | 4 | 22081 | 99.19 | 904 | 904 | 213.5 |
| C | 8 | 128 | 14536 | 63.85 | 904 | 904 | 213.5 |
| D | 7 | 67 | 189232 | 873.64 | 896 | 873 | 215.6 |
| D | 13 | 53 | 130276 | 600.19 | 896 | 873 | 215.6 |
| D | 2 | 184 | 54832 | 250.27 | 896 | 873 | 215.6 |
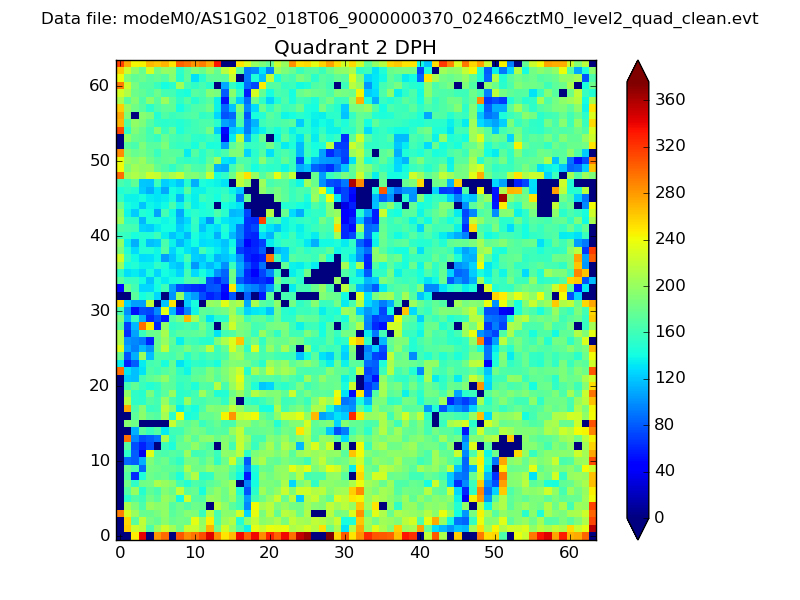
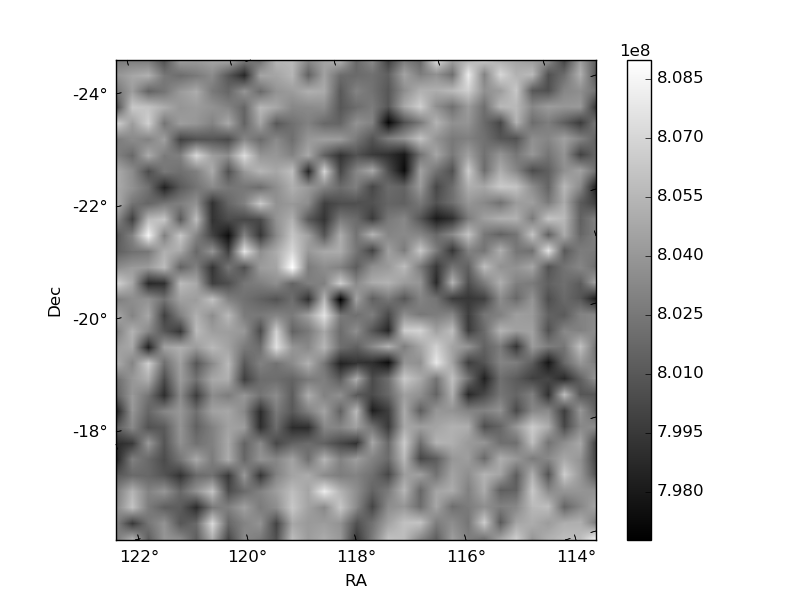
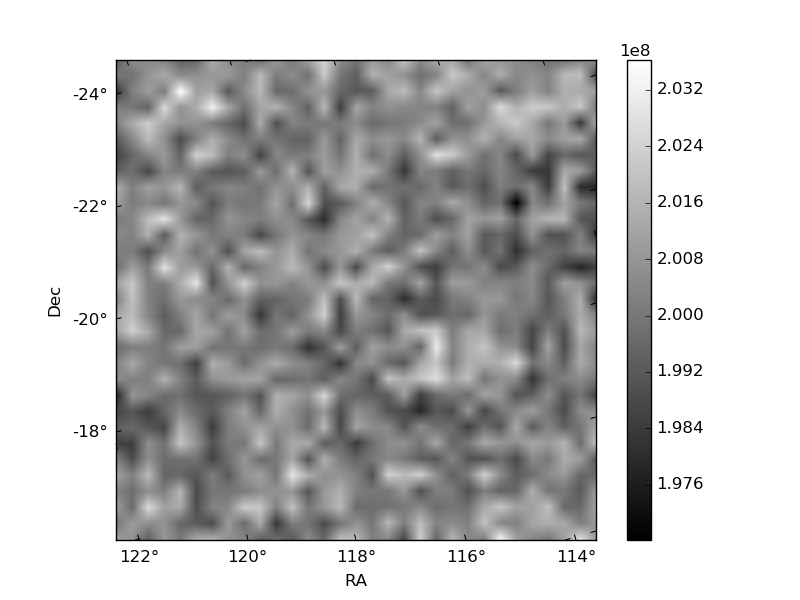
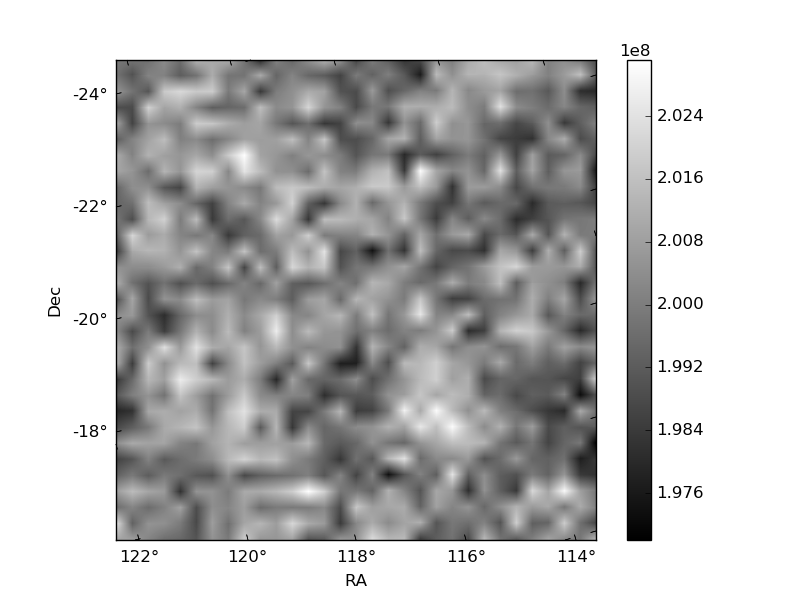
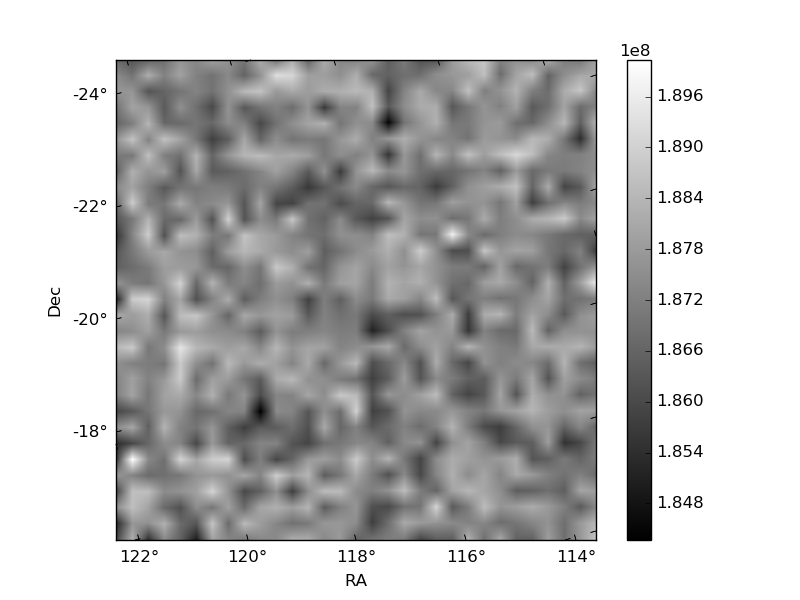
Histogram calculated using DETX and DETY for each event in the final _common_clean file
| Quadrant A | 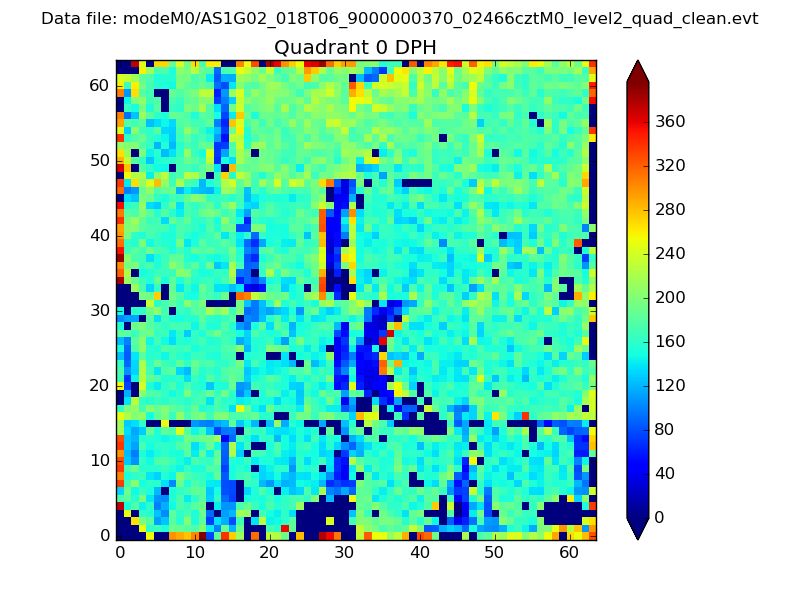 |
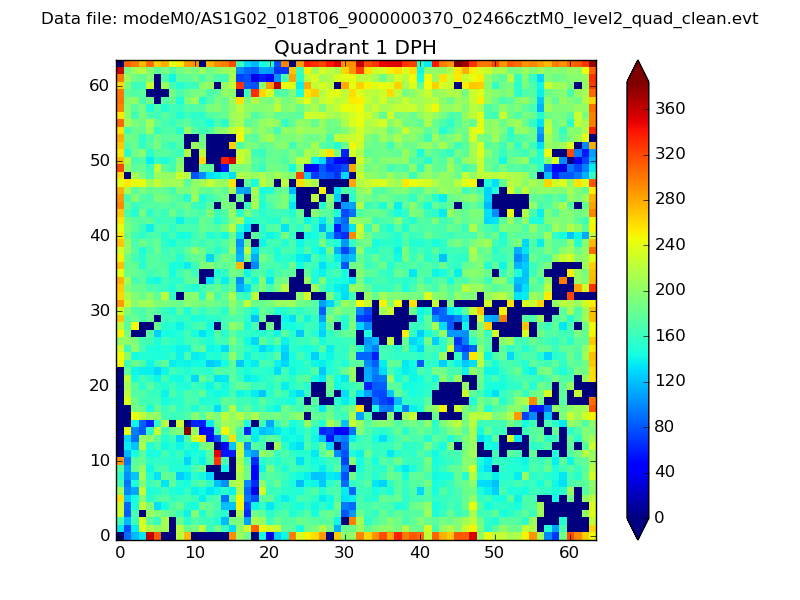 |
Quadrant B |
|---|---|---|---|
| Quadrant D | 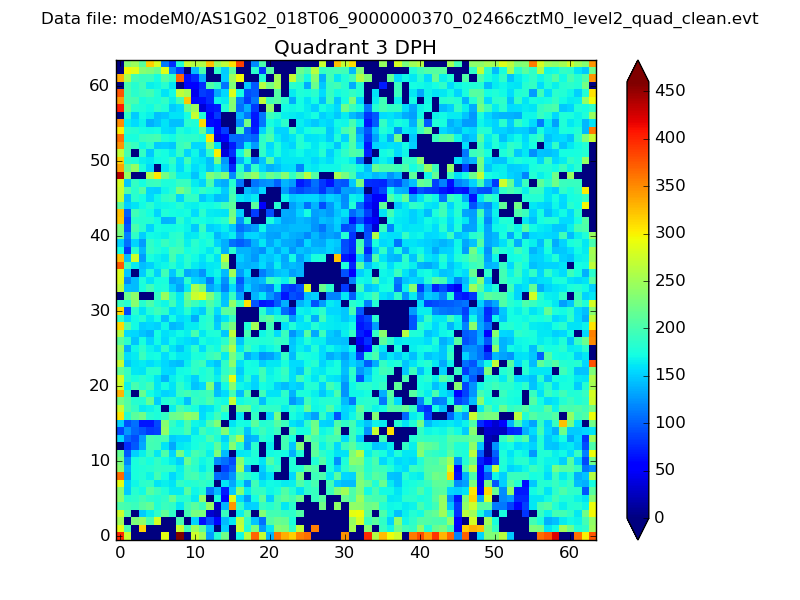 |
 |
Quadrant C |
| Plot type | Count rate plots | Images |
|---|---|---|
| Comparison with Poisson distribution Blue bars denote a histogram of data divided into 1 sec bins. Red curve is a Poisson curve with rate = median count rate of data. |
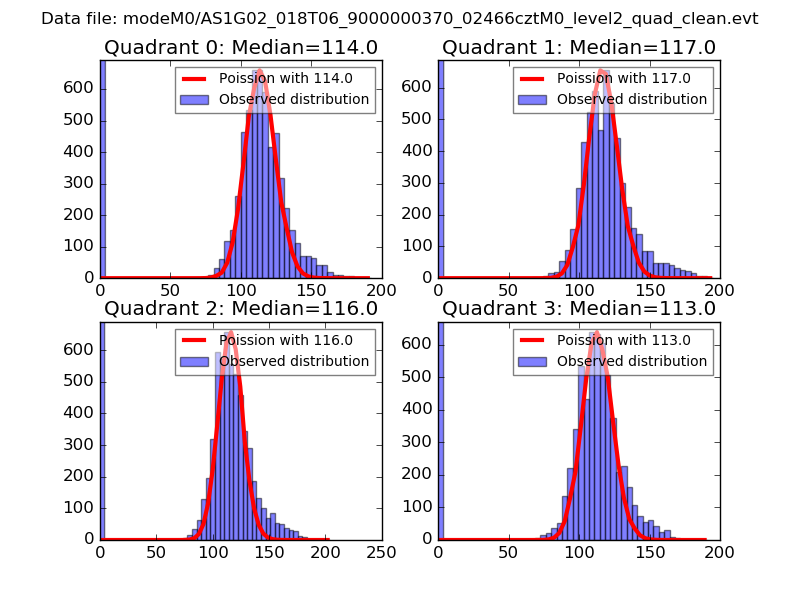 |
 |
| Quadrant-wise count rates Data is divided into 100 sec bins |
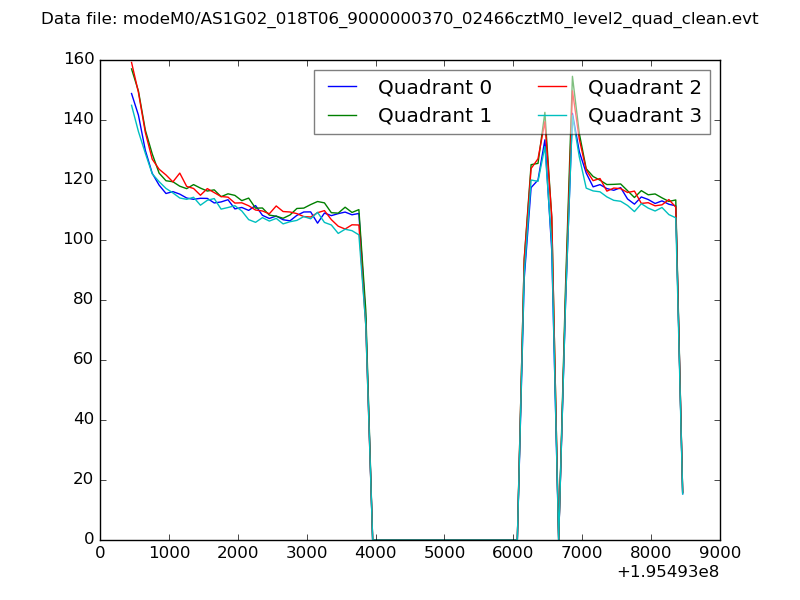 |
|
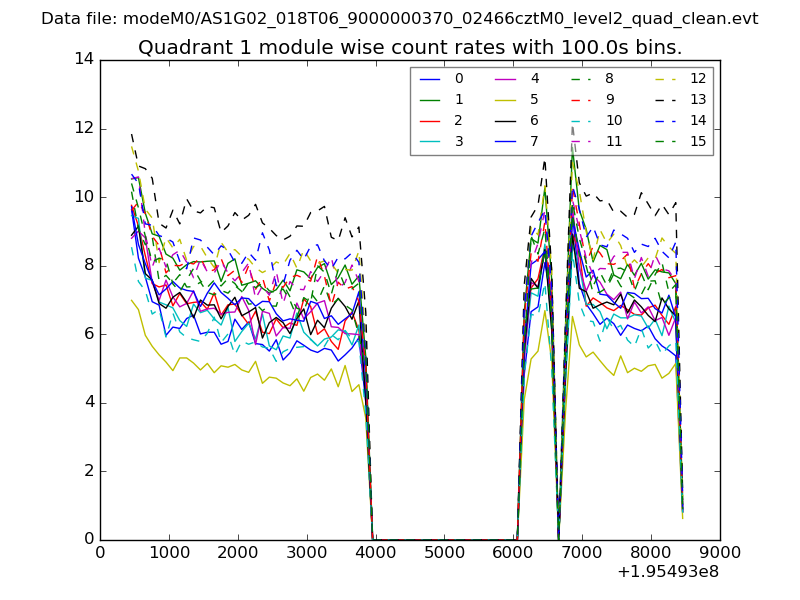
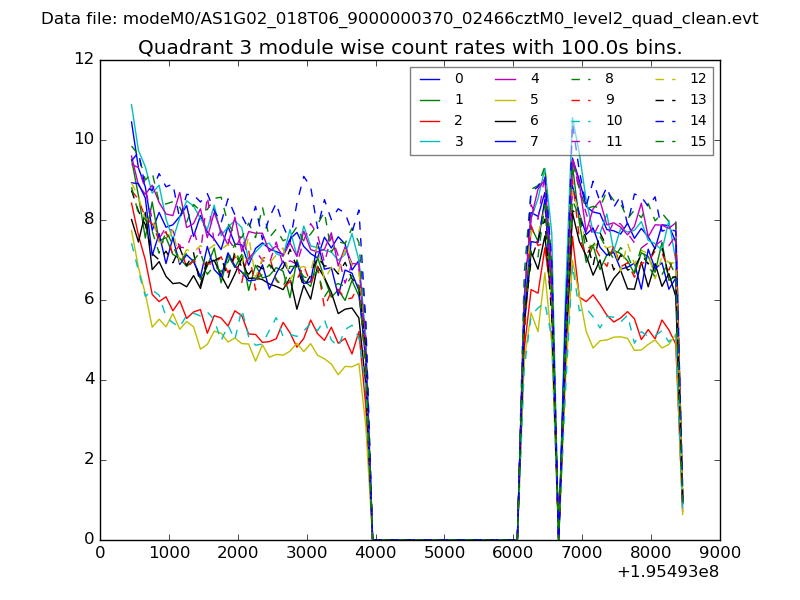
| Module-wise count rates for Quadrant A Data is divided into 100 sec bins |
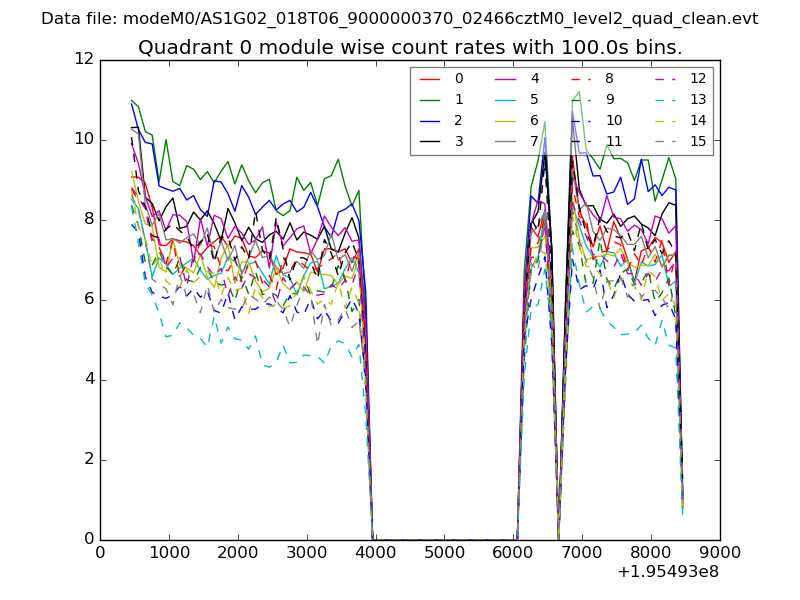 |
 |
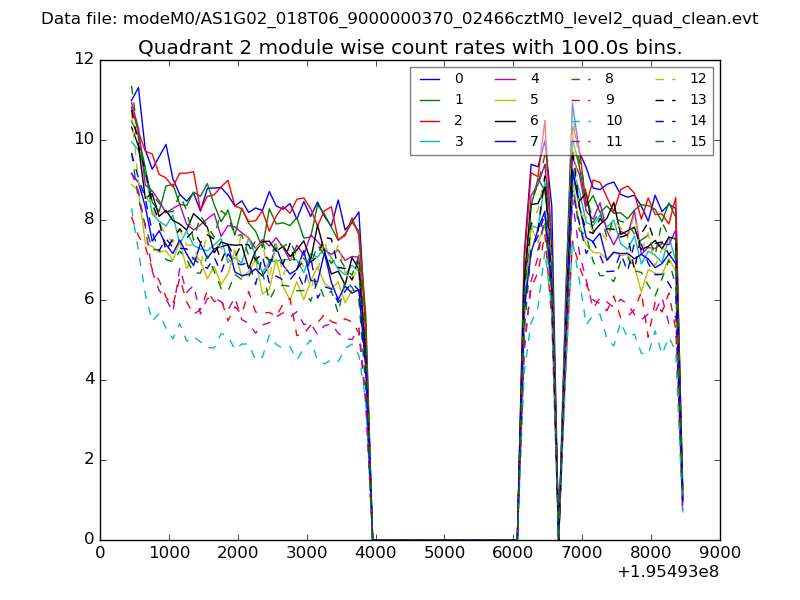
| Module-wise count rates for Quadrant B Data is divided into 100 sec bins |
 |
 |
| Module-wise count rates for Quadrant C Data is divided into 100 sec bins |
 |
 |
| Module-wise count rates for Quadrant D Data is divided into 100 sec bins |
 |
 |
| Parameter | Plot |
|---|---|
| CZT HV Monitor | 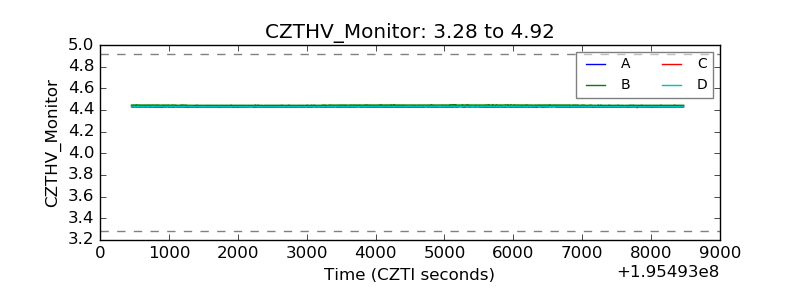 |
| D_VDD | 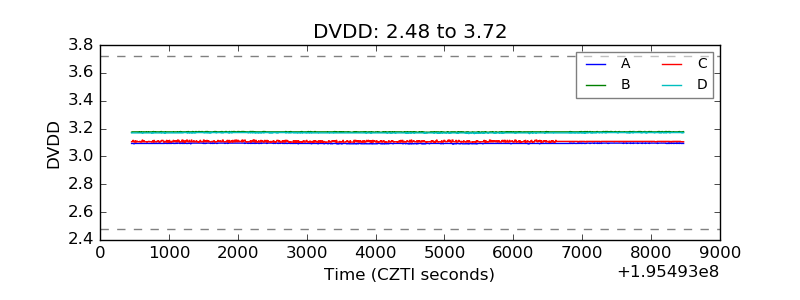 |
| Temperature 1 | 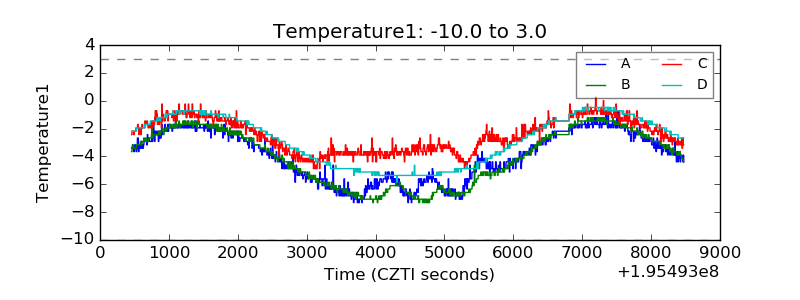 |
| Veto HV Monitor | 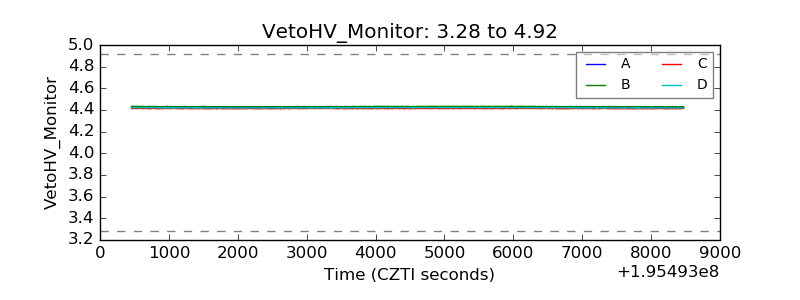 |
| Veto LLD | 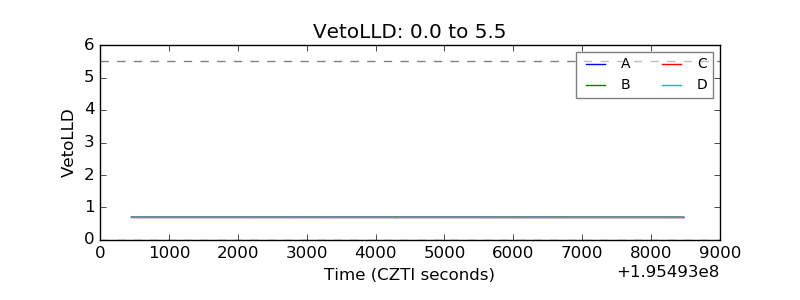 |
| Alpha Counter | 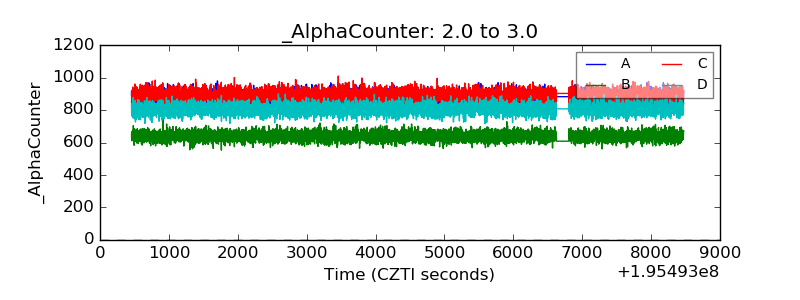 |
| _CPM_Rate | 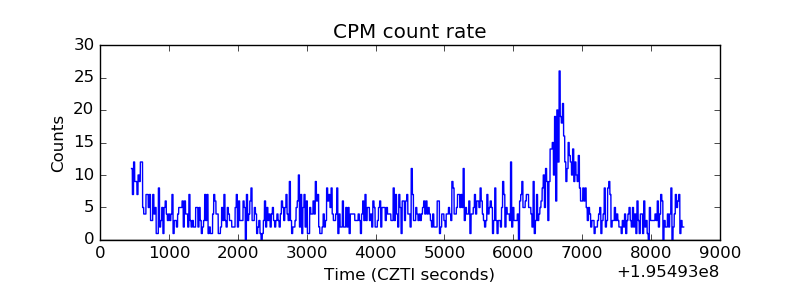 |
| CZT Counter | 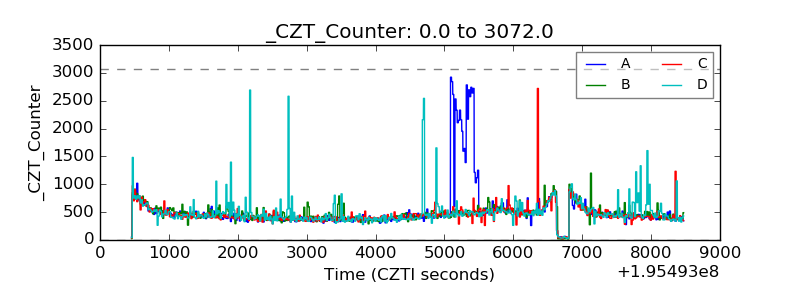 |
| +2.5 Volts monitor |  |
| +5 Volts monitor |  |
| _ROLL_ROT | 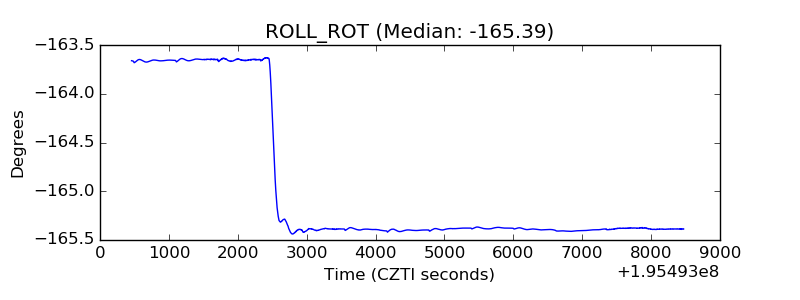 |
| _Roll_DEC | 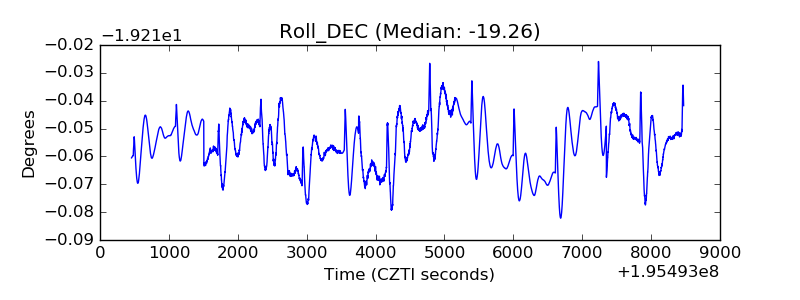 |
| _Roll_RA | 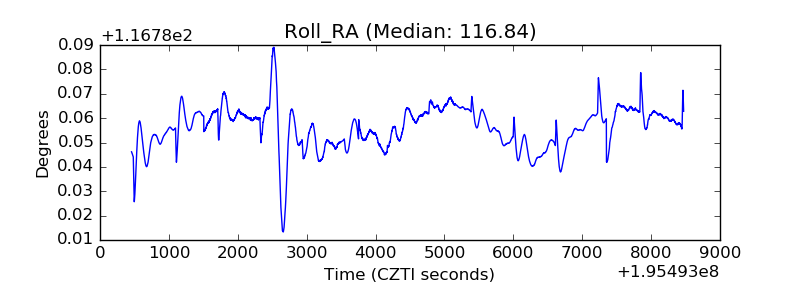 |
| Veto Counter | 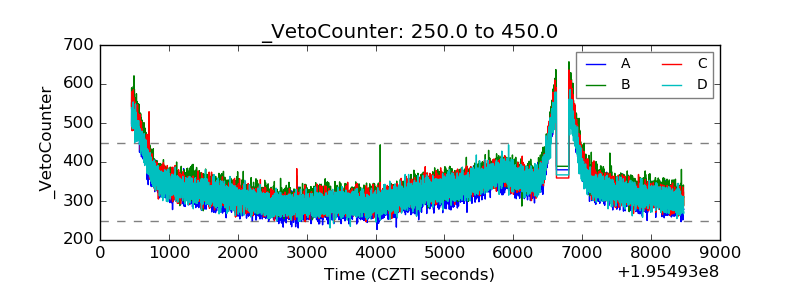 |